HAL Id: hal-00295784
https://hal.archives-ouvertes.fr/hal-00295784
Submitted on 15 Nov 2005
HAL is a multi-disciplinary open access
archive for the deposit and dissemination of
sci-entific research documents, whether they are
pub-lished or not. The documents may come from
teaching and research institutions in France or
abroad, or from public or private research centers.
L’archive ouverte pluridisciplinaire HAL, est
destinée au dépôt et à la diffusion de documents
scientifiques de niveau recherche, publiés ou non,
émanant des établissements d’enseignement et de
recherche français ou étrangers, des laboratoires
publics ou privés.
aerosol nucleation in the winter Arctic lower
stratosphere derived from in situ particle measurements
J. Curtius, R. Weigel, H.-J. Vössing, H. Wernli, A. Werner, C.-M. Volk, P.
Konopka, M. Krebsbach, C. Schiller, Anke Roiger, et al.
To cite this version:
J. Curtius, R. Weigel, H.-J. Vössing, H. Wernli, A. Werner, et al.. Observations of meteoric material
and implications for aerosol nucleation in the winter Arctic lower stratosphere derived from in situ
particle measurements. Atmospheric Chemistry and Physics, European Geosciences Union, 2005, 5
(11), pp.3053-3069. �hal-00295784�
www.atmos-chem-phys.org/acp/5/3053/ SRef-ID: 1680-7324/acp/2005-5-3053 European Geosciences Union
Chemistry
and Physics
Observations of meteoric material and implications for aerosol
nucleation in the winter Arctic lower stratosphere derived from in
situ particle measurements
J. Curtius1, R. Weigel2, H.-J. V¨ossing1, H. Wernli1, A. Werner3, C.-M. Volk3, P. Konopka4, M. Krebsbach4, C. Schiller4, A. Roiger5, H. Schlager5, V. Dreiling6, and S. Borrmann1,2
1Institute for Atmospheric Physics, Johannes Gutenberg-University, Mainz, Germany 2Max-Planck-Institute for Chemistry, Mainz, Germany
3Institute for Meteorology, Johann Wolfgang Goethe-University, Frankfurt, Germany 4ICG-2, Research Center J¨ulich, J¨ulich, Germany
5Institute for Physics of the Atmosphere, German Center for Air and Space DLR, Oberpfaffenhofen, Germany 6Flight Facilities, German Center for Air and Space DLR, Oberpfaffenhofen, Germany
Received: 20 May 2005 – Published in Atmos. Chem. Phys. Discuss.: 20 July 2005 Revised: 4 October 2005 – Accepted: 3 November 2005 – Published: 15 November 2005
Abstract. Number concentrations of total and non-volatile aerosol particles with size diameters >0.01 µm as well as particle size distributions (0.4–23 µm diameter) were mea-sured in situ in the Arctic lower stratosphere (10–20.5 km
altitude). The measurements were obtained during the
campaigns European Polar Stratospheric Cloud and Lee Wave Experiment (EUPLEX) and Envisat-Arctic-Validation (EAV). The campaigns were based in Kiruna, Sweden, and took place from January to March 2003. Measurements were conducted onboard the Russian high-altitude research air-craft Geophysica using the low-pressure Condensation Nu-cleus Counter COPAS (COndensation PArticle Counter Sys-tem) and a modified FSSP 300 (Forward Scattering Spec-trometer Probe). Around 18–20 km altitude typical total par-ticle number concentrations nt range at 10–20 cm−3
(am-bient conditions). Correlations with the trace gases nitrous oxide (N2O) and trichlorofluoromethane (CFC-11) are
dis-cussed. Inside the polar vortex the total number of particles
>0.01 µm increases with potential temperature while N2O is
decreasing which indicates a source of particles in the above polar stratosphere or mesosphere. A separate channel of the COPAS instrument measures the fraction of aerosol particles non-volatile at 250◦C. Inside the polar vortex a much higher fraction of particles contained non-volatile residues than out-side the vortex (∼67% inout-side vortex, ∼24% outout-side vortex). This is most likely due to a strongly increased fraction of meteoric material in the particles which is transported down-ward from the mesosphere inside the polar vortex. The high
Correspondence to: J. Curtius
fraction of non-volatile residual particles gives therefore ex-perimental evidence for downward transport of mesospheric air inside the polar vortex. It is also shown that the fraction of non-volatile residual particles serves directly as a suitable experimental vortex tracer. Nanometer-sized meteoric smoke particles may also serve as nuclei for the condensation of gaseous sulfuric acid and water in the polar vortex and these additional particles may be responsible for the increase in the observed particle concentration at low N2O. The
num-ber concentrations of particles >0.4 µm measured with the FSSP decrease markedly inside the polar vortex with increas-ing potential temperature, also a consequence of subsidence of air from higher altitudes inside the vortex. Another fo-cus of the analysis was put on the particle measurements in the lowermost stratosphere. For the total particle density rel-atively high number concentrations of several hundred par-ticles per cm3 at altitudes below ∼14 km were observed in several flights. To investigate the origin of these high number concentrations we conducted air mass trajectory calculations and compared the particle measurements with other trace gas observations. The high number concentrations of total par-ticles in the lowermost stratosphere are probably caused by transport of originally tropospheric air from lower latitudes and are potentially influenced by recent particle nucleation.
1 Introduction
Stratospheric aerosol particles influence ozone and at least temporarily climate and they are therefore of considerable current interest. They also play an important role for the
stratospheric sulfur cycle and for transport of meteoric ma-terial. The stratospheric background aerosol is mainly com-posed of sulfuric acid (H2SO4) and water with some
inclu-sions of meteoric material (Junge and Manson, 1961; Bigg et al., 1970; Murphy et al., 1998; Arnold et al., 1998; Cziczo et al., 2001). From their mass spectrometric measurements, Cziczo et al. (2001) concluded that typically half the strato-spheric particles contain meteoric iron of 0.5 to 1 weight percent. Renard et al. (2005) report balloon-borne strato-spheric extinction measurements. At ∼30 km altitude unex-pected spectral structures around 640 nm wavelength were interpreted as signals from large particles (larger than several hundred nanometers in size) of most likely extraterrestrial origin. Recently, Baumgardner et al. (2004) reported large fractions of light absorbing particles such as soot in the low-ermost Arctic stratosphere at altitudes of 9–12 km.
Several balloon-borne (e.g. Hofmann and Rosen, 1985; Hofmann, 1988, 1990; Hofmann et al., 1989) as well as aircraft-borne studies (Wilson et al., 1989, 1990, 1992; Dye et al., 1992; Borrmann et al., 1993, 2000a) of stratospheric background aerosol in the Arctic and Antarctic winter have been performed with condensation nucleus counters (CNC) and optical particle counters. From balloon-borne CNC mea-surements evidence was found for the formation of new par-ticles in the polar winter stratosphere at altitudes around 22– 26 km (Hofmann and Rosen, 1985; Hofmann, 1988, 1990; Hofmann et al., 1989). Wilson et al. (1989, 1990, 1992) con-firmed these findings and observed an anti-correlation of the particle mixing ratio with the stratospheric tracer N2O for
N2O<150 ppbv. From that they concluded that a source of
particles must exist in the Arctic stratosphere.
Furthermore, several model studies that applied classical nucleation theory were able to confirm such particle nucle-ation in the polar stratosphere from nuclenucle-ation of sulfuric acid and water (Hamill et al., 1990; Zhao et al., 1995; Mills et al., 1999; Timmreck, 2001). At lower altitudes (9–13 km), Lee et al. (2003) detected recent nucleation events in the Arc-tic lowermost stratosphere. From a comparison of the mea-surements with a model by Lovejoy et al. (2004) the nucle-ation was attributed to ion-induced nuclenucle-ation of sulfuric acid and water.
Only few investigations have studied the volatility of stratospheric background particles (e.g. Rosen, 1970; Desh-ler et al., 1993; Brock et al., 1995) and to our knowledge no such study was conducted in the Arctic winter stratosphere. In these volatility experiments the stratospheric aerosol is usually passed through a heated inlet. The temperature of the probed aerosol is thereby raised above the boiling point for H2SO4/H2O solutions. Particle residuals remaining
non-volatile at these temperatures are counted. From their mea-surements of total and non-volatile aerosol particles Brock et al. (1995) concluded that new particles are likely to form from H2SO4and H2O in the tropical tropopause layer and are
then transported and distributed by the Brewer-Dobson cir-culation and by isentropic flow throughout the stratosphere.
They are thought to constitute the major source of the strato-spheric aerosol particles on which further gaseous H2SO4
and H2O condenses in the stratosphere (Hamill et al., 1997).
A large fraction of the meteoroides entering the Earth’s at-mosphere ablate in the mesosphere at altitudes above 75 km. The ablated material composed of elements as iron, magne-sium and silicon re-condenses to form nanometer-sized par-ticles termed meteoric smoke (Hunten et al., 1980; Turco et al., 1981; Cziczo et al., 2001; Plane 2003). Numerical mod-els of the mesospheric and stratospheric circulation show that mesospheric air descends rapidly into the stratospheric polar vortex during winter. From these models it is estimated that most of the mesospheric air is funneled into the stratospheric polar vortex every winter (Fisher et al., 1993; Plumb et al., 2003). Observational evidence for a significant fraction of mesospheric air in the lower stratospheric polar vortex comes from CO-N2O relation measurements and from air mass ages
determined by in situ CO2and SF6measurements (Plumb et
al., 2003). An enhancement of meteoric smoke particles is therefore expected to occur inside the Arctic vortex (Prather and Rodriguez, 1988; Plane, 2003) and diabatic subsidence of air masses by radiative cooling will transport some of the meteoric material all the way down to 16 km (∼400 K) by the end of winter (Plumb et al., 2003).
Measurements of particles larger than ∼0.3 µm in diam-eter in the polar stratosphere reported a strong decrease of the number concentration of these particles for the Antarc-tic as well as for the ArcAntarc-tic stratosphere at altitudes >18 km (Hofmann et al., 1989; Borrmann et al., 2000a). These mea-surements are supported by satellite meamea-surements which re-vealed a reduction in aerosol extinction by more than 1 or-der of magnitude inside the polar vortex compared to outside (McCormick et al., 1983; Kent et al., 1985; Thomason et al., 1997). As the aerosol extinction is caused by the optically active particles larger than ∼0.3 µm in diameter these find-ings are consistent with the in situ measurements. Note that the results from satellite observations are potentially biased as some a priori hypotheses about the shape of the aerosol distribution and the refractive indices have to be included (Renard et al., 2002).
Two automated stratospheric aerosol counters COPAS (COndensation PArticle Counter System) have been built and characterized. These counters were flown aboard the Russian high-altitude research aircraft Geophysica. Here we intro-duce the COPAS instrument and present particle data from the two recent Arctic measurement campaigns “European Polar Stratospheric Cloud and Lee Wave Experiment – EU-PLEX” and “Envisat Arctic Validation – EAV”. The cam-paigns were conducted from 10 January to 19 March 2003, and were based in Kiruna, Sweden. The focus of our studies is on the differences in CN-concentration and CN-volatility inside and outside of the polar vortex. Number concentra-tions of larger particles (>0.4 µm) and aerosol size distribu-tions measured simultaneously aboard Geophysica with an FSSP 300 instrument are discussed. In Sect. 3.4 we focus on
the observed high variability of particle concentrations mea-sured in the lowermost stratosphere.
2 Instrumental
The COPAS instrument is a two channel aerosol counter de-signed for automated low pressure measurements of the par-ticle number concentration. It is a continuous flow conden-sation nucleus counter (CNC) operating with 1-butyl alcohol (butanol) as its working fluid. The COPAS instrument has been designed in accordance to the Denver University CNC (Wilson et al., 1983). Downstream from the air intake the flow is split into two subflows: A filtered particle-free sub-flow is saturated with butanol vapor at 30◦C. Subsequently, sample air containing particles is added to the center of the saturated sheath flow. Then the total flow is cooled to 2◦C in a condenser. By condensation of butanol vapor the particles grow to sizes >1 µm and are optically detected and counted. Aerosol sample flow and total flow are monitored and con-trolled by use of calibrated differential pressure sensors. Op-timum flow conditions are maintained by use of a regulated pump. A series of laboratory measurements showed that a total counting efficiency close to unity can be achieved by adjusting the flow properly at low pressure conditions.
Data are recorded at 1 Hz, temperatures of the saturator and condenser are controlled within 0.2◦C, measurement un-certainty is <20% for stratospheric particle concentrations. The lower cut-off limit (smallest detectable aerosol particle diameter) of the counters has been determined experimen-tally to be ∼10 nm for sulfuric acid particles and the cut-off is slightly dependent on operating pressure (cf. Hermann and Wiedensohler, 2001). In our laboratory experiments we found the cut-off for the COPAS instrument when operating with butanol and detecting sulfuric acid-water particles to be 9.7±1.6 at 70 hPa, 8.1±1.7 nm at 120 hPa and 5.8±2.0 nm at 200 hPa for one channel and 9.5±2.2 nm at 120 hPa and 7.4±2.2 nm at 200 hPa for the other channel. Operation of the instrument and data acquisition are fully automated.
The intake of the sample inlet protrudes outside of the Geophysica’s boundary layer and it consists of two serial dif-fusors which slow down the sample air from the free flow to pumping velocity at near-isokinetic conditions (Wilson et al., 1992). The inlet faces into flight direction and the diffusors are constructed with opening angles of 6.7◦ to reduce tur-bulence losses. Because the number concentration of strato-spheric background aerosol during the present volcanically quiescent period is by far dominated by particles with diam-eters <0.25 µm diameter we consider the sampling to be free of significant losses or enhancements from the inlet.
The first channel of the instrument measures the total num-ber of aerosol particles nt. The second channel is heated
to 250◦C before the sample flow enters the instrument and thereby aerosol particles completely volatile at this temper-ature are evaporated and only the non-volatile fraction nnv
is counted. Particles purely composed of sulfuric acid and water are volatile at this temperature. Therefore the differ-ence between the two channels gives an estimate of the frac-tion of stratospheric particles not composed entirely of sul-furic acid and water. Note that with a 10-nm cut-off diame-ter already very small non-volatile residues of originally pre-dominantly volatile particles are counted as non-volatile. For example, a 150-nm particle composed of 99.5 vol.-% sulfu-ric acid and water and 0.5 vol.-% non-volatile residues will leave a residue of approximately 26 nm diameter which will still be counted. The aerosol heater is a 1 m long, 12 mm i.d. stainless-steel tube with heating wires and insulation wrapped around the tube. Careful laboratory measurements confirmed that pure sulfuric acid particles of 10–200 nm di-ameter are completely evaporated with this heater. For these lab studies we used size-selected, freshly nucleated sulfu-ric acid particles, generated as described by Middlebrook et al. (1995). We observed that already small contaminations with e.g. ammonia will leave a considerable amount of resid-ual particles and care has to be taken to avoid such contami-nation (cf. Middlebrook et al., 1995). Diffusion losses in the aerosol heater were calculated to be negligible for particles >20 nm, and laboratory tests confirmed these calculations. Note that most of the previous studies on particle volatility in the stratosphere used instruments that detect only parti-cles >0.3 µm in diameter. Small residual partiparti-cles like me-teoric smoke particles of a few nanometers in size will not be detected as residual particles by these instruments (Rosen, 1970; Deshler et al., 1993).
Two identical COPAS instruments have been built and we were able to operate both simultaneously onboard of Geo-physica for five flights within the EUPLEX project. The two COPAS instruments had separate inlets of identical design and one instrument was placed in a bay in the fuselage of the aircraft, the other was located in an instrument bay under the left wing, behind the landing gear compartment. Only one aerosol heater was installed, therefore a total of one heated and three unheated channels was available for these flights. For future measurement campaigns it is planned to operate the three unheated channels with different saturator temper-atures to allow for different cut-off diameters enabling the identification and sizing of freshly nucleated ultrafine parti-cles (Brock et al., 2000).
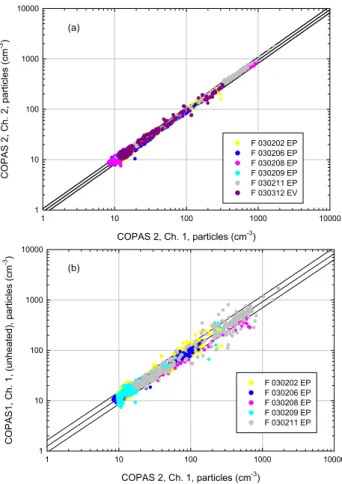
A scatter plot of the two unheated channels of the second COPAS instrument is shown in Fig. 1a and a plot of channel 1, COPAS 1, versus channel 1, COPAS 2, is shown in Fig. 1b for the data of the EUPLEX flights. The two channels of the COPAS 2 instrument agree very well over the entire measure-ment range and a linear regression yields a slope of 1.003, an offset of −0.03 and r2=0.996. The two unheated channels of the different instruments still agree well but the correlation is not as good (slope =0.95, offset =0.1, r2=0.985). Some of the scatter in Fig. 1b is caused by the fact that we were only able to synchronize the COPAS 2 system clock with the uni-versal aircraft clock, but due to technical problems not the
COPAS 2, Ch. 1, particles (cm-3) 1 10 100 1000 10000 COP A S 2, Ch. 2, p art ic le s ( cm -3) 1 10 100 1000 10000 COPAS 2, Ch. 1, particles (cm-3) 1 10 100 1000 10000 CO PA S 1, Ch. 1, (unhe at ed), part icle s (cm -3) 1 10 100 1000 10000 F 030202 EP F 030206 EP F 030208 EP F 030209 EP F 030211 EP F 030202 EP F 030206 EP F 030208 EP F 030209 EP F 030211 EP F 030312 EV (a) (b)
Fig. 1. Comparison of total particle concentration measurements nt
(15-s averages) by the two unheated channels of COPAS 2 includ-ing a linear regression and 95% prediction intervals (a). Compari-son of particle concentration measurements by unheated channel of COPAS 1 and unheated channel of COPAS 2 including a linear re-gression and 95% prediction intervals for the five EUPLEX flights when both instruments were operated simultaneously (b).
COPAS 1 clock, which caused slight shifts in the occurrence of distinct concentration features and degraded the correla-tion. We include the 95% prediction interval in Fig. 1. For Fig. 1a a pair of data points falls with 95% probability in an interval ±14% around the regression line, and for Fig. 1b the 95% prediction interval is ±22%, respectively. We give par-ticle concentrations usually as number of parpar-ticles per cubic centimeter at ambient temperature and pressure conditions. Only for the correlation with the trace gases N2O and
CFC-11 particle mixing ratios are presented as particles per mg of air to allow for direct comparison with other publications.
The modified Forward Scattering Spectrometer Probe SPP-300 (FSSP-SPP 300) operated on Geophysica measures the size distribution of aerosol particles between 0.4 and
23 µm. The instrument has been described in detail
be-fore (Baumgardner et al., 1992; Borrmann et al., 2000a, b; Thomas et al., 2002). However for the configuration as uti-lized on Geophysica during EUPLEX and EAV the original
electronics were replaced by the Signal Processing Package (SPP) by Droplet Measuring Systems Inc. In addition, the computer for data acquisition and instrument control was in-tegrated into the cylindrical standard instrument container which is mounted below Geophysica’s left wing. In this way no separate data acquisition system box is required which considerably reduces radio frequency interference and noise contamination problems. In order to accommodate the am-bient conditions of temperatures as low as −90◦C and pres-sures down to 50 hPa specialized thermal control was also implemented within the FSSP-SPP-300 cylinder. In this new configuration the FSSP-SPP-300 has a resolution of up to 40 size bins. The bin limits can be switched to different refrac-tive indices by software control. The instrument’s sampling rate is 0.5 Hz but for the low number concentrations of parti-cles >1 µm in the stratosphere during volcanically quiescent times typically 30 min of data are integrated to derive particle size distributions with good counting statistics.
N2O and CFC-11 are measured by the high accuracy gas
chromatograph HAGAR (High Altitude Gas Analyser, Volk
et al., 20051). Ozone is measured using the Fast Ozone
UV absorption Experiment (FOX). The Fast In situ Strato-spheric Hygrometer (FISH) for the measurement of total water is based on the Lyman-α photofragment fluorescence technique. Details of the instrument and the calibration pro-cedure are described by Z¨oger et al. (1999).
3 Measurements and discussion
3.1 Total particle concentration
Vertical profiles of the total particle concentration nt for 14
flights of the EUPLEX and EAV-campaigns are shown in Fig. 2. Ambient particle concentrations are typically 10–
20 cm−3 at 18–20 km altitude. The concentration ranges
are in good agreement with measurements by other authors for the Arctic winter stratosphere (e.g. Hofmann, 1990). Open circles indicate median average particle concentrations binned by 500 m altitude intervals. Error bars designate the 25- and 75-percentiles of the averaged data in each altitude bin. Below 18 km number concentrations are increasing with decreasing altitude. For instance, on 23 January and 6 Febru-ary this increase is relatively smooth and particle concentra-tions below 100 cm−3 are measured throughout the
lower-most stratosphere (LS). In contrast, ntincreases markedly to
concentrations of several hundred particles per cm3 below ∼14 km during several other flights (e.g. 8 and 28 February). The origin of these structures will be discussed in detail in Sect. 3.4.
1Volk, C. M., Werner, A., Wetter, T., Ivanova, E., Wollny, A.,
Ulanovsky, A., Ravegnani, F., Schlager, H., Konopka, P., and Toon, G.: Ozone loss within the 2003 Arctic vortex derived from in situ observations with the Geophysica aircraft, Atmos. Chem. Phys. Discuss., in preparation, 2005.
particles (cm-3) 10 100 1000 10000 alt itude (m) 6000 8000 10000 12000 14000 16000 18000 20000 22000 15.01.2003 F1-EP 23.01.2003 F3-EP 30.01.2003 F5-EP 02.02.2003 F6-EP 06.02.2003 F7-EP 08.02.2003 F8-EP 09.02.2003 F9-EP 11.02.2003 F10-EP 28.02.2003 F1-EV 02.03.2003 F2-EV 08.03.2003 F3-EV 12.03.2003 F4-EV Figure 2
Fig. 2. Vertical profiles of total particle concentrations nt for all
flights within the EUPLEX and EAV measurement campaigns. Data points are 15-s averages. Median values over all data binned in 500 m altitude intervals are included. Error bars denote the 25- and 75-percentiles. Several flights revealed a sharp increase in particle concentration at altitudes below ∼14 km (e.g. flight of 8 February 2003), whereas other flights did not show such pronounced struc-tures (e.g. flight of 23 January 2003).
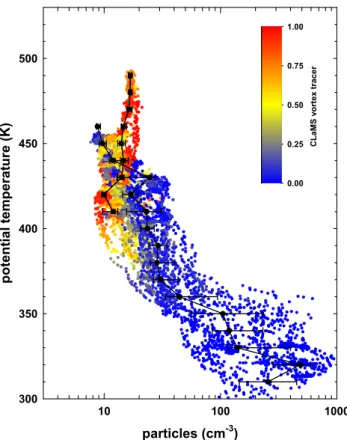
Figure 3 displays nt as a function of potential temperature
(2). In general, the particle data follows a fairly compact correlation, decreasing with increasing 2 until a broad mini-mum around 400–460 K is reached. For higher 2 the particle concentration increases, reaching 15–20 cm−3for the highest 2values above 460 K.
In order to distinguish air masses measured inside and out-side the polar vortex we use the artificial vortex tracer calcu-lated by the three-dimensional Chemical Lagrangian Model of the Stratosphere (CLaMS). CLaMS is a model to study transport and mixing processes of tracers in the stratosphere (McKenna et al., 2002; Konopka et al., 2004). The CLaMS model allows, for example, to quantify the vortex dilution over the course of the winter and to trace the mixing across the vortex edge into the vortex to particular dynamical prop-erties of the stratospheric flow (Steinhorst et al., 2005). In the CLaMS model the vortex edge is commonly defined by the strongest gradient in potential vorticity (PV) (Nash et al., 1996). In CLaMS, the dilution of the vortex is calculated by introduction of an artificial tracer that at the beginning of
particles (cm-3) 10 100 1000 potent ial t e mper at ure ( K ) 300 350 400 450 500 C L aM S v o rtex trac er 0.00 0.25 0.50 0.75 1.00 Figure 3
Fig. 3. Particle concentration nt as a function of potential
tem-perature. Inside vortex (CLaMS Vortex tracer >0.75, squares) and outside vortex (CLaMS vortex tracer <0.25, circles) median values over the data binned in intervals of 10 K with 25- and 75-percentiles (error bars) are included. Values of the CLaMS vortex tracer are color coded.
the model run (1 December) labels the air parcels inside and outside the vortex by 100 and 0%, respectively. This tracer describes the percentage of the pure vortex air defined in this way in each air parcel throughout the winter. The CLaMS artificial vortex tracer has been calculated for the air parcels encountered in the Geophysica measurement flights. It al-lows a convenient distinction of air mass encounters inside and outside the vortex and mixing processes across the vortex edge can be studied. In Fig. 3 the value of the vortex tracer is indicated by color coding. Median values of nt have been
calculated for data observed inside the vortex (CLaMS vor-tex tracer >0.75) and extra-vorvor-tex data (ClaMS vorvor-tex tracer <0.25). Distinct differences are observed: Outside the vor-tex, ntdecreases continiously with increasing 2, while a
pos-itive correlation is observed inside the vortex. For identical 2values the median number concentrations differ consider-ably indicating the transport barrier for isentropic flow across the vortex edge.
Comparing the total particle number mixing ratio with the simultaneously measured trace gases nitrous oxide (N2O)
and trichlorofluoromethane (CFC-11) allows some further
Figure 4 number of particles (mg-1) 0 100 200 300 400 500 N2 O ( p pbv ) 100 200 300 CLaMS v o rt ex tr ace r 0.00 0.25 0.50 0.75 1.00 (a) number of particles (mg-1) 0 100 200 300 400 500 CFC-11 (pptv) 1 10 100 C L aM S Vort ex Tracer 0.00 0.25 0.50 0.75 1.00 (b)
number of heated particles (mg-1)
0 50 100 150 200 250 N2 O (pp b v) 100 200 300 CL aM S v o rt ex t ra c er 0.00 0.25 0.50 0.75 1.00 (c)
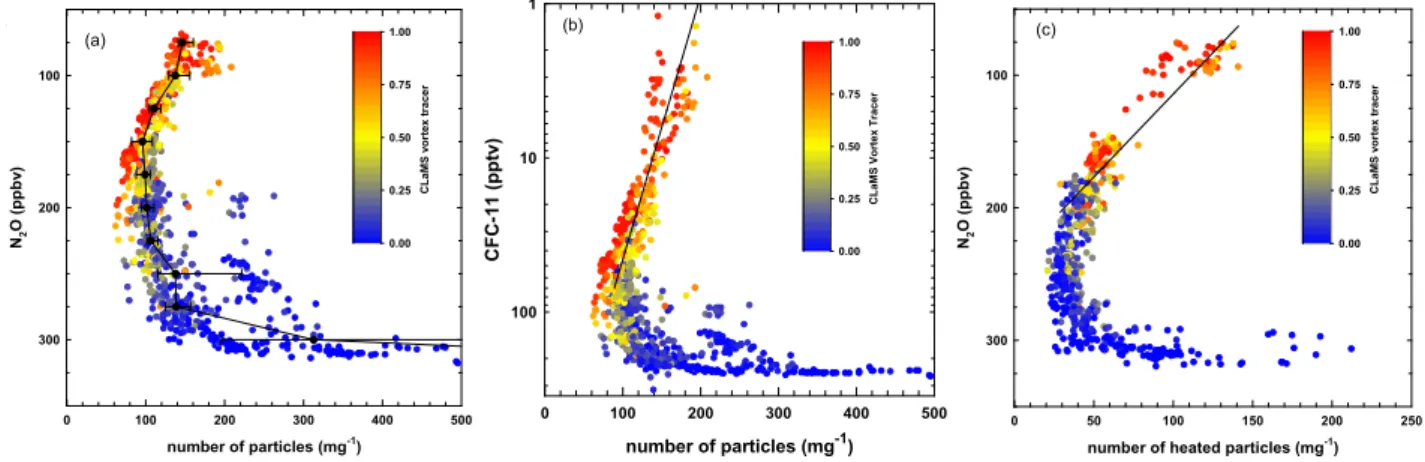
Fig. 4. Correlation of N2O mixing ratios and total particle mixing ratio given as number of particles per mg of air. Values of the vortex
tracer are color coded. Median values binned by 20 ppbv of N2O as well as 25- and 75-percentiles are included (a). Correlation of CFC-11
mixing ratios and particle mixing ratios including a regression line for CFC-11 <70 pptv (a). Correlation of N2O with non-volatile particle
mixing ratios including a regression line for N2O<200 ppbv (c).Data from flights as indicated in Fig. 1, except for flights, 30 January and 9 February, when HAGAR instrument was not operational; for (c) also data from entire flight of 12 March, and some parts of flights on 8, and 11 February and 8 March when the heated aerosol channel was not operational are missing.
measurements N2O and CFC-11 were measured on a 90 s
time basis and corresponding particle concentrations were selected. Figure 4 displays the particle measurements in units of particle number per mg air to be able to compare directly two mixing ratio type quantities and to make our measure-ments comparable to previous measuremeasure-ments by other au-thors (Wilson et al., 1989, 1992). The N2O-particle relation
given in Fig. 4a is similar to the 2-particle relationship. The particle concentration nt decreases sharply with decreasing
N2O in the lowermost stratosphere (300–240 ppbv N2O). A
broad minimum exists with particle concentrations around 100 mg−1for N2O of 150–220 ppbv. For N2O <150 ppbv an
anti-correlation exists with the particle mixing ratio reaching average values of 160 mg−1at 80 ppbv N2O.
N2O and CFC-11 are both trace gases that have sources
at ground and are inert in the troposphere. Sink processes in the stratosphere are photodissociation and reaction with O(1D) for N2O and photolysis for CFC-11. Therefore both
tracers generally decrease in the stratosphere with increasing potential temperature. The primary source of particles in the stratosphere is thought to be nucleation of H2SO4/H2O
par-ticles in the tropical tropopause layer (TTL). In general, no nucleation of particles occurs in the stratosphere during vol-canically quiescent periods (e.g. Brock et al., 1995; Hamill et al., 1997) except for the nucleation processes in the po-lar vortex to be discussed here and potentially nucleation in the lowermost stratosphere. Therefore the total particle
number mixing ratio decreases to values below 100 mg−1
in the stratosphere above 2=460 K due to coagulation pro-cesses (e.g. Brock et al., 1995). Particles are also considered to evaporate at the higher temperatures in the upper strato-sphere (e.g. Hamill 1997). Therefore an anti-correlation of
decreasing N2O and increasing particle mixing ratio while
2(Fig. 3) is increasing is indicative of a particle source in the above polar vortex stratosphere or the mesosphere. It can be excluded that particles originally produced in the TTL are the cause of such an anti-correlation as coagulation brings the particle number mixing ratios already down to values around or below 100 mg−1in the tropical stratosphere for 2>460 K
(Brock et al., 1995).
Our data supports the findings by Hofmann (1988, 1990) who observed layers of enhanced particles in the Arctic as well as the Antarctic polar vortex at altitudes of ∼22–26 km, which were attributed to new particle formation, probably
by sulfuric acid and water. The conditions for
homoge-neous nucleation of new particles are favorable in the polar vortex because temperatures are very low, the pre-existing aerosol surface area is small (see Sect. 3.3), and gaseous H2SO4 which has evaporated from particles at higher
tem-peratures in the upper stratosphere is expected to be supersat-urated when subsiding inside the polar vortex (Schlager and Arnold, 1987). Here, for a quantitative assessment, also the stratospheric cycling of gaseous H2SO4and SO2would have
to be considered as gaseous H2SO4 actually absorbs
near-infrared radiation in the upper stratosphere or mesosphere through OH stretching vibrational overtone transitions that lead to photolysis of H2SO4forming SO3which is rapidly
photolyzed yielding SO2(Vaida et al., 2003). The SO2(not
supersaturated) then may be transported downward by subsi-dence inside the Arctic vortex and is eventually transformed back into gaseous H2SO4by OH reaction at the end of the
polar night, yielding the required super-saturations for nu-cleation to occur (Zhao et al., 1995).
Besides homogeneous nucleation other processes have to be considered: conditions for ion-induced nucleation are fa-vorable as the atmospheric ion density produced from galac-tic cosmic rays is highest at altitudes of 15–25 km (Rosen et al., 1985; Lovejoy et al., 2004). It is furthermore conceiv-able that the gaseous H2SO4condenses on nanometer-sized
meteoric smoke particles that are brought into the polar vor-tex from the mesosphere (Hunten et al., 1980; Zhao et al., 1995, see following section). Because the number of par-ticles produced by homogeneous nucleation is a very non-linear function of temperature and supersaturation, it would be surprising to measure such a compact correlation of N2O
and nt throughout the Arctic winter stratosphere at different
times and locations. Therefore a heterogeneous process like ion-induced nucleation or condensation of sulfuric acid and water on meteoric smoke seems more likely to produce such a compact correlation because in these processes the number of nuclei (core ions or ultrafine meteoric smoke particles) is limiting for the number of particles produced and the number of these particles is therefore expected to vary less through-out the polar vortex. As will be discussed in the following section, a heterogeneous condensation on the abundant me-teoric smoke particles may be the most likely process.
Our findings for the N2O-particle correlation are
compa-rable to the correlation for the winter Arctic stratosphere as described by Wilson et al. (1990). These authors also observed an increase of particles with decreasing N2O for
N2O<150 ppbv and the general shape of the correlation for
the entire range of N2O mixing ratios is similar. A difference
to the Wilson et al. measurements is that our measurements seem to be shifted to somewhat higher particle mixing ratios: Wilson et al. observe a particle mixing ratio of 50–70 mg−1
for 150–220 ppbv N2O whereas we observe a minimum of
80–100 mg−1for 150–220 ppbv of N2O. The reason for these
differences might be the different levels in the stratospheric background concentration of particles in years not influenced by volcanic disturbances (Deshler et al., 2003). Additionally, Wilson et al. (1990) observed a shift in the correlation with time: In February average CN mixing ratios were measured to be ∼30% higher than in January for corresponding N2O.
Such a shift in the N2O-particle correlation was not observed
in our measurements.
The particle mixing ratio as a function of the tracer CFC-11 is shown in Fig. 4b. The appearance is similar to the N2O-particle correlation depicted in Fig. 4a. This can be
expected as CFC-11 and N2O are closely correlated
strato-spheric tracers (Plumb and Ko, 1992). Again it is observed that inside the polar vortex the particle mixing ratio increases with decreasing CFC-11 for CFC-11 smaller than ∼70 pptv. A regression of the form [nt]=−a ln[11]+b for
CFC-11<70 pptv has been fitted to the data as displayed in Fig. 4b (a=25.4, b=196.8). This increase of particles with decreasing CFC-11 gives further evidence for a source of particles in the above polar vortex. In how far this correlation is typical for the Arctic winter stratosphere in general during volcanically
undisturbed times might be an interesting issue of further in-vestigations.
The mixing ratio of non-volatile particles as a function of N2O is shown in Fig. 4c for comparison. Similar to the total
particles, the non-volatile particles increase markedly inside the vortex with decreasing N2O for N2O <200 ppbv. A
de-tailed discussion of this correlation will be given in the fol-lowing section.
Some of the particle data shown in Fig. 4 deviate markedly from the otherwise compact correlation: A subset of
parti-cle measurements at ∼200 and ∼250 ppbv N2O range above
200 mg−1. These data points have all been measured
dur-ing the flight of 2 March 2003. Similarly these elevated data show up in Fig. 3 as elevated particle concentrations around 410 and 425 K, somewhat offset to the remaining data. Al-though the housekeeping data gave no indication of any in-strumental problems, a malfunction such as a leak might be responsible for these data points, outside of the correlation measured in all other flights before and after.
3.2 Non-volatile particles
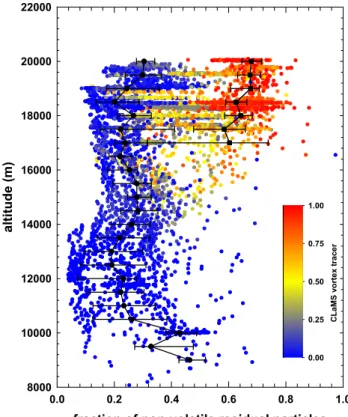
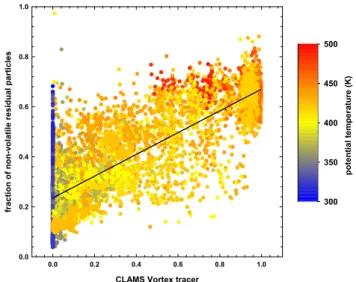
The fraction f of non-volatile residual particles is the ratio of non-volatile particles nnv to all particles nt. Measurements
of f for all flights of the EUPLEX and EAV campaigns in which the aerosol heater of COPAS was operational are dis-played in Fig. 5. The fraction of non-volatile particles covers a wide range of values between 4 and 80 percent indicat-ing differences in the chemical composition of these parti-cles. Corresponding CLaMS vortex tracer values are indi-cated by color coding. The fraction f of non-volatile parti-cles is strongly dependent on whether the data was obtained inside or outside of the polar vortex. Median values of f in-side and outin-side the vortex (vortex tracer >0.75 and <0.25) have been calculated for 500 m interval bins. Medians range at 20–30% outside and 60–70% inside the vortex.
We assume the explanation for this marked increase in f is that the fraction of particles containing meteoric material is increased inside the polar vortex. The meteoric material is composed to a large degree of refractory components such as oxides of iron, magnesium and silicon. Numerical mod-els show that a large fraction of mesospheric air descends into the polar vortex and an increase of meteoric debris in the Arctic vortex can therefore be expected (Prather and Ro-driguez, 1988; Fisher et al., 1993; Plumb et al., 2003). As argued in the instrumental section, already a weight fraction of 0.5% of non-volatile material is sufficient for the particles to be classified as non-volatile by our CN-Counter. Neverthe-less, the marked differences for data obtained inside and out-side the polar vortex at identical altitude indicate a substan-tial difference in background aerosol composition. This dif-ference might influence the formation of polar stratospheric clouds (Voigt et al., 2005), aerosol alkalinity (Prather and Rodriguez, 1988) or play a role in polar stratospheric aerosol nucleation. It is also interesting to note that a major fraction
fraction of non-volatile residual particles 0.0 0.2 0.4 0.6 0.8 1.0 al tit ude ( m ) 8000 10000 12000 14000 16000 18000 20000 22000 C L aM S v o rt ex t rac er 0.00 0.25 0.50 0.75 1.00 Figure 5
Fig. 5. Fraction f of volatile residual particles (ratio of
non-volatile residual particles nnvto total particle concentration nt)as
altitude profile with vortex tracer indicated by color coding (a). Data from flights as indicated in Fig. 1, except for entire flight of 12 March, and some parts of flights on 8, 9, and 11 February and 8 March when CN-Counter with heated aerosol channel was not operational.
of the meteoric smoke particles therefore bypasses most of the extra-vortex stratosphere when being transported from the mesosphere to the ground. When the vortex breaks up a significant fraction of the mesospheric air parcels is re-leased in the lower stratosphere at high latitudes and will then be mixed eventually into the troposphere by stratosphere-troposphere transport processes. Calculations determining the total influx of extraterrestrial material based on measure-ments in the mid-latitude stratosphere are therefore possibly underestimates (Cziczo et al., 2001).
Gabrielli et al. (2004) study iridium and platinum concen-trations in Greenland ice cores. A major fraction of the Ir and Pt is found to have an extraterrestrial origin. Due to the focusing effect of the meridional circulation in the meso-sphere and the downward transport of meteoric smoke par-ticles in the polar vortex an enhancement of cosmic mate-rial deposited at the Earth surface poleward of 55◦latitude is postulated, in comparison to the global average assuming a uniform influx. Our conclusion of the enhanced non-volatile material in the vortex being meteoric smoke particles there-fore supports these findings, and vice versa our findings are supported by the Gabrielli et al. (2004) study.
It is conceivable that the higher concentrations of mete-oric material influence the particle nucleation described in Sect. 3.1. Meteoric smoke particles of a few nanometers size form from the re-condensation of the ablated silicon oxides and metallic vapor compounds in the mesosphere. Ablation and smoke particle formation from the low-volatility vapors occurs mostly at altitudes of 80–100 km. The average initial size of the smoke particles at these altitudes is very uncertain. Hunten et al. (1980) estimate a range of 0.4–20 nm diameter and choose a value of 2.6 nm as the nominal case for their model simulations. Once formed, the particles grow by co-agulation and by condensation of further ablated vapors in the mesosphere. Recent calculations with a one-dimensional model describe the development of the meteoric smoke parti-cles in the mesosphere including processes of formation, co-agulation, condensation and gravitational settling (Gabrielli et al., 2004). At 60 km altitude particle concentrations of
∼700 cm−3for particles of 0.4 nm size to ∼20 cm−3for
par-ticles >4 nm are modelled. In the stratosphere these smoke particles may serve as heterogeneous nuclei for the conden-sation of gaseous H2SO4or they might coagulate with
ex-isting H2SO4/H2O particles. If the meteoric smoke particles
grow to sizes larger than our cut-off diameter of 10 nm before coagulation with the stratospheric background H2SO4/H2O
particles these additional particles are potentially responsi-ble for the observed increase in total particle concentration (Sect. 3.1), making the nucleation process rather a heteroge-neous than a homogeheteroge-neous one. Zhao et al. (1995) discuss the possible influence of meteoric smoke particles on the po-lar stratospheric nucleation and their model results indicate that depending on the (uncertain) number concentration of the smoke particles and their ability to act as condensation nuclei for sulfuric acid and water the heterogeneous process can potentially explain the observed nucleation. A remaining question is whether the meteoric smoke particles coagulate fast enough with each other during their downward trans-port in the Arctic vortex to reach sizes larger than ∼10 nm to be detectable by our CN-counter. A detailed modelling of the coagulation of the meteoric smoke particles with each other, simultaneous coagulation with stratospheric sulfuric acid-water aerosol and condensation of gaseous sulfuric acid and water vapor is beyond the scope of this study, but the time scales of several month are reasonable for at least a fraction of the meteoric smoke particles to reach sizes of the non-volatile cores of >10 nm.
Very recently, Engel et al. (2005) published balloon-borne tracer observations (SF6, CO, CO2, etc.) and model
calcula-tions describing the transport of mesospheric air in the Arctic vortex in the winter 2002/2003. They find comprehensive ev-idence for the presence of mesospheric air in the polar vortex. Interestingly, the largest fraction of mesospheric air is found in a layered structure descending from ∼30 km altitude in January to ∼22 km altitude in March. This observation of a distinct layer of mesospheric air might also explain the CN layers observed by Hofmann (1988, 1990) in the polar vortex
to be in fact layers of meteoric smoke particles, rather than freshly nucleated sulfuric acid water particles. Furthermore, the results by Engel et al. (2005) support our hypothesis that meteoric smoke particles of mesospheric origin cause the ob-served enhancement of the non-volatile particle fraction in the Arctic vortex. Due to additional gravitational settling, the meteoric smoke particles, at least the largest ones, are potentially transported downward in the vortex even faster, reaching lower altitudes earlier than the corresponding meso-spheric gaseous compounds.
In principle, the slope of the N2O-non-volatile particle
cor-relation for N2O<200 ppbv (cf. Fig. 4c) could be used to
obtain a global source strength of the extraterrestrial influx through meteoric smoke particles (Murphy and Fahey, 1994). We did not apply this concept here as we do not know in how far the observed correlation from inside the polar vortex is representative for the stratosphere in general (e.g. merid-ionally inhomogeneous influx from the mesosphere could change the correlation at lower latitudes) and because we do not know about the average size and density of the meteoric smoke particles from our measurements which would be nec-essary to determine the extraterrestrial mass influx.
In Fig. 6 the value of f is shown in relation to the CLaMS artificial vortex tracer. It can be seen that a linear correla-tion with the measured fraccorrela-tion of non-volatile residual parti-cles exists. Outside the polar vortex, where the vortex tracer is 0%, the value of f is 24% on average, increasing to an average of 67% for pure vortex air (vortex tracer =100%). Here the measurements are color coded according to poten-tial temperature. Within limits, f can be viewed as a di-rectly measurable vortex tracer, but because the correlation with the calculated vortex tracer has a substantial scatter, f does not allow a vortex identification as precise as identi-fication from traditional correlations of long-lived gaseous tracers. We found the ratio f to be better suitable as a vor-tex tracer than the concentration or mixing ratio of the non-volatile particles alone. For the total particle concentration as well as for the non-volatile concentration a distinct de-pendence on the vertical coordinate (altitude, potential tem-perature, N20, etc.) exists. For example, measured values of
the mixing ratio of non-volatile particles outside the vortex at low potential temperatures can be identical to mixing ratios inside the vortex at higher potential temperatures (cf. Fig. 4c) and therefore a vortex tracer is more difficult to discern. For the ratio f the dependence on the vertical coordinate appar-ently cancels out and the simple correlation is found. Some of the scatter might be caused by variable numbers of volatile particles (e.g. enhancement due to mixing with air containing newly formed volatile particles from the tropical tropopause region), or to the fact that non-volatile particles are not nec-essarily all of meteoric origin (e.g. particles such as soot can influence the measurement of the non-volatile particles).
We are confident that the differences in our measurements of f are not due to any instrumental artifact because we tested carefully the efficiency of the aerosol heater to
com-CLAMS Vortex tracer
0.0 0.2 0.4 0.6 0.8 1.0 fr act ion of n on-vo latile residu al p a rt ic les 0.0 0.2 0.4 0.6 0.8 1.0 potent ial t emperature (K) 300 350 400 450 500 Figure 6
Fig. 6. Fraction f of non-volatile residual particles versus the value
of the CLAMS model vortex tracer. Potential temperature values indicated by color coding. A linear regression is included.
pletely evaporate pure sulfuric acid particles in the labora-tory. Furthermore, the aerosol size distribution inside the polar vortex is shifted towards smaller particles (see follow-ing section) and smaller particles evaporate faster than larger ones of identical composition which makes an instrumental effect unlikely that results in an increase of f inside the vor-tex. Thus we conclude that the fraction of meteoric mate-rial in stratospheric particles at similar altitudes is distinctly higher inside the Arctic vortex compared to outside. 3.3 Particles >0.4 µm
The concentration of particles >0.4 µm (n0.4)as a function
of altitude is displayed in Fig. 7.
Data from all flights in which the FSSP-300 was operated are shown as 15-s averages. At altitudes between 11 and 16 km n0.4is typically 0.2–1.0 cm−3. At higher altitudes and
inside the Arctic vortex the concentration varies over a much broader range with lowest concentrations near 0.001 cm−3 and maximum concentrations of 0.5 cm−3.
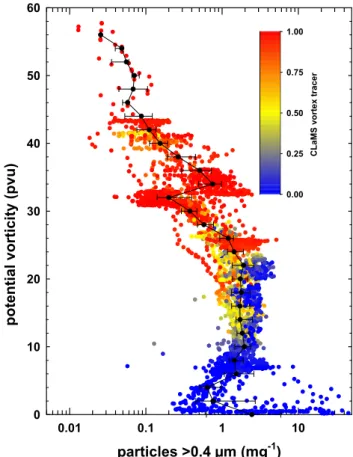
Potential vorticities for the position of the Geophysica dur-ing the measurement flights have been interpolated from op-erational ECMWF analysis data at full resolution. The rela-tion between PV and the mixing ratio of particles >0.4 µm is shown in Fig. 8. The data are displayed as particles per mg of air, as mixing ratio type quantities are more conserved quan-tities with potential vorticity than concentrations. Outside the polar vortex the mixing ratio of particles >0.4 µm increases from ∼0.5 to 1.5 mg−1for PV increasing from 2 to 10 pvu. It stays relatively constant at ∼1.8 mg−1for PV ranging from 12 to 22 pvu. Inside the vortex for PV≥24 pvu, the parti-cle mixing ratio decreases considerably with increasing PV to values below 0.1 mg−1at PV>45 pvu. Subsidence inside
particles > 0.4 µm (cm-3) 0.0001 0.001 0.01 0.1 1 10 al titu de ( m ) 8000 10000 12000 14000 16000 18000 20000 C L aM S v o rt ex tr acer 0.00 0.25 0.50 0.75 1.00 Figure 7
Fig. 7. Number concentration of particles with diameters >0.4 µm
(15-s averages) measured with the FSSP-300 as a function of al-titude. Vortex tracer values indicated by color coding. Data from flights on 23 and 30 January, and 2, 6, and 8 February when the FSSP-300 was operated are shown.
the vortex is likely to explain the observed decrease. Within the Arctic vortex air masses are sampled which have been transported downward from above the Junge layer contain-ing therefore very low mixcontain-ing ratios of particles >0.4 µm.
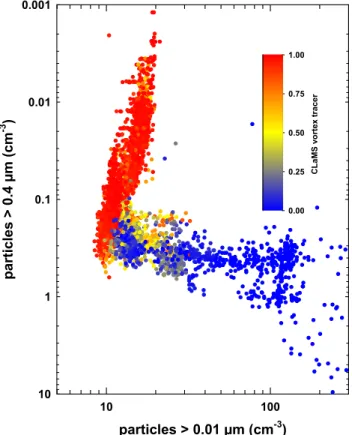
Figure 9 displays a scatter plot of nt versus n0.4.
Measure-ments obtained inside the polar vortex yield a very compact negative correlation with n0.4decreasing strongly as ntis
in-creasing. Outside the vortex nt and n0.4 are positively
cor-related but the correlation is more scattered than inside the vortex.
Typical aerosol size distributions for measurements at
19 km altitude are compared in Fig. 10. Both size
dis-tributions peak near the smallest channel (d=0.4 µm), but these peaks are likely to be caused by an instrumental un-der estimation of the particles in the lowest channel. The peaks therefore probably do not represent a maximum of the aerosol size distribution. For all channels the absolute concentrations measured inside the polar vortex are much smaller than those outside. Nevertheless, from the higher to-tal particle concentrations nt measured inside the polar
vor-tex compared to outside (cf. Fig. 3) we conclude that for some aerosol sizes <0.4 µm the absolute concentrations in-side the vortex have to be higher than the concentrations
particles >0.4 µm (mg-1) 0.01 0.1 1 10 potenti al vortici ty (pvu) 0 10 20 30 40 50 60 C L aM S v o rt ex t ra cer 0.00 0.25 0.50 0.75 1.00
Fig. 8. Mixing ratio of particles >0.4 µm per mg air as a function
of potential vorticity with vortex tracer indicated by color coding. Median values binned by 2 pvu intervals with 25/75-percentiles in-cluded.
outside the vortex; i.e., continuing the size distributions to smaller particle diameters the black curve would have to rise above the red curve at some point in Fig. 10.
The measured size distributions and the concentrations n0.4 compare well with previous measurements in the
win-ter polar stratosphere by Borrmann et al. (2000a). These authors measured similar size distributions for situations in-side and outin-side the Arctic polar vortex and also a distinct decrease of n0.4 with increasing altitude was observed for
altitudes >19 km for a measurement flight (29 December 1996) conducted inside the polar vortex (n0.4≈0.1 cm−3 at
19.5 km, and n0.4≈0.02 cm−3 at 20.5 km). Similarly,
Hof-mann et al. (1989) reported a strong decrease of the number concentration of particles >0.3 µm in the Antarctic strato-sphere at altitudes >18 km. They identified this flank as the upper edge of the Junge layer which is shifted downward by several km in the Antarctic compared to mid-latitudes. Furthermore, satellite observations of the aerosol extinction by the optically active particles confirm these findings. The aerosol extinction profiles in the Arctic and Antarctic polar vortex are shifted downward by several km (McCormick et al., 1983; Kent et al., 1985; Thomason et al., 1997).
particles > 0.01 µm (cm-3) 10 100 p articles > 0.4 µm (cm -3 ) 0.001 0.01 0.1 1 10 C L aM S v o rt ex t racer 0.00 0.25 0.50 0.75 1.00 Figure 9
Fig. 9. Number concentration of particles >0.4 µm (FSSP-300)
versus total particle concentration >0.01µm (COPAS). Vortex tracer values are color coded.
3.4 Particles in the lowermost stratosphere
In this section we will focus on the particle measurements in the lowermost stratosphere. Especially the sources of the high variability of the particle measurements at altitudes be-low 14 km will be discussed (cf. Fig. 2). We chose to study two exemplary flights (23 January, 8 February) including de-tailed trajectory analyses to investigate the origin of the air masses in order to explain the high variability of our observa-tions. The lowermost stratosphere is defined as the transition region between the local tropopause and the 380 K potential temperature level (Holton et al., 1995).
Figure 11a shows the vertical profile of the particle mea-surements along with other meamea-surements for the flight of 23 January 2003. The tracers ozone (O3), N2O, CFC-11 and
water vapor (H2O) are shown, along with temperature and
potential vorticity profiles. Ascent and descent of this flight were conducted in or below the polar vortex. In this case the tropopause was located at ∼290 K. Total particle concentra-tions nt range at 50–100 cm−3for potential temperatures of
310–350 K and decrease below 50 cm−3above 350 K.
Sim-ilarly, H2O decreases continuously up to 350 K and remains
relatively constant at 3.5–4.5 ppmv above 350 K. N2O and
CFC-11 decrease both to <90% of their tropospheric values
dp (µm) 0.1 1 10 d N/ d l o g d p (c m -3) 0.0001 0.001 0.01 0.1 1 Jan. 23, 2003, 19 km Feb. 8, 2003, 19 km outside vortex inside vortex Figure 10
Fig. 10. Particle number size distributions measured at 19 km
alti-tude for the flights of 23 January (inside polar vortex) and 8 Febru-ary 2003, (outside polar vortex). Measurements are integrated over approximately one hour to increase statistical accuracy. Statistical uncertainties are indicated by error bars.
at >350 K. For the flight of 8 February 2003, the correspond-ing quantities are shown in Fig. 11b. This flight showed much higher particle concentrations below 370 K. Here as-cent and desas-cent were conducted outside the polar vortex. From the particle measurements during the descent of the flight of 8 February it can be seen that the distinct step struc-ture is observed by all three unheated channels of the two COPAS counters. An almost identical step structure is also
observed during ascent. Ozone, N2O, CFC-11, H2O and
temperature also show profiles that are very similar for ascent and descent despite a time span of 3.5 h between the ascent from and the descent to Kiruna. In contrast to the unheated channels the heated channel of COPAS does not show a dis-tinct step structure and the fraction of non-volatile particles drops from 20–40% above the step to 5–15% below 350 K. Therefore we conclude that most of the particles below 350 K are likely to be pure sulfuric acid/water particles.
Recently, several publications discussed the existence of a so-called “mixing layer” or “tropopause following transi-tion layer” extending typically 2–3 km (or ∼25 K in potential temperature) above the local tropopause (e.g. Fischer et al., 2000; Hoor et al., 2002). Due to the influence of extratropical cross-tropopause transport of tropospheric air on the tracer abundances, the tracer-tracer relationships in the tropopause following transition layer deviate significantly from those typically observed in the remaining lowermost stratosphere. From Fig. 11b it can be seen that such a tropopause follow-ing transition layer may be defined from the vertical pro-files of ozone and water vapor. Above the local tropopause at 313 K, defined by the change in temperature lapse rate, ozone and water mixing ratios change continuously from tropospheric to stratospheric mixing ratios within a mixing layer between 313 and 348 K. But these tracers do not reveal
Particles particles (cm-3) 10 100 p ote nti a l te mp era ture (K ) 250 300 350 400 450 500 O3 Temperature Temperature (C) -100 -50 0 O3 (ppbv) 10 100 1000 N2O N2O (ppbv) 0 100 200 300 0 100 200 300 H2O H2O (ppmv) 1 10 CFC-11 (pptv) 0 10 20 30 40 50 60 Jan. 23, 2003 PV total particles > 0.01 µm non-volatile particles > 0.01 µm
pot. vort. (pvu)
CFC-11 H2O (ppmv) 1 10 particles particles (cm-3) 1 10 100 1000 po te ntial temp eratu re (K) 250 300 350 400 450
COPAS 2, Ch. 1, unht., desc. COPAS 2, Ch. 2, unheated COPAS 1, Ch. 1, heated COPAS 1, Ch. 2, unheated COPAS 2, Ch. 1, unht., asc.
O3 Temperature O3 (ppbv) 10 100 1000 Temperature (C) -100 -50 0 N2O N2O (ppbv) 0 100 200 300 0 100 200 300 Feb. 08, 2003 H2O pot. vort. (pvu) 0 10 20 30 40 50 60
PV CFC-11
CFC-11 (pptv)
Figure 11
Fig. 11. Measurements for flight of 23 January 2003. Potential temperature profiles for total particle concentration nt, non-volatile particle
concentration nnv, ozone and temperature, N2O and CFC-11, potential vorticity and H2O are shown (a). Same for 8 February 2003, both
distinct changes at 360–370 K where the steep change in par-ticle concentration occurs. The N2O and CFC-11 profiles on
the other hand decrease slowly with increasing altitude and mixing ratios >90% of the tropospheric N2O and CFC-11
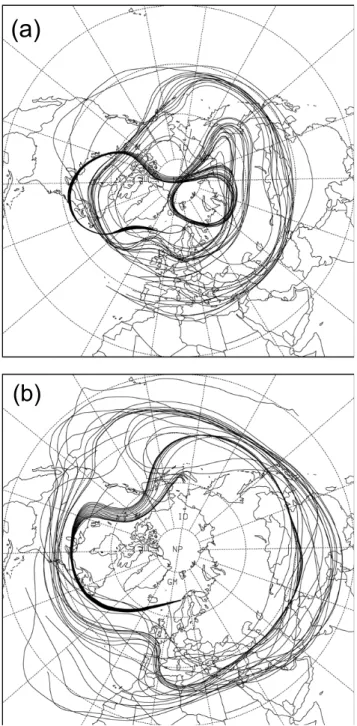
values are measured even above 400 K potential temperature. We investigated in how far the high particle concentration in the region between 330 and 370 K for 8 February could be caused by quasi-horizontal transport of upper tropospheric, aerosol-rich air from mid, subtropical or even tropical lati-tudes. Tropospheric air entering the stratosphere isentropi-cally at lower latitudes could have been transported to higher latitudes before sampling. For the two flights of 23 Jan-uary and 8 FebrJan-uary, 30-day backward trajectories of ensem-bles of air parcels ending near the Geophysica’s flight track were calculated separately for 10-K potential temperature segments between 330 and 400 K. These calculations were performed with the trajectory tool LAGRANTO (Wernli and Davies, 1997) using wind and temperature fields from the operational ECMWF analyses with a horizontal resolution of 1 degree. These trajectories are shown in Fig. 12 for the 355–365 K segments of the two flights. The trajectories of 23 January show that the air parcels are continuously lo-cated north of 40◦N and are of strictly stratospheric origin. For 8 February, trajectories point to a more southerly origin of the air masses around 20◦N and the trajectories do not come close to the North Pole. They indicate in this case a recent tropospheric influence on the air masses sampled dur-ing ascent and descent which is illustrated more closely in Fig. 13. This figure shows the position of air parcels (circles) on 10 January which will end at Geophysica’s position be-tween 325 and 335 K (Fig. 13a) and bebe-tween 355 and 365 K (Fig. 13b) on 8 February. The average potential temperature of the displayed air parcels on 10 January is 342 K in case (a) and 393 K for case (b), respectively. For these potential temperatures the PV maps are plotted with the tropopause de-fined by 2 pvu indicated by a thick black line. It can be seen in (a) that at this time and for this flight level many of the air parcels are located in the troposphere or in the tropopause region making a tropospheric influence obvious. In case (b), indeed, for a few air parcels a tropospheric influence is also evident. For instance over Arabia, some air parcels that are later transported to the Geophysica’s flight path are located in a cut-off of tropospheric air. It is also conceivable that some of the air masses initially originated from the tropical tropopause layer. Equivalent graphs for 2>365 K look very similar to Fig. 13b. The findings from the trajectory stud-ies are further supported by the profiles of the tracers N2O
and CFC-11 which attain high mixing ratios within 90% of their tropospheric values throughout the whole LS (Fig. 11b). Their mixing ratios are decreasing with increasing 2 much slower than for the flight of 23 January (cf. Fig. 11a), illus-trating again that the air masses encountered during ascent and descent of 8 February have experienced a significant re-cent tropospheric influence. The fact that H2O decreases to
values below 5 ppmv at >350 K may be explained by
signif-(a)
(b)
Figure 12 Fig. 12. Ensemble of 20-day backward trajectories for Geophys-ica’s position at 360 K for 23 January 2003 (a). Same for 8 February 2003 (b).
icant reduction of H2O by freeze-drying processes when the
air masses entered the stratosphere.
In conclusion, the trajectories show that for the flight of 23 January, when particle concentrations are low through-out the LS, the air masses are of stratospheric origin only. On the other hand, a tropospheric influence of potentially aerosol-rich air can clearly be discerned for the air masses measured in the LS during ascent and descent on 8 February.
(a)
(b)
Figure 13
Fig. 13. Circles show positions of air parcels on 10 January 2003,
that end near Geophysica’s position at 330 K on 8 February 2003. Colors indicate PV on the isentropic surface for the air parcels av-erage potential temperature 2 of 342 K. Thick black line at 2 PVU indicates the tropopause, thick green lines indicate horizontal wind speed isolines of 60 and 80 m s−1(a). Same for air parcels ending
at 360 K on 8 February 2003. PV map is shown at 392 K which corresponds to the average 2 of the air parcels (b).
Nevertheless it is difficult to explain the origin of the step in particle concentration around 365 K by the tropospheric influence alone because there is no distinct difference in the history of the air masses below and above 365 K. A possi-bility to explain the high particle concentrations in the LS is formation of new particles. Nucleation of new particles
has been observed in the polar and mid-latitude lowermost stratosphere (Lee et al., 2003; de Reus et al., 1999; Hermann et al., 2003). Lee et al. (2003) were able to explain the ob-served fresh particles with the help of a model by Lovejoy et al. (2004), as being caused by ion-induced nucleation of sul-furic acid and water. The observed high fraction of volatile particles in the layer favors the interpretation of recent nu-cleation of sulfuric acid and water, potentially induced by an ion process. Unfortunately no precursor gases like SO2and
OH or gaseous H2SO4were measured onboard Geophysica
and the temperature difference between saturator and con-denser of the unheated COPAS channels was the same for all channels. Therefore we are currently not able to support this interpretation by other measurements or modeling efforts. It is interesting to note that a very similar particle layer in the LS with concentrations reaching up to 450 cm−3 has been
observed on a balloon flight from Kiruna on 19 January 1997 (Borrmann et al., 2000). In this flight concentrations also decrease markedly above 14 km altitude very similar to our observations, but the authors did not comment on this feature explicitly.
Airborne Measurements by Baumgardner et al. (2004) which were also conducted in January and February 2003 in the Arctic lowermost stratosphere (9–12 km) indicate an unexpectedly high fraction of typically >50% of light-absorbing particles composed predominantly of black car-bon. Additionally, the typical fraction f of non-volatile residual particles is reported to be ∼50%. These authors at-tribute this high fraction of light absorbing material to lower latitude tropospheric transport (Baumgardner et al., 2004). Their interpretation is therefore in agreement with our inter-pretation of the high CN concentration, but the high fraction of non-volatile residual particles is in contrast to our findings of typically lower fractions around 10% at these altitudes.
4 Summary
Two automated Condensation Nucleus Counters for opera-tion aboard the high altitude research aircraft Geophysica have been developed and characterized. The instruments operated successfully during two Arctic measurement cam-paigns in winter 2003. Particle number concentrations mea-sured were typical for Arctic stratosphere conditions. At altitudes around 19 km the total particle concentration nt
is found to increase from ∼10 cm−3 outside the vortex to
∼20 cm−3 inside the vortex. From the correlation with the
stratospheric tracers N2O and CFC-11 this increase is
at-tributed to aerosol nucleation in the stratosphere above. The nucleation might be rather a heterogeneous than a homoge-neous process, most likely condensation of H2SO4and H2O
on cores of meteoric material because of the observed low variability of the N2O-particle correlation and because of the
high fraction f of non-volatile residual particles found in the vortex.
Inside the polar vortex a significantly higher fraction of non-volatile particles is measured than outside the vortex. The fraction f ranges at 58 to 76 percent inside the vortex and around 12–45 percent outside the vortex. The difference is most likely caused by downward transport of meteoric ma-terial from the mesosphere inside the vortex and gives exper-imental evidence for the transport of mesospheric air even down to the lowest levels of the polar vortex. The fraction of non-volatile residual particles also serves as an experimen-tally accessible estimate of a vortex tracer. Besides meteoric smoke, particles of different nature such as light absorbing soot particles (Baumgardner et al., 2002), may influence the measurement of f and therefore limit the use of f as a vortex tracer.
The correlation of large particles >0.4 µm with potential vorticity revealed a strong decrease of n0.4 with increasing
potential vorticity inside the polar vortex.
In the lowermost stratosphere (2≤360 K) particle concen-trations nt of several hundred per cm−3were frequently
ob-served. Air masses in which these high concentrations were found had originated partly in the upper troposphere at lower latitudes and had been transported quasi-horizontally to the higher latitudes where our measurements were performed. The high particle concentrations nt in these air masses may
be explained by transport of particle-rich air from the lower latitude UT and/or by recent particle nucleation in the lower-most stratosphere.
In the future, three unheated channels of the COPAS in-struments will be operated at different saturator tempera-tures to allow for the detection of ultrafine particles. Further volatility studies will be of interest to study the cycling of meteoric material in the stratosphere.
Acknowledgements. We are thankful to C. A. Brock and J. C.
Wil-son for the original CN-Counter designs. We thank T. B¨ottger, F. Helleis, W. Schneider, A. Thomas, A. Adriani, M. Viterbini, F. Stroh and the entire Geophysica team. We thank M. Hermann for helpful discussion and his engagement and guidance in characterizing the COPAS counters. Research and development was funded by the EC under the Project Numbers EVR1-CT-2001-40020, EVK2-CT-2001-00119, ENV4-CT95-0143, and ENV4-CT96-0163. Further financial support was provided by the Johannes-Gutenberg-University and the Max-Planck-Institute for Chemistry in Mainz, Germany.
Edited by: K. Carslaw
References
Arnold, F., Curtius, J., Spreng, S., and Deshler, T.: Stratospheric aerosol sulfuric acid: First direct in situ measurements using a novel balloon-based mass spectrometer apparatus, J. Atmos. Chem., 30, 3–10, 1998.
Baumgardner, D., Dye, J. E., Gandrud, B. W., and Knollenberg, R. G.: Interpretation of measurements made by the Forward Scat-tering Spectrometer Probe (FSSP-300) during the Airborne
Arc-tic Stratospheric Expedition, J. Geophys. Res., 97, 8035–8046, 1992.
Baumgardner, D., Kok, G., and Raga, G.: Warming of the Arctic lower stratosphere by light absorbing particles, Geophys. Res. Lett., 31, L06117, doi:10.1029/2003GL018883, 2004.
Bigg, E. K., Ono, A., and Thompson, W. J.: Aerosols at altitudes between 20 and 27 km, Tellus, 22, 550–563, 1970.
Borrmann, S., Dye, J. E., Baumgardner D., Wilson, J. C., J´onsson, H. H., Brock, C. A., Loewenstein, M., Podolske, J. R., Ferry, G. V., and Barr, K. S.: In-situ measurements of changes in strato-spheric aerosol and the N2O-aerosol relationship inside and
out-side of the polar vortex, Geophys. Res. Lett., 20, 2559–2562, 1993.
Borrmann, S., Thomas, A., Rudakov, V., Yushkov, V., Lepuchov, B., Deshler, T., Vinnichenko, N., Khattatov, V., and Stefanutti, L.: In-situ aerosol measurements in the northern hemispheric strato-sphere of the 1996/7 winter on the Russian M-55 Geophysica high altitude research aircraft, Tellus, 52B, 1088–1103, 2000a. Borrmann, S., Luo, B., and Mishchenko, M.: The application of the
T-matrix method to the measurement of aspherical particles with forward scattering optical particle counters, J. Aerosol Sci., 31, 789–799, 2000b.
Brock, C. A., Hamill, P., Wilson, J. C., Jonsson, H. H., and Chan, K. R.: Particle formation in the upper tropical troposphere: A source of particles for the stratospheric aerosol, Science, 270, 1650–1653, 1995.
Brock, C. A., Schr¨oder, F., K¨archer, B., Petzold, A., Busen, R., and Fiebig, M.: Ultrafine particle size distributions measured in aircraft exhaust plumes, J. Geophys. Res., 105, 26 555–26 567, 2000.
Cziczo, D. J., Thomson, D. S., and Murphy, D. M.: Ablation, flux, and atmospheric implications of meteors inferred from strato-spheric aerosol, Science, 291, 1772–1775, 2001.
de Reus, M., Str¨om, J., Hoor, P., Lelieveld, J., and Schiller, C.: Particle production in the lowermost stratosphere by convective lifting of the tropopause, J. Geophys. Res., 104, 23 935–23 940, 1999.
Deshler, T., Johnson, B. J., and Rozier, W. R.: Balloonborne mea-surements of Pinatubo aerosol during 1991 and 1992 at 41◦N: Vertical profiles, size distribution, and volatility, Geophys. Res. Lett., 20, 1435–1438, 1993.
Deshler, T., Hervig, M. E., Hofmann, D. J., Rosen, J. M., and Liley, J. B.: Thirty years of in situ stratospheric aerosol size distribution measurements from Laramie, Wyoming (41◦N), us-ing balloon-borne instruments, J. Geophys. Res., 108, 4167, doi:10.1029/2002JD002514, 2003.
Dye, J. E., Baumgardner, D., Gandrud, B. W., Kawa, S. R., Kelly, K. K., Loewenstein, M., Ferry, G. V., Chan, K. R., and Gary, B. L.: Particle size distributions in Arctic polar stratospheric clouds, growth, and freezing of sulfuric acid droplets, and implications for cloud formation, J. Geophys. Res., 97, 8015–8034, 1992. Engel, A., M¨obius, T., Haase, H.-P., B¨onisch, H., Wetter, T.,
Schmidt, U., Levin, I., Reddmann, T., Oelhaf, H., Wetzel, G., Grunow, K., Huret, N., and Pirre, M.: On the observation of mesospheric air inside the arctic stratospheric polar vortex in early 2003, Atmos. Chem. Phys. Discuss., 5, 7457–7496, 2005,
SRef-ID: 1680-7375/acpd/2005-5-7457.
Fischer, H., Wienhold, F. G., Hoor, P., Bujok, O., Schiller, C., Siegmund, P., Ambaum, M., Scheeren, H. A., and Lelieveld, J.: