HAL Id: hal-00295983
https://hal.archives-ouvertes.fr/hal-00295983
Submitted on 18 Jul 2006
HAL is a multi-disciplinary open access
archive for the deposit and dissemination of
sci-entific research documents, whether they are
pub-lished or not. The documents may come from
teaching and research institutions in France or
abroad, or from public or private research centers.
L’archive ouverte pluridisciplinaire HAL, est
destinée au dépôt et à la diffusion de documents
scientifiques de niveau recherche, publiés ou non,
émanant des établissements d’enseignement et de
recherche français ou étrangers, des laboratoires
publics ou privés.
organic carbon particles formed by propane combustion
M. Schnaiter, M. Gimmler, I. Llamas, C. Linke, C. Jäger, H. Mutschke
To cite this version:
M. Schnaiter, M. Gimmler, I. Llamas, C. Linke, C. Jäger, et al.. Strong spectral dependence of light
absorption by organic carbon particles formed by propane combustion. Atmospheric Chemistry and
Physics, European Geosciences Union, 2006, 6 (10), pp.2981-2990. �hal-00295983�
Atmos. Chem. Phys., 6, 2981–2990, 2006 www.atmos-chem-phys.net/6/2981/2006/ © Author(s) 2006. This work is licensed under a Creative Commons License.
Atmospheric
Chemistry
and Physics
Strong spectral dependence of light absorption by organic carbon
particles formed by propane combustion
M. Schnaiter1, M. Gimmler1, I. Llamas2, C. Linke1, C. J¨ager2, and H. Mutschke2 1Institute of Meteorology and Climate Research, Forschungszentrum Karlsruhe, Germany 2Astrophysical Institute and University Observatory, University of Jena, Germany
Received: 13 December 2005 – Published in Atmos. Chem. Phys. Discuss.: 14 March 2006 Revised: 1 June 2006 – Accepted: 30 June 2006 – Published: 18 July 2006
Abstract. We have measured the extinction and absorption
cross sections of carbon particles emitted by a propane diffu-sion flame both in an aerosol chamber and on size-segregated samples deposited on optical windows. The absorption cross section, the single scattering albedo, and the ˚Angstr¨om ex-ponent show drastic dependencies both on the C/O ratio and on the particle size. This is interpretated as being due to the appearance of nucleation modes of smaller organic particles at higher C/O ratios, which were detected by SMPS mea-surements and partially by TEM analysis. The spectral range of the validity of the absorption power-law ( ˚Angstr¨om expo-nent) model is investigated by vacuum ultraviolet extinction measurements. These measurements give also indications for a preferentially aromatic nature of the OC component of the flame products.
1 Introduction
Soot aerosol emitted by combustion processes, like fossil-fuel and biomass burning, directly affects the radiative bal-ance of the earth’s atmosphere by scattering and absorption of short-wave solar radiation. In climate research, combus-tion aerosols are usually classified in two major components, namely black carbon (BC) and organic carbon (OC), which refer to the absorbing and non-absorbing carbon fractions of the aerosol. While this classification is based on the opti-cal properties of the carbonaceous material, most classifica-tions in source characterisation studies rely on the thermal behaviour of the emitted combustion aerosol. Here, OC and elemental carbon (EC) refer to the carbon fractions that ther-mally desorb in oxygen-free and oxygen-containing atmo-spheres. EC measurements are often treated as equal to BC ignoring the possibility that also OC, according to the
des-Correspondence to: M. Schnaiter
orption definition, may have a significant absorption (Bond et al., 2004).
It is well known that BC aerosol is the most efficient sorbing aerosol in the atmosphere with a mass-specific ab-sorption cross section (σabs) in the visible spectral region of
about 7.5(±1.2) m2/g (Bond and Bergstrom, 2006). In sev-eral laboratory and field studies it was found that BC aerosol emitted from high-temperature combustion processes has a low σabsspectral dependence of about ∼λ−1(Schnaiter et al.,
2003; Kirchstetter et al., 2004). The mass specific and spec-tral absorption properties of OC aerosol are less well known. However, there is evidence that σabsof low-temperature
com-bustion aerosol, e.g. from biomass burning, is lower and ex-hibits a much stronger spectral dependence than aerosol from high-temperature combustion processes, such as diesel soot (Kirchstetter et al., 2004). Usually, σabs, or more precisely
the absorption coefficient babs, is measured by filter-based
techniques like the Particulate Soot Absorption Photometer (PSAP) or the Aethalometer, which have systematic filter-induced errors (Bond et al., 1999; Weingartner et al., 2003). Due to these systematic errors babsvalues measured by such
filter-based methods are generally enhanced compared to the values measured for airborne particles and, therefore, have to be corrected based on a simultaneous measurement of the aerosol scattering coefficient bsca.
There exist two methods for measuring babs on airborne
particles, namely the Photoacoustic Spectrometry (PAS) and the difference method (DM). While PAS measures babs
di-rectly, DM relies on a simultaneous measurement of the aerosol extinction and total scattering coefficients bext and
bsca. Since both methods are not as sensitive as the
filter-based methods they are usually applied in laboratory inves-tigations or in environments with high aerosol concentra-tions like in biomass burning plumes. Current PAS instru-ments operate at single wavelengths, while the DM has been successfully applied to deduce multiwavelength babs values
of soot containing aerosols (Schnaiter et al., 2003). This
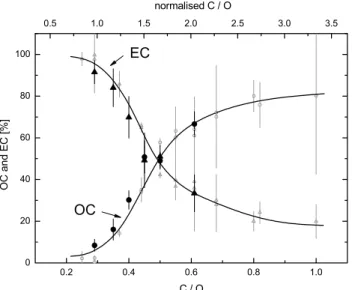
Fig. 1. Dependence of the particle composition (OC and EC con-tent) on the C/O atomic ratio in the burner. Full symbols indicate measurements on samples from the NAUA chamber, open symbols indicate samples taken directly behind the CAST burner. The up-per scale gives the C/O ratio normalised to the stoichiometric ratio of 0.3. The stoichometric ratio separates fuel-lean (normalised C/O ratio <1.0) and fuel-rich (normalised C/O ratio >1) burner condi-tions.
was achieved by combining a three-colour integrating neph-elometer (TSI, mod. 3563) with the aerosol extinction spec-trometer LOPES measuring bext wavelength-resolved from
200 nm to 1000 nm (Schnaiter et al., 2005).
In the present study the DM described by Schnaiter et al. (2005) was utilised to deduce spectral absorption proper-ties of combustion aerosol emitted from a propane diffu-sion flame operated at different combustion conditions, i.e. at different C/O ratios. Additional spectroscopic measure-ments were performed on size-segregated samples deposited on CaF2substrates to investigate in particular the spectral
ab-sorption properties of the OC aerosol fraction. This approach allows one to also measure the absorption cross section over a larger wavelength range, which gives some insight into the physical reasons for the absorption variability and the valid-ity of the ˚Angstr¨om exponent approach.
2 Combustion aerosol
Combustion aerosol was generated within a co-flow diffu-sion flame of propane and air (Combustion Aerosol Stan-dard, CAST, Jing-CAST Technologies). By variation of the propane-to-air ratio (C/O atomic ratio) CAST allows the gen-eration of carbonaceous aerosols with OC to total carbon (TC) mass ratios which vary over a broad range from a few % to more than 80% (Fig. 1). CAST was operated with the fol-lowing flow parameters: 0.06 SLM propane (fuel), 7.5 SLM
Fig. 2. Number size distribution measured by SMPS for an aerosol produced by the CAST at C/O=0.40. The vertical lines indicate the size ranges deposited on impactor stages 1 and 2 for the cases of compact spherical particles and fractal aggregates, respectively (see Sect. 4.1 and Sect. 4.2).
nitrogen (quenching gas), 20 SLM synthetic air (dilution af-ter quenching). The co-flow of the oxidation air (synthetic air) was chosen according to the desired C/O ratio and thus varied from 0.44 SLM (C/O=0.98) to 1.76 SLM (C/O=0.24). Note that we use the C/O atomic ratio to describe the op-eration conditions of the burner rather than the fuel-to-air volume ratio. The C/O ratio is calculated from the actual fuel-to-air ratio, i.e. the actual flow conditions of the burner by
C/O = 7.16 × ff
fair
(1) with ff and fairthe standard volumetric flows of the propane
fuel and the oxidation air, respectively.
Prior to the chamber experiments described in the next section, the CAST aerosol emission was characterised in a separate study. For this purpose, the number concentration and size distribution of the combustion aerosol was mea-sured directly behind the CAST output via a 1:100 dilu-tion stage composed of two 1:10 stages (PALAS, VKL 10), to avoid a significant particle coagulation in the instrument lines. Dilution-corrected number concentrations in the range from 1×107cm−3to 5×107cm−3were measured by a
con-densation particle counter (CPC, TSI mod. 3022A). Maxi-mum particle emission was found at a C/O ratio of about 0.5. Number size distributions in the 10 nm to 800 nm size range were measured by a scanning mobility particle sizer (SMPS) composed of a differential mobility analyser (DMA, TSI mod. 3071) and another CPC (TSI mod. 3010). The mo-bility equivalent median diameter was found to decrease with increasing C/O ratio starting from values between 300 nm and 340 nm for the C/O ratios 0.25 and 0.29 to less than
M. Schnaiter et al.: Spectral absorption of organic carbon 2983
10 100 1000
Mobility Equivalent Diameter Dme [nm] 0 2.0•104 4.0•104 6.0•104 8.0•104 1.0•105 1.2•105 dN/dlogD me [cm −3 ] SMPS data CMD = 315.5 nm; σg = 1.70
Fig. 3. Number size distribution of CAST aerosol produced at C/O=0.40 and sampled from the chamber after the initial strong co-agulation phase. The measured distribution is well reproduced by assuming lognormally distributed equivalent diameters.
40 nm for the highest C/O ratio of 1.0. However, for C/O ra-tios between 0.33 and 0.44 bi- and trimodal size distributions were measured, with one or two nucleation modes in addition to the soot mode (Fig. 2). We assign these nucleation modes to condensed PAH compounds, which are produced in the hotter regions of the flame and which survive the transition to the colder flame regions where they can condense either homogeneously or heterogeneously on the surfaces of the the soot particles. Particles composed of condensed PAH com-pounds have been detected in flames by several authors us-ing mass spectrometry and transmission electron microscopy (Fletcher et al., 1998; Dobbins et al., 1998; Homann, 1998; Vander Wal, 1998). More recently, Slowik et al. (2004) anal-ysed aerosols generated in a premixed propane/O2flame by
means of an Aerodyne aerosol mass spectrometer. They found at higher C/O ratios of the flame, i.e. at lower flame temperatures, an increasing amount of PAH compounds in the emitted aerosol. A maximum PAH mass fraction of about 50% was deduced. Moreover, their further analysis of the aerodynamic aerosol properties indicated a compact particle shape of the condensed PAHs/soot mixtures in contrast to the open-structured soot aggregates. Our TEM analysis of the CAST aerosol (Fig. 4) indeed has revealed two morpho-logically different particle types: (a) soot aggregates formed from very small individual particles (diameter about 30 nm) and (b) spherical particles of up to 120 nm diameter. In Fig. 4 both types are visible. Some of the large spherical type b particles are indicated by arrows in the micrograph. They are either attached to the soot aggregates or appear individually or in small aggregates. Apparently, they represent the nucle-ation modes observed in the CAST emission for C/O ratios larger than 0.33, especially the larger nucleation mode II. The nucleation mode I particles should be of about the same size as the individual soot grains. Such a separate mode of small
Fig. 4. TEM image showing the morphologies of carbonaceous aerosol particles produced at C/O=0.45. The arrows indicate larger spherical particles either isolated or attached to the soot aggregates. The long structures to which the particles are attached are bars of the supporting film.
isolated grains, however, has not been seen with the TEM. This can be understood considering that the TEM sample was sampled from the aerosol chamber after the aerosol has been strongly aged by coagulation (see Sect. 3.2).
3 Aerosol chamber measurements
3.1 Methods
The experiments were conducted at the stainless steel aerosol chamber NAUA of Forschungszentrum Karlsruhe (Fig. 5). The chamber has a volume of 3.7 m3and is equipped with a comprehensive set of aerosol instruments. Number con-centration and size distribution of the aerosol in the chamber were measured by the set of devices mentioned in the pre-vious section. Due to the high initial particle concentrations of 105cm−3, the sample air of these instruments was diluted 1:10 with synthetic air.
The spectral extinction coefficient bext(λ)was measured
in the spectral range from λ=230 nm to λ=1015 nm by the aerosol extinction spectrometer LOPES. LOPES was oper-ated in combination with a three-colour integrating neph-elometer (TSI, model 3563) measuring bsca(λ)at λ=450 nm,
550 nm and 700 nm. By subtracting bsca from bext the
ab-sorption coefficient babs(λ)could be determined at the three
nephelometer wavelengths, including a careful correction of the systematic errors of the TSI 3563 nephelometer as already discussed in Schnaiter et al. (2005). However, since
MFC MFC MFC MFC MFC MFC MFC MFC Propane Nitrogen (Quenching) Synth. Air (Dilution)
P Mixing Fan Pumping System NAUA Chamber 3.7 m³ 1:10 1:10 SMPS CPC Filter LOPES TSI 3563
Filter OC/ECFilter Sampling
SEM Filter Sampling TEM Impactor Sampling CAST System Flame
Synth. Air (Oxidation) Exhaust System
Pumping System
Fig. 5. Schematic representation of the aerosol chamber setup.
we had particle diameters of less than 300 nm in our experi-ments the systematic errors of the nephelometer were found to be low (less than 5%). Thus, the main errors in the pre-sented optical quantities are due to the instrument noise of LOPES (4×10⁻⁵m−1) and the accuracy in the determina-tion of the mass concentradetermina-tion.
Quartz filter samples for off-line thermographic carbon analysis were collected directly from the non-diluted output of CAST as well as from the aerosol chamber. Resulting TC mass concentrations of the aerosol in the chamber were used to convert the corresponding bext(λ)and babs(λ)results
to the mass specific extinction and absorption cross sections
σext(λ)and σabs(λ). Thermographic carbon analysis was
ac-complished according to the German VDI-guideline 2465, part 2 (VDI, 1999). We used a thermal carbon analyser sys-tem developed at the Institute of Environmental Technology of the Technical University of Berlin (Ulrich et al., 1990). Combustion aerosol samples were deposited on quartz fibre filters (Munktell, type MK 360) which have been prefired at 650◦C for at least 12 h prior to sampling. According to Ulrich et al. (1990), the filter samples were analysed without any pretreatment by the following three-stage temperature proto-col of 8 min duration. In the first stage, low-volatile OC com-pounds of the aerosol were volatilised in a 350◦C helium flow (purity grade 5.0), catalytically oxidised, and the carbon
frac-tion determined as CO2by NDIR spectrometry. The carbon
fraction was classified as OCI. In the second stage, remaining OC compounds were volatilised at 650◦C in a helium flow and were classified as OCII. In the last stage, the remain-ing sample was burned in a 650◦C oxygen flow (purity grade 4.8). The detected carbon fraction was classified as EC. Be-fore switching from helium flow in stage two to oxygen flow in stage three the sample was cooled down to 300◦C. High heating rates of 12◦C s−1 were applied to reduce charring of hydrocarbons, in particular during stage two. However, charring of OC cannot completely ruled out which should be keep in mind when comparing our EC/OC ratios with results of other thermal methods. Despite this possible bias, at least the observed trend in the EC/OC ratio with varying burning conditions, i.e. the C/O ratio, is reliable. The instrument is routinely calibrated by injecting known doses of CO2
(pu-rity grade 4.5). From these calibrations a precision of better than 7% can be deduced. A detection limit of about 1 µg EC or OC per sample were determined by analysing a series of blank filters.
Samples for transmission electron microscopy (TEM) were prepared on nickel grids with Lacey carbon support film utilising a self-constructed impactor with a cut-off diameter of 0.1 µm by courtesy of M. Ebert, University of Darmstadt, Germany. The grids were analysed utilising a Carl Zeiss
M. Schnaiter et al.: Spectral absorption of organic carbon 2985
Fig. 6. Specific extinction (solid lines) and absorption (squares) cross sections derived for NAUA aerosol samples produced at different C/O ratios. The absorption values originate from extinction and total scattering (nephelometer) measurements (difference method, see Sect. 1). Dashed lines represent power laws fitted through the measured absorption cross sections.
EM 902 A TEM operating at an accelerating voltage of 80 kV with a point resolution of 1 nm.
3.2 Procedure
Before adding the aerosol to the chamber, CAST was oper-ated for at least 20 min at a C/O ratio of 0.29 to achieve stable burning conditions. According to the desired C/O ratio, the flow of the oxidation air was then chosen between 0.72 SLM and 1.50 SLM. Experiments were conducted at C/O ratios of 0.29, 0.35, 0.40, 0.45, 0.5 and 0.61. Due to the high
car-bon mass emissions of 100 to 200 mg m−3 in case of low C/O ratios (0.29 to 0.45), the aerosol was diluted with syn-thetic air in a 1:10 dilution stage before adding it to the cham-ber. At the higher C/O ratios the CAST aerosol was added non-diluted. The chamber was evacuated, flushed, and pre-filled with synthetic air before each experiment. Combustion aerosol particles were then added to the chamber by pumping 20 SLM CAST aerosol through the chamber volume where it was mixed with the chamber air by a mixing fan. Depending on the C/O ratio the time for enriching the chamber air to a number particle concentration of about 2×105cm−3varied
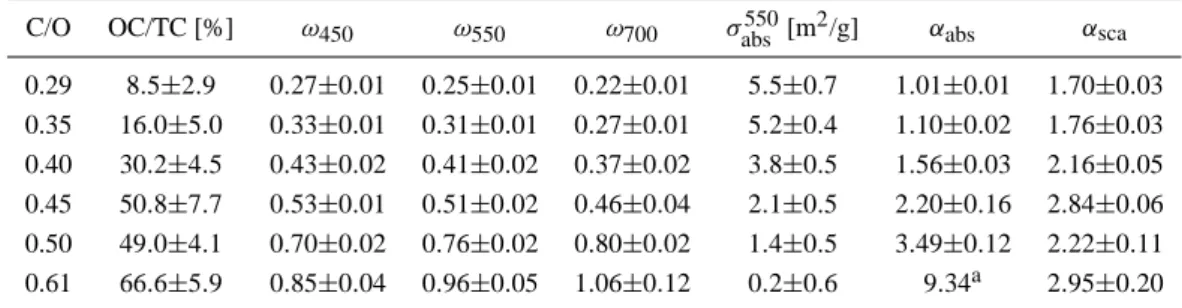
Table 1. Overview of the optical properties deduced from the aerosol experiments in the NAUA chamber.
C/O OC/TC [%] ω450 ω550 ω700 σabs550[m2/g] αabs αsca
0.29 8.5±2.9 0.27±0.01 0.25±0.01 0.22±0.01 5.5±0.7 1.01±0.01 1.70±0.03 0.35 16.0±5.0 0.33±0.01 0.31±0.01 0.27±0.01 5.2±0.4 1.10±0.02 1.76±0.03 0.40 30.2±4.5 0.43±0.02 0.41±0.02 0.37±0.02 3.8±0.5 1.56±0.03 2.16±0.05 0.45 50.8±7.7 0.53±0.01 0.51±0.02 0.46±0.04 2.1±0.5 2.20±0.16 2.84±0.06 0.50 49.0±4.1 0.70±0.02 0.76±0.02 0.80±0.02 1.4±0.5 3.49±0.12 2.22±0.11 0.61 66.6±5.9 0.85±0.04 0.96±0.05 1.06±0.12 0.2±0.6 9.34a 2.95±0.20
adeduced in the λ=450−550 nm spectral region
between 20 min and 2 h. At such high particle concentra-tions, the aerosol ages very rapidly by coagulation. To avoid a significant coagulation-induced change in the aerosol size distribution during the sampling time of LOPES (10 min), a decrease of the number concentration to at least 7×104cm−3 was awaited before the optical measurements were started. During the subsequent 2–3 h measurement phase, 4–6 extinc-tion spectra were recorded simultaneously to measurements of the number size distribution. Particle number concentra-tions and the scattering coefficients were measured continu-ously. For each experiment, quartz fibre filters for thermo-graphic analysis were prepared simultaneously to the first and last extinction measurement. Nickel grids for TEM anal-ysis were prepared after the first extinction measurement. 3.3 Results
Good agreement of the OC/EC composition was found by comparing filter samples collected directly behind CAST and from the NAUA chamber (Fig. 1). However, in contrast to the size distributions measured directly at the diluted CAST output (cf. Fig. 2), the chamber aerosol at any C/O ratio ex-hibited a mono-modal size distribution, which is a result of the strong coagulation during the aerosol addition and initial ageing phase (Fig. 3).
Results of measured and deduced spectral optical proper-ties are given in Fig. 6 and Table 1. Thus, a clear dependence of the spectral optical properties on the burner gas compo-sition is observed. With increasing C/O ratio, i.e. with in-creasing OC content, light scattering by the aerosol becomes more and more pronounced and eventually dominates the aerosol optical behaviour for C/O ratios above 0.45. This is reflected by the strong increase of the single scattering albedo ω0(λ), i.e. the ratio of scattering to extinction,
start-ing at an absorption dominated value of ω0(550 nm)=0.25
for the C/O=0.29 aerosol to a scattering dominated value of 0.96 for the C/O=0.61 aerosol. Note that the gradient of the spectral dependence of ω0is turning from negative to
posi-tive with increasing OC. Note also that the unphysical mean
ω0(700 nm) value of 1.06 deduced for the C/O=0.61
experi-ments is the result of an increasing experimental error of the DM for slightly absorbing aerosols.
The specific cross sections σext(λ) and σabs(λ) both
de-crease with increasing OC content. In particular the ab-sorption cross section σabs(λ) is strongly reduced starting
from a value of σabs(550)=5.5±0.7 m2g−1 for C/O=0.29
aerosol to a value of σabs(550)=0.2±0.6 m2g−1 in case
of the aerosol emitted from a flame with a C/O ratio of 0.61. The relative strength of this decrease is wavelength-dependent and is higher for longer wavelengths resulting in a steeper wavelength-dependence of σabs(λ)∼λ−αabsand, thus,
a higher absorption ˚Angstr¨om exponent αabs for aerosols
with higher OC content. A flat λ−1dependence was found
for the aerosol samples with OC contents below 20% in good agreement with what is usually adopted for BC (see Kirchstetter et al., 2004, and references therein). On the other hand, strong wavelength-dependencies of σabs with
αabs exponents between 2.2 and 3.5 were deduced for the
aerosol samples with OC/TC contents around 50%. Compa-rable strong spectral dependencies have been found by Bond (2001) for some aerosol samples emitted in coal combustion and by Kirchstetter et al. (2004) and Schnaiter et al. (2005) for biomass burning aerosols. In accordance with the in-terpretation of the nucleation modes observed in the CAST aerosol in case of higher C/O ratios (Sect. 2) we assign the observed correlation of the absorption ˚Angstr¨om exponent with the C/O ratio, i.e. the OC content, to the occurrence of condensed organic species (most likely PAHs) having a steep absorption edge towards the near-UV (Apicella et al., 2004). This interpretation was further supported by spectroscopic investigations of size-segregated impactor samples deposited on CaF2substrates. These investigations will be discussed in
M. Schnaiter et al.: Spectral absorption of organic carbon 2987
4 Measurements on impactor-deposited samples
4.1 Methods
CAST aerosol emitted at C/O ratios of 0.29, 0.40 and 0.50 were deposited on CaF2 substrates, i.e. optical plates
of 25 mm diameter, utilising an impactor with rotating stages (Hauke, model LPI ROT 25/0.018/2.0). The im-pactor was operated directly behind the 1:10 diluted out-put of CAST. Samples were prepared on the first and the second stage of the impactor with cut-off diameters of 0.018 µm and 0.0355 µm. The deposited mass was typically 1×10⁻⁶g cm−2 at stage one and 2×10⁻⁶g cm−2 at stage two.
The extinction, absorption and scattering spectra of the samples deposited on the CaF2 substrates have been
mea-sured with a double-beam scanning UV-VIS spectrometer (Perkin Elmer, model Lambda 19) in the wavelength range from 190 nm to 2000 nm. The spot of the spectrometer beam is approximately 4×2 mm2in size and the spectral resolution was set to 1 nm. Additionally, a VUV spectrometer (spe-cial design by LZ Hannover) has been used to extend the ex-tinction measurements to shorter wavelengths (spectral range 115 nm–230 nm) at a similar spectral resolution and similar beam size. To deduce mass-specific extinction cross sections
σextof the deposited aerosol, a simple transmission
measure-ment at a sample-covered position on the CaF2substrate was
performed relative to a transmission measurement at a blank substrate position. The relative transmission Trel is
trans-formed to σextby
σext= −ln(Trel)/µT C (2)
where µT C is the deposited sample mass per area. For
un-known reasons, some data have been found to suffer from insufficient compensation of absorption bands of the CaF2
substrates at wavelengths smaller than about 160 nm. There-fore, we omitted any σextvalues in this shorter wavelength
range. The discussion in the following section is not affected by this restriction.
For the determination of the absorption and scatter-ing cross sections, an integratscatter-ing-sphere accessory for the Lambda 19 spectrometer, equipped with a photo-multiplier detector, was utilised. The sample was placed in the center of the diffusely reflecting integrating sphere of 15 cm diameter. A tilt of the sample by 15 deg with respect to the beam direc-tion ensures that light reflected by the CaF2substrate could
either leave the sphere through a special port or be retained within the sphere when closing the port. A similar port for the transmitted light could also be either opened or closed. In this way the integrating sphere can be operated in two modes. For scattering measurements, both ports are opened and the intensity of the scattered radiation Iscacollected by
the sphere is measured. For absorption measurements, both ports are closed and the sum of reflected, scattered, and trans-mitted intensities Irefl+sca+tra is measured. The
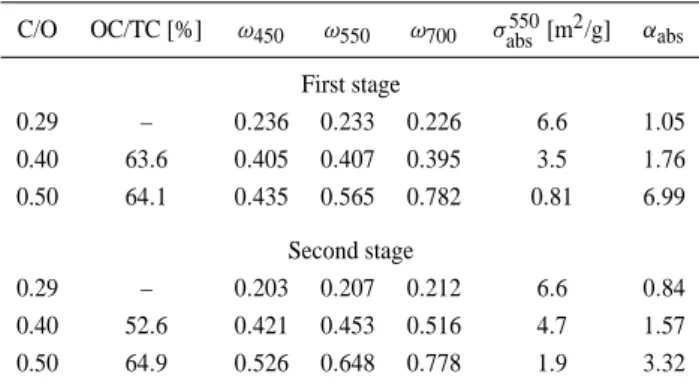
measure-Table 2. Overview of the optical properties deduced from the im-pactor samples.
C/O OC/TC [%] ω450 ω550 ω700 σabs550[m2/g] αabs
First stage 0.29 – 0.236 0.233 0.226 6.6 1.05 0.40 63.6 0.405 0.407 0.395 3.5 1.76 0.50 64.1 0.435 0.565 0.782 0.81 6.99 Second stage 0.29 – 0.203 0.207 0.212 6.6 0.84 0.40 52.6 0.421 0.453 0.516 4.7 1.57 0.50 64.9 0.526 0.648 0.778 1.9 3.32
ment of the incident intensity Iinc at removed sample and
closed ports completes the measurements with the integrat-ing sphere. With this set of measurements, the scattered and absorbed fractions relative to the incident intensity can be expressed by S=Isca/Iinc and A=1−Irefl+sca+tra/Iinc. The
value 1−A−S should coincide with Trelfrom the extinction
measurement. This has been checked and is always the case to within a deviation of (1−A−S)−Trel<0.05, in most cases
much better. Thus, the absorption, scattering, and extinction cross sections were internally consistent, except for a few cases in spectral ranges of very low extinction, where the de-viation became comparable to or even larger than the extinc-tion value itself. Apart from this internal consistency, how-ever, there are systematic deviations from the aerosol mea-surements in extinction and scattering. This is due to the fact that both the scattering and extinction measurements suffer from insensitivity to forward scattering because of (1) for-ward scattered light is not detected in the scattering measure-ment if the scattering angle is small enough so that it passes through the transmission port (2 cm in diameter) of the in-tegrating sphere and (2) forward scattered light reaches the spectrometer detector in the transmission measurement if the scattering angle is small enough to match the divergence of the spectrometer beam geometry, i.e. the acceptance angle of the spectrometer detector. Fortunately, the angular lim-its within which this is the case are similar (about ±7 deg) in both measurement modes so that the effects are partially compensated and the above-mentioned consistency is main-tained. However, depending on the relative strength of for-ward scattering, the scattering cross section can be consider-ably underestimated. This effect should become increasingly important at shorter wavelengths and is in fact seen as a re-duction of the albedo, especially for the samples produced at high C/O (see Table 2). The absorption measurement is not affected by such systematic errors.
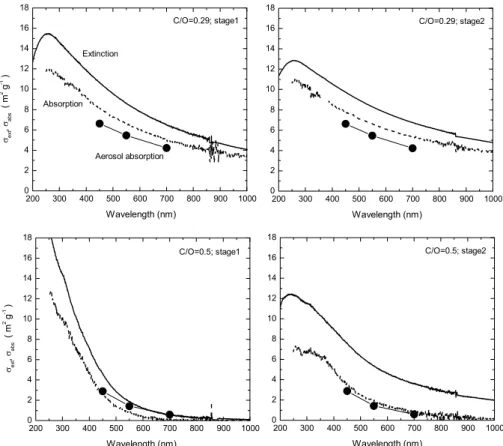
Fig. 7. Specific extinction and absorption cross sections for the deposited samples produced at C/O ratios of 0.29 and 0.50. The absorption spectra (dotted lines) were measured with the Perkin-Elmer UV-VIS spectrometer in combination with the integrating sphere, as described in Sect. 4.1. The left panels show the data corresponding to the impactor stage 1 and the right panels show the data corresponding to the impactor stage 2. The absorption values measured in the aerosol are included for comparison.
4.2 Results
The mass-normalized absorption and scattering cross sec-tions are calculated from the extinction cross section, weighted with A/(A+S) and S/(A+S), respectively. Unfor-tunately, it is not possible to derive σabsfrom the absorption
measurement alone, since absorption and scattering are com-peting processes and influence each other. The extinction and absorption cross sections obtained for samples produced at two distinct C/O ratios (0.29 and 0.50) are shown in Fig. 7, with the left panels showing the data for impactor stage 1, the right panels for impactor stage 2. For comparison, the
σabs(λ)values measured for the corresponding aerosols are
also shown. The figure demonstrates that size segregation has a strong influence on the optical properties in case of the material produced at high C/O ratio but not for the one pro-duced at low C/O.
This becomes even more clear by comparing the optical quantities given in Table 2. The sample produced at C/O=0.5 has a lower absorption cross section and a higher absorp-tion ˚Angstr¨om exponent αabs (both by factors of 2) when
deposited at stage 1 compared to stage 2. In comparison to the chamber measurements for aerosols produced at the same
C/O ratio (compare Tables 1 and 2), the samples deposited at stage 2 have quite similar properties. In contrast to that, the sample deposited at stage 1 at C/O=0.5 appears to have again a lower absorption (by 43%) and a much higher αabs, which
is in fact comparable to the one of the chamber aerosol pro-duced at C/O=0.61. The single scattering albedo ω0 of the
impactor-deposited samples is systematically lower than the corresponding ω0values of the aerosol measurements,
espe-cially at shorter wavelengths. This may partially be a conse-quence of the shortcomings of the scattering measurement.
These results indicate that the size-separation by the im-pactor also leads to a separation according to the absorption properties. According to Fig. 2, the smallest size fraction (stage 1), should contain all compact particles of the size dis-tribution up to a diameter of about 35 nm and may contain a minor fraction of small fractal aggregates up to a mobil-ity equivalent diameter of 80 nm. For the soot aggregates, the representation of the aerodynamic diameter ranges for the two impactor stages in terms of mobility equivalent di-ameters was performed by the COSIMA fractal formalism developed by Naumann (2003). Thus, stage 1 definitely con-tains the major part of the nucleation mode I of the particle size distribution discussed in Sect. 2, a small fraction of the
M. Schnaiter et al.: Spectral absorption of organic carbon 2989
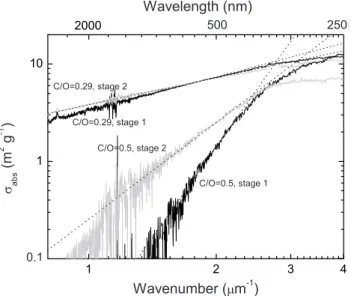
Fig. 8. Double logarithmic representation of the absorption be-haviour in the visible range for samples produced at C/O ratios of 0.29 and 0.50 and deposited on impactor stages 1 and 2. The figure shows that the power-law behavior is no longer valid at wavenum-bers larger than 2.5 µm−1.
nucleation mode II, and only very few small soot aggregates. In summary, the aerosol fraction deposited on stage 1 is char-acterized by a low absorption at visible wavelengths, which however is steeply rising towards shorter wavelengths fol-lowing a power law with a high exponent. Figure 8 indeed clearly demonstrates that the spectral dependence of the sam-ples in the wavenumber range from about 1.3 to 2.5 µm−1 can be well described by power laws. However, Fig. 8 also shows that the spectral absorption behaviour flattens consid-erably at shorter wavelengths (larger wavenumbers). Espe-cially, for the OC dominated deposit it approaches a similar slope as that of the soot dominated deposit.
An interpretation of this behaviour can be given based on Fig. 9, which shows the extinction cross section extending to wavelengths as short as 167 nm, plotted again on a wavenum-ber (energy) scale. Thus, the observed spectral dependencies are believed to represent different sections of similar absorp-tion bands extending into the far UV spectral range. These bands are related to the excitation of the π -electron systems in aromatic structures (Apicella et al., 2004). The fact that not only the soot material produced at C/O=0.29 but also the organic carbon fraction deposited at C/O=0.50 possess this band, supports our assumption that a significant fraction of the nucleation modes observed in the CAST aerosol emis-sions consists mainly of condensed polycyclic aromatic hy-drocarbons. However, for the C/O=0.5 sample deposited on stage 1, this band is obviously sharper and peaks at longer wavenumbers. According to Robertson (2002), the decline of this band towards lower energies is related to the size of the aromatic regions within a carbonaceous material, with larger
Fig. 9. Specific extinction cross sections corresponding to the sam-ples produced with C/O ratios of 0.29 and 0.50 and deposited at the impactor stages 1 and 2. The smooth (noisy) traces represent mea-surements with the UV-VIS spectrometer (the VUV spectrometer). The combined spectra reveal the presence of a prominent band with a maximum in the 3–5 µm−1 range. The visual range where the
˚
Angstr¨om exponent was determined is shaded.
aromatic regions leading to a decline at smaller wavenum-bers (longer wavelengths), such as observed in the case of the CAST material produced at C/O=0.29. Consequently, in case of the soot material generated at a C/O ratio of 0.29 the visible spectral range corresponds to a region directly within the long-wavelength side of the band. This spectral range with bulk absorption coefficients in excess of 104cm−1,
de-pending on the mass density (extinction cross section val-ues larger than about 1 m2g−1) is usually described by the
Tauc law (Robertson, 2002) giving a roughly linear1 spec-tral dependence. This is reflected by the measured ˚Angstr¨om exponent of the soot material. For the organic carbon com-ponent, however, the visible spectral range extends into the very tail of the π -electron band (Urbach tail), where local-ized states contribute to the absorption mechanism. This transition in the absorption mechanism, together with some
1It is exactly linear for zero gap energy.
residual contribution from small soot aggregates deposited on stage 1, could be responsible for the large ˚Angstr¨om ex-ponent measured here.
5 Conclusions
The investigations carried out on airborne and deposited aerosol samples from a propane diffusion flame show that their extinction and absorption properties strongly depend on the C/O ratio in the burner. It was found that at higher C/O ratios nucleation modes of OC material, presumably of large PAHs, appear in the size distribution of the aerosol, in addi-tion to the soot mode dominating at lower C/O ratios. The appearance of these modes coincides with a strong decrease of the absorption cross section of the emitted aerosol accom-panied by a strong increase of the absorption ˚Angstr¨om ex-ponent. Size-selected measurements on deposited samples also indicate that the nucleation modes are related to the OC component of the CAST products, i.e. they most likely con-sist of condensable organic species characterized by low ab-soption and a high ˚Angstr¨om exponent in the visible range. Extension of the measurements into the VUV spectral range demonstrates that these optical properties of the OC origi-nate from a π -electron absorption band in the UV, which is narrower and blue-shifted compared to the one of the soot-dominated material. This indicates that the OC is mainly aromatic in nature, consisting probably of condensed pol-yaromatic molecules.
Acknowledgements. This work has been supported by the
Helmholtz-Gemeinschaft Deutscher Forschungszentren as part of the program “Atmosphere and Climate” and by the Deutsche Forschungsgemeinschaft (grant Mu 1164/4). Further, it is part of a joint effort in Laboratory Astrophysics of the Friedrich-Schiller-Universit¨at Jena and the Max-Planck-Institut f¨ur Astronomie, Heidelberg. We thank E. Kranz for the thermographic carbon analysis.
Edited by: R. Volkamer
References
Apicella, B., Alfe, M., Barbella, R., Tregrossi, A., and Ciajolo, A.: Aromatic structures of carbonaceous materials and soot inferred by spectroscopic analysis, Carbon, 42, 1583–1589, 2004. Bond, T. C.: Spectral dependence of visible light absorption by
carbonaceous particles emitted from coal combustion, Geophys. Res. Lett., 28, 4075–4078, 2001.
Bond, T. C. and Bergstrom, R.: Light absorption by carbonaceous particles: an investigative review, Aerosol Sci. Technol., 39, 1– 41, 2006.
Bond, T. C., Anderson, T. L., and Campbell, D.: Calibration and intercomparison of filter-based measurements of visible light ab-sorption by aerosols, Aerosol Sci. Technol., 30, 582–600, 1999. Bond, T. C., Streets, D. G., Yarber, K. F., Nelson, S. M., Woo,
J. H., and Klimont, Z.: A technology-based global inventory of black and organic carbon emissions from combustion, J. Geo-phys. Res.-Atmos., 109, D14203, doi:10.1029/2003JD003697, 2004.
Dobbins, R. A., Fletcher, R. A., and Chang, H. C.: The evolution of soot precursor particles in a diffusion flame, Combust Flame, 115, 285–298, 1998.
Fletcher, R. A., Dobbins, R. A., and Chang, H. C.: Mass spectrom-etry of particles formed in a deuterated ethene diffusion flame, Anal. Chem., 70, 2745–2749, 1998.
Homann, K. H.: Fullerenes and soot formation – New pathways to large particles in flames, Angew. Chem. Int. Edit., 37, 2435– 2451, 1998.
Kirchstetter, T. W., Novakov, T., and Hobbs, P. V.: Evidence that the spectral dependence of light absorption by aerosols is affected by organic carbon, J. Geophys. Res.-Atmos., 109, D21208, doi:10.1029/2004JD04999, 2004.
Naumann, K.-H.: COSIMA – a computer program simulating the dynamics of fractal aerosols, J. Aerosol Sci., 34, 1371–1397, 2003.
Robertson, J.: Diamond-like amorphous carbon, Mat. Sci. Eng. R., 37, 129–281, 2002.
Schnaiter, M., Horvath, H., M¨ohler, O., Naumann, K. H., Saathoff, H., and Sch¨ock, O. W.: UV-VIS-NIR spectral optical properties of soot and soot-containing aerosols, J. Aerosol Sci., 34, 1421– 1444, 2003.
Schnaiter, M., Schmid, O., Petzold, A., Fritzsche, L., Klein, K. F., Andreae, M. O., Helas, G., Thielmann, A., Gimmler, M., M¨ohler, O. M., Linke, C., and Schurath, U.: Measurement of wavelength-resolved light absorption by aerosols utilizing a UV-VIS extinc-tion cell, Aerosol Sci. Technol., 39, 249–260, 2005.
Slowik, J., Stainken, K., Davidovits, P., Williams, L., Jayne, J., Kolb, C., Worsnop, D., Rudich, Y., DeCarlo, P., and Jimenez, J.: Particle Morphology and Density Characterization by Combined Mobility and Aerodynamic Diameter Measurements. Part 2: Ap-plication to Combustion-Generated Soot Aerosols as a Function of Fuel Equivalence Ratio, Aerosol Sci. Technol., 38, 1206– 1222, 2004.
Ulrich, E., Beckmann, C., and Isra¨el, G.: The Characterization of Carbon Species in Particulate Matter by Successive Thermal-Desorption, J. Aerosol Sci., 21, S609–S612, 1990.
Vander Wal, R. L.: Soot precursor carbonization: Visualization us-ing LIF and LII and comparison usus-ing bright and dark field TEM, Combust Flame, 112, 607–616, 1998.
VDI: Measurement of soot (Ambient Air) – Thermographical deter-mination of elemental carbon after thermal desorption of organic carbon, VDI 2465/2, in VDI/DIN manual Air Pollution Pre-vention Volume 4: Analysis and Measurement Methods, Beuth, Berlin, Germany, 1999.
Weingartner, E., Saathoff, H., Schnaiter, M., Streit, N., Bitnar, B., and Baltensperger, U.: Absorption of light by soot particles: de-termination of the absorption coefficient by means of aethalome-ters, J. Aerosol Sci., 34, 1445–1463, 2003.