HAL Id: hal-00202610
https://hal.archives-ouvertes.fr/hal-00202610
Submitted on 7 Jan 2008
HAL is a multi-disciplinary open access archive for the deposit and dissemination of sci-entific research documents, whether they are pub-lished or not. The documents may come from teaching and research institutions in France or abroad, or from public or private research centers.
L’archive ouverte pluridisciplinaire HAL, est destinée au dépôt et à la diffusion de documents scientifiques de niveau recherche, publiés ou non, émanant des établissements d’enseignement et de recherche français ou étrangers, des laboratoires publics ou privés.
thermodynamic parameters on the solid-liquid
separation of pollutants
German Montes Hernandez, Sophie Rihs
To cite this version:
German Montes Hernandez, Sophie Rihs. A simplified method to estimate kinetic and thermodynamic parameters on the solid-liquid separation of pollutants. Journal of Colloid and Interface Science, Elsevier, 2006, 299, pp.49-55. �10.1016/j.jcis.2006.01.071�. �hal-00202610�
A simplified method to estimate kinetic and thermodynamic parameters on
the solid-liquid separation of pollutants
Montes-Hernandez G.a* and Rihs S.b
a
UMR 7566 UHP-CNRS, 54506 Vandoeuvre les-Nancy-Cedex, France
b
UMR 7517 ULP-CNRS, CGS, 1 rue Blessig, F-67084 Strasbourg, France
*
Corresponding author: German Montes-Hernandez E-mail address: [email protected]
Abstract
The aim of the present study was to propose a simplified experimental-theoretical method to estimate the kinetic and thermodynamic parameters on the solid-liquid separation of pollutants by using the kinetics studies with batch reactors, i.e. the removed quantity of dissolved ion as a function of time at different initial concentration. This method was applied to the removal of uranyl ion (UO2)2+ from aqueous solutions onto synthetic manganese oxide
(birnessite). The pseudo-second-order kinetics and one site saturation models were proposed to fit the experimental and calculated data, the fitting parameters being estimated by a non-linear regression, using least-squares method.
For initial concentration range 0.2-11.8 µM, the results showed that the uranyl removal process in dispersed batch-reactors can be efficiently modelled by the proposed models. Then, several kinetic and thermodynamic parameters were calculated such as maximal removed quantity of uranyl qr,max, half-removal time t1/2, initial rate of uranyl-ions removal v0, initial
uranyl-removal coefficient K, maximal rate of uranyl removal v0,max, mass transfer coefficient
Dtransfer, , equilibrium Langmuir constant KL, and constant separation factor Ks. These
parameters allow to demonstrate that the removal process of U onto birnessite is favourable, and that the maximum surface coverage of the uranyl ions represents about 3% of vacant sites in the Mn layer.
Keywords: Removal, Uranyl ions, Manganese oxide, Pseudo-second-order kinetics, One site saturation models, Batch reactors.
1. Introduction 1.1 General concepts
The adsorption at solid-liquid interfaces is important in technological processes and products such as corrosion, catalysis, nanoparticle ultracapacitors, molecular sieves, and semiconductor manufacturing [1]. In addition, the adsorption of surfactants at the solid-liquid interfaces is an important topic in numerous processes ranging from mineral beneficiation to detergency, including such applications as wastewater treatment and soil remediation, dispersion stabilisation in ceramics and enhanced oil recovery [2, 3].
In the literature has been reported numerous experimental studies on the solid-liquid separation of pollutants (ions and organic molecules). These studies have been preferentially performed in the laboratory with batch reactors because its easy operation and lower cost compared with column reactors. Unfortunately, numerous authors still report their experimental results in a raw form (i.e. without fitting of data) or they systematically apply the classical models (e.g.. Langmuir, Freundlich, Redlich-Peterson, Brunauer-Emmett-Teller, and others) in order to fit their experimental data. But, they frequently negligee the importance of kinetic data. For this reason, the major objective of this study was to propose a simplified experimental-theoretical method to estimate the kinetic and thermodynamic parameters on the solid-liquid separation of pollutants by using the kinetics studies with batch reactors, i.e. the removed quantity of dissolved ions as a function of time at different initial concentrations. This method was applied to the removal of uranyl ions (UO2)2+ from aqueous
solutions onto synthetic manganese oxide (hexagonal birnessite). Pseudo-second-order kinetics and one site saturation models are proposed to fit the experimental and calculated data at low dissolved U(VI) concentration. For this case, the fitting parameters can be estimated by a non-linear regression, using least-squares method.
1.2 General description of manganese oxides
Birnessite, and its related hydrated form (buserite) are the most common layered Mn oxides in natural environments [4]. Because of their microcristallinity (resulting to high specific surface area), surface charge, high cation-exchange capacity and redox properties, these minerals are known to have unusally high scavenging capacities for heavy metals (e.g. Co, Zn, Pb [5-8]). The affinity of radionuclides (U, Th, Ra, Pu) for Mn-oxides has also been widely reported at every stage of radionuclide transport on earth [9-13]. The presence of extremly small amount of Mn oxides (as low as 0.5% for instance [12]) might be adequate to control the distribution of heavy metals and radionuclides between soil or sediment and aqueous systems. Yet, most of studies on the interactions between these minerals and radionuclides occuring in natural systems remained global, and very few detailled works have been realized.
The cristalline stucture of buserite and its conversion to birnessite was extensively studied [6, 14-21]. These studies have established that Na-rich buserite (at high pH) consists of successive layers of Mn octaedra with a periodicity of 10 Å along the c axis and exchangeable cations and two layers of H2O in its interlayer space. Partial dehydratation of
monoclinic buserite leads to the formation of a 7Å layer spacing triclinic birnessite with various interlayer cations. Moreover, buserite also converts to a 7Å layer spacing hexagonal
birnessite [ + + + 30.10+ 4 0.74 3 0.12 2 0.05Mn (Mn Mn
Mn 0.17)O1.7(OH)0.3] [19] in acidic medium. This
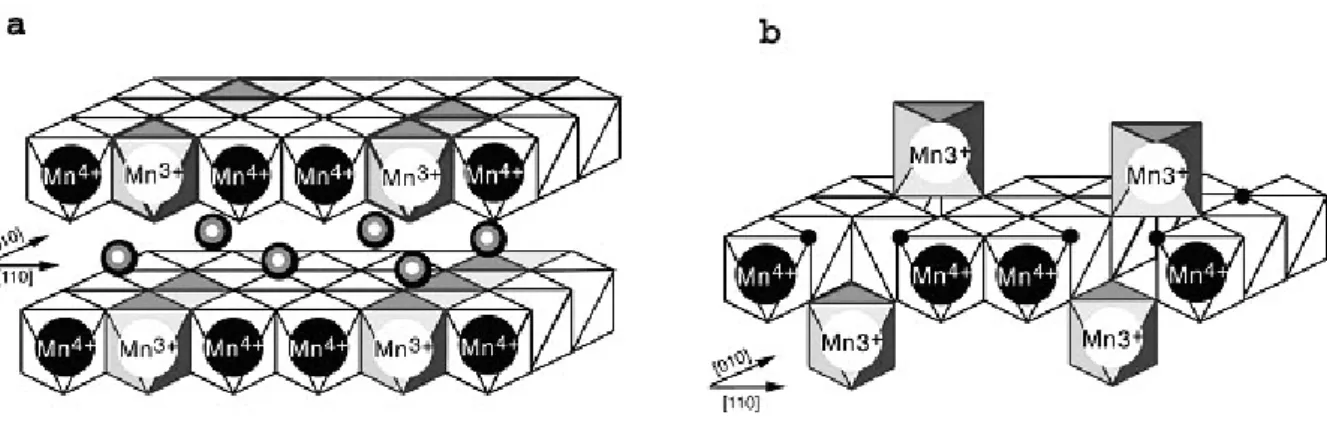
conversion results to the formation of vacant layer sites and the lost of exchangeable cations in the interlayer space. The layer charge is thus compensated by interlayer protons and Mn3+ and Mn2+ cations (Fig. 1). Because the conversion of monoclinic to hexagonal birnessite is occuring at pH around 7, both types can be present in natural soils, each of them having different reactive surface proprieties. Distinction between these two forms in natural samples using conventional analytical techniques is usually difficult because of the defective, poorly
crystallized structure of Mn soil minerals. However some recent studies using powerful X-Ray techniques succeded to demonstrate that hexagonal birnessite is the one involved in the sequestration of several heavy metals in soils [17, 22, 23].
2. Materials and Methods
Synthetic Na-rich buserite (Na0.3MnIII,IVO2) was prepared by oxidation process at high
pH following the protocol described by Giovanoli et al. [24]. Immediately after the end of the oxidation, the crystals were kept in solution and aged at 120°C for 48h, yielding to highly ordering crystals. The aged product was centrifuged and the supernatant discarded. The solid was then repeatedly washed by centrifugation and re-dispersion in deionized water about 15 times. The resulting material was stored in suspension at 4°C. Powder X-Ray diffraction on solid (oven-dried at 60°C) confirms the purity of the synthesized Na-buserite, and shows the diagnostic peaks (202 and 203 reflections at 2.03 and 1.71 Å respectively) of hexagonal birnessite after equilibration to low pH [8, 17, 19]. A specific surface area of 11 m²/g was measured by the BET-N2 method.
Preparation of hexagonal birnessite by equilibration of Na-buserite to low pH was performed following a protocol similar to Silvester et al. [18]. In a batch reactor the appropriate amount of buserite suspension (corresponding to 1g of solid) was suspended in 300ml of an ionic medium of 0.1M NaClO4 (previously boiled and bubbled with Ar gas). The
suspension was continuously maintained in a Ar atmosphere to exclude CO2 and stirred at a
constant rate of 200 rpm . The initial pH of this suspension was equal to ~9.5. The suspension was equilibrated to pH 4 with an automatic titrator, by addition of HCl 0.1M (about 30 ml of 0.1M acid was necessary to reach equilibrium, achieved within less than 12 hours). This pH was choosen to be in the range of hexagonal birnessite stability (< 7) and above the pH of
zero point of charge pHzpc of the mineral (expected to be in the same range than δ-MnO2 i.e:
2-3 [25] considering the analogy between both minerals). An appropriate amount of UVI (in acidic solution) was then added to the suspension, the pH being readjusted to 4 by adding appropriate amount of NaOH. Amount of added UVI was precisely weighted to get initial concentrations ranging from 0.2 to 11.8 µM. The evolution of the dissolved UVI concentration was monitored by sampling the solution at various times. The experiments were performed at room temperature. Few cm3 of the suspension were withdrawn and filtred through a 0.45µm Teflon filter. Adsorption on the filter and the filter-holder was determined to be negligible. The filtred solution was immediately acidified, and further diluted for measurements of UVI by Inductively Coupled Plasma Mass Spectrometry (Fisons VG-Plasma Quad ICP-MS). The experiments were maintained several days but equilibrium was achieved within 20 hours.
3. Results and discussion
3.1 The removed quantity of Uranyl ion (UO2)2+
Calculation of aqueous U speciation was performed using the MINTEQA2 3.11 code [26]. Thermodynamic data for aqueous uranyl species and solubility constants of U-bearing solid phases were adjusted to be consistent with the NEA database [27]. The formation constant of UO2(OH)2 [28] and solubility constant of "amorphous" schoepite from Torrero et
al. [29] were also added to the database. Calculation of U speciation shows that more than 96% of the UVI occur as uranyl ions (UO22+) in the experimental suspensions over the entire
range of U concentration. All the U-bearing solid phases in the database of MINTEQA2, were undersaturated in these solutions.
The removed quantity of uranyl ions on the dispersed particles of manganese oxide as a function of time can be calculated using the following formula:
V m C C qrt t − = 0 , (1)
where C0 represents the initial concentration of uranyl ion [µmol/L]; Ct represents the
concentration of uranyl ion at a t instant time [µmol/L]; V represents the volume of the aqueous solution [L]; and m represents the mass of synthetic manganese oxide [g].
The experimental kinetic curves concerning the removal of uranyl ion from aqueous solution onto synthetic manganese oxide are shown in Figure 2. Theses curves show clearly that the removed quantity of uranyl ion increases with an increase in the initial concentration due to a high physicochemical affinity between solid-particles of manganese oxide and uranyl ions.
3.2 Fitting of kinetic curves
Several kinetic models including first-order, pseudo-first-order, second-order, pseudo-second-order, parabolic diffusion and power function kinetic expression are reported in the literature in order to fit the kinetic experimental data of a solid-liquid separation process. For our study, the best fit (attested by a correlation factor close to 1) of the experimental data was achieved when using a pseudo-second-order kinetic model, following ,
(
)
2 , max , , t r r r t r q q k dt dq − = (2) where kr is the rate constant of removal uranyl ion [g/µmol min] for a given uranylconcentration, qr,max is the maximal removed quantity of uranyl or removed quantity of uranyl
at equilibrium [µmol/g], qr,t is the removed quantity of uranyl at any time, t, [µmol/g].
The integrated form of equation (2) for the boundary conditions t = 0 to t = t and qr,t = 0 to qr,t
= qr,t, is represented by a hyperbolic equation:
(
k q)
t t q q r r r t r = + max , max , , / 1 (3) In order to simplify the experimental data fitting a novel constant can be defined “(1/krqr,max)= t1/2”. Physically this novel constant represents the time to which the half of the maximal
and it allows to calculate the initial rate of uranyl-ion removal by using the following expression:
(
)
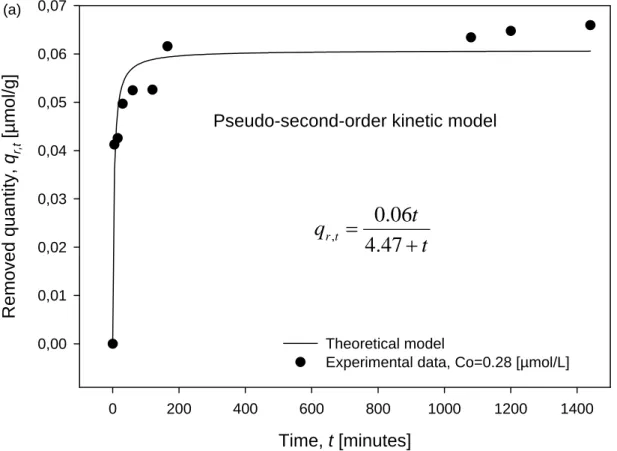
2 max , 2 / 1 max , 0 r r r q k t q v = = (4)The fitting of experimental kinetic curves (qr,t vs. t) by using the Equation 3 is showed in the
Figure 3. The parameters t1/2 and qr,max were estimated by applying a nonlinear regression by
least squares method performed with SigmaPlot software (see Table 1).
In the other hand, the initial rate of the uranyl removal v0, and the maximal removed quantity
of uranyl qr,max, are a function of, for example, the initial concentration of uranyl, the
temperature, the dose and nature of solid-particles (of manganese oxide), pH of solution, etc. The approach proposed in this study considers only the variation of the initial concentration of uranyl (see Table 1), i.e. in the experiments the temperature, the solid-particles/volume of solution ratio and pH of solution were fixed (see materials and methods section).
Concerning the variation of initial concentration of uranyl ion C0, the initial rate of the uranyl
removal can be then represented as a function of initial concentration of uranyl ion (v0 =
f(C0)). This function may be fitted assuming one site saturation model, two sites saturation
model or multi-sites saturation model. For this study, a one-site saturation model was considered because this has a well correlation with experimental data; the differential form of equation can be written as follows:
(
)
2 0 max , 0 0 0 0 v v k dC dv v − = (5) where kv0 is a complex kinetic constant of uranyl removal [g min L/µmol2], v0,max is themaximal rate of uranyl removal [µmol/g min], v0 is the initial rate of uranyl removal [µmol/g
min], and C0 is the initial concentration of uranyl [µmol/L].
The integrated form of equation (5) for the boundary conditions C0 = 0 to C0 = C0 and v0 = 0
(
0 0,max)
0 0 max , 0 0 / 1 k v C C v v v + = (6) where kv0v0,max = K can be interpreted as the initial uranyl-removal coefficient [L/µmol].Then, the equation (6) can be rearranged to obtain:
0 0 max , 0 0 1 KC KC v v + = (7) This model is equivalent to the Langmuir-Hinshelwood equation sometimes published in the literature; see for example [30, 31].
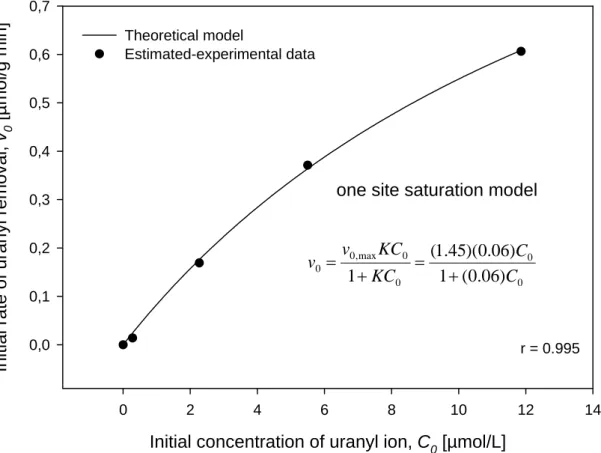
The fitting of data v0 vs. C0 by using the Equation (7) allows the estimation of v0,max and K.
For this case, a nonlinear regression by least squares method was performed with SigmaPlot software (see Figure 4). This Figure shows that one site saturation model has a strong correlation with the estimated-experimental data of uranyl removal, yielding to a value of 1.45 µmol/g min for v0,max and a value of 0.06 L/µmol for K. This estimation is valid for the
concentration range of uranyl-ion taken into account in this study. Unpublished data showed that high concentrations of uranyl ions (> 25 µmol/L) in the system produce a complex behaviour in the solid-liquid interactions (e.g.. kinetic sorption-desorption process, possibly the activation of other site types, etc.).
The maximal rate of uranyl removal v0,max estimated by equation (7) and now given in [mol/g
s], allows the calculation of a mass transfer coefficient Dtransfer [m2/s] using the relation:
a Nm v
Dtransfer = 0,max (8) where N is the Avogadro number (6.0221353x10²³ ions / mol), m is the mass of solid-particles of manganese oxide dispersed in the reactor (1g) and a is the cross-sectional area of uranyl
ion [m2]. It was shown by speciation calculations that UO22+ is the dominant species in the
experimental solutions. The cross-sectional area was thus assumed to be equal to the surface of the equatorial plane of the uranyl moiety. In aqueous media, uranyl ions usually display 5
or 6 atoms of oxygens in this plane, with a U-Oeq bond length ranging from 2.3 to 2.5 Å [32].
With a mean value of 2.4 Å and 5 equatorial Oeq, the cross-section area would be equal to
1.36.10-19 m². A maximum value of this area can be calculated by assuming a surface equal to a disc with a radius of 2.4 Å ( a max = 1.8.10-19 m²). As expected, the value calculated by Equation 8 (2.64x10⁻³ m2/s) shows that the mass transfer in a dispersed reactor is very high compared with mass transfer (effective diffusion coefficient) in a porous medium; for example, a ferromanganese crusts medium (≅1x10⁻¹⁰
m2/s) [33].
The coefficient value calculated by Eq. 8 represents only the external mass transfer and evidently, this calculation does not indicate, if the removal process is governed by external mass transfer (boundary layer diffusion) or by intraparticle diffusion. In order to characterize what is the rate-controlling step involved in the uranyl removal process, the removal data
could be analyzed with Boyd equation, kt
q q r t r = ⎥ ⎥ ⎦ ⎤ ⎢ ⎢ ⎣ ⎡ − − max , , 1
ln , where qr,t represents the
removed quantity of uranyl ion at any time, t, [µmol/g]; qr,max represents the maximal
removed quantity of uranyl ion or removed quantity of uranyl ion at equilibrium [µmol/g] and
k represents the constant rate of removal process [34]. The linearity of kt vs t plot should
provide useful information to distinguish between external-transport and intraparticle-transport-controlled rates of removal process. For example, a linear plot indicates that, for the studied solute concentration range, external mass transport mainly governs the rate-limiting process. It is necessary to remark that the Boyd equation can be derived by a pseudo-first-order kinetic model. Then, the Boyd equation must be taken with care because the kinetic process, in the current study, was treated by a pseudo-second-order kinetic model.
3.3 Removal of uranyl ions at equilibrium
The Equation 5 (see above) describes the initial rate of the uranyl-removal process as a function of initial concentration of uranyl ion (v0 = f(C0)). Obviously, this equation can also
be written in terms of the maximal removed quantity of uranyl ion at equilibrium (qr,max = qe)
and the equilibrium concentration of uranyl ion, Ce, (qe=f(Ce)). Then, assuming one site
saturation model, the differential form of equation can be written as follows:
(
)
2 max , e e qe e e q q k dC dq − = (9) where kqe is a complex constant of removal process [g L/µmol2], qe,max is the maximalremoved quantity of uranyl ions at equilibrium [µmol/g], qe is the removed quantity of uranyl
ions at equilibrium [µmol/g] and Ce is the equilibrium concentration of solute [µmol/L].
The integrated form of equation (9) for the boundary conditions Ce = 0 to Ce = Ce and qe = 0
to qe = qe, can be written as follows:
e e qe e e e C q k C q q + = max , max , 1 (10)
where (kqe)(qe,max) = KL can be interpreted as the equilibrium uranyl-removal coefficient
[L/µmol]. The equation 10 can be then rearranged to obtain the Langmuir equation:
e L e L e e C K C K q q + = 1 max , (11)
The fitting of data qe vs Ce by using the equation (11) allows the estimation of qe,max and KL.
For this case, a nonlinear regression by least squares method was performed with SigmaPlot software (see Fig. 5).
Consequently, the equilibrium uranyl-removal coefficient KL (0.96 L/µmol) can be used to
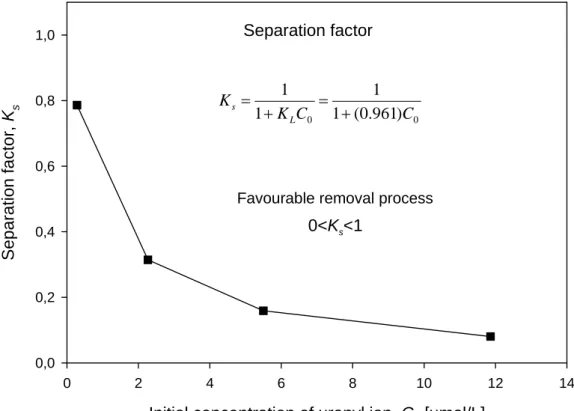
considered as a more reliable indicator of ion removal process (in fixed-bed or batch systems) [35]. This parameter is defined by the following relationship:
0 1 1 C K K L s = + (12)
where Ks is a dimensionless separation factor, C0 is initial concentration of uranyl ions
[µmol/L] and KL is the equilibrium uranyl-removal coefficient [L/µmol]. For favourable
removal process, 0<Ks<1; while Ks>1 represents unfavourable removal process, and Ks=1
indicates linear removal process. If Ks=0 the removal process is irreversible. For the
concentration range considered in this study, the removal process of uranyl ions is favourable (see Fig. 6).
The maximal removed quantity of uranyl ions at equilibrium qe,max estimated by equation (11),
equal to 0.86 µmol/g, can be assumed to correspond to the saturation of some high affinity sites. Previous studies have established that sorption on birnessite consists of ion exchange at interlayer sites and pH-dependent sorption at specific sites usually corresponding to the vacancies on the MnO6 sheet [4-6, 20, 21]. Alkali and alkaline earth metal ions with large
ionic radii are located in interlayer sites, whereas metal ions seem more likely connected to vacancy sites. The high rate of uranyl sorption on the birnessite observed in this study (significantly higher than the rate of Na desorption from interlayer sites measured during the equilibration period for instance), and the strong geometrical constraint due to the size and shape of the uranyl moiety both assert against the diffusion of uranyl inside the interlayer of the mineral. Instead, sorption at the crystallite edge sites can be inferred. The saturation of uranyl high affinity sites would then correspond to a density of edge sites equal to 0.047 sites/nm², taken into account the specific surface area of 11 m²/g measured for the solid phase. This density might be compared to the density of vacant sites at the birnessite surface. If the MnO2 (110) plane is used as a model surface, a total density of 10 Mn sites/nm² can be
et al. [17, 18] implies that 17% of the layer Mn ocataedra are vacants. This amount yields to a density of 1.7 vacant sites/nm² at the surface of the birnessite crystallites. The maximum surface coverage of the uranyl ions represents thus about 3% of vacant sites in the Mn layer.
4. Conclusion
The experimental-theoretical approach presented in this study allowed the description and estimation of kinetic and thermodynamic parameters on the removal of uranyl ion (UO2)2+
from aqueous solutions onto synthetic manganese oxide by using the kinetic studies with dispersed batch-reactors, i.e. the removed quantity of uranyl ion as a function of time at different initial concentrations.
These basic parameters will allow the optimization for an ion-removal process for dispersed batch-reactors “at a laboratory scale”, and then they will also facility the extrapolation of an ion-removal process for dispersed flux-continuous-reactors “at a pilot scale”.
Finally, pseudo-second-order kinetics and one site saturation models allowed a mechanistic analysis on the uranyl removal process in dispersed batch-reactors.
Acknowledgements
The authors are grateful to UMR 7517 ULP-CNRS-CGS, France, for providing a financial grant for this work. A. Manceau and M. Musso are thank for the advice on the synthesis of birnessite. This is the CGS-EOST contribution number N° [CN 2006.201-UMR7517].
References
[1] J. R. Bargar , S. N. Towle , Jr. G. E. Brown, G. A. Parks, J. Colloid Interf. Sci. 185 (1997) 473.
[2] W. Wang, J. T. C. Kwak, Colloid Surf. A 156 (1999) 95.
[3] L. Huang, C. Maltesh, P. Sumasundaran, J. Colloid Interf. Sci. 177 (1996) 222. [4] J. Post Proc. Natl. Acad. Sci. USA. 96 (1999) 3447.
[5] E. A. Jenne, in "Trace inorganics in water" (R. F. Gould, Ed), Am. Chem. Soc. Adv. Chem. Ser., 337, 1967
[6] A. Manceau, V. A. Drits, E. Silvester, C. Bartoldi, B. Lanson, American Mineralogist. 82 (1997) 1150.
[7] A. Manceau, B. Lanson, V. A. Drits, Geochim. Cosmochim. Acta. 66 (2002) 2639.
[8] B. Lanson, V. A. Drits, A.C.Gaillot, E. Silvester, A. Plançon, A. Manceau, American Mineralogist. 87 (2002) 1631.
[9] T. Allard, P. Ildefonse, C. Beaucaire, G. Calas, Chem. Geol. 158 (1999) 81. [10] D. M. Bonotto, J. South Am. Sci. 11 (1998) 389.
[11] R. F. Anderson, M. P. Bacon, P. G. Brewer, Earth Planet. Sci. Lett. 66 (1983) 73.
[12] A. Herczeg, J. Simpson, R. Anderson, R. Trier, G. Mathieu, B. Deck, Chem. Geol. 72 (1988) 181.
[13] M. C. Duff, D. B. Hunter, Envir. Sci. Techn. 33 (1999) 2163. [14] V. M. Burns, R. G. Burns, Earth Planet. Sci. Lett. 39 (1978) 341.
[15] F. V. Chukhrov, B. A. Sakharov, A. Gorshkov, V. A. Drits, Y. P. Dikov, International Geol. Rev. 27 (1985) 1082.
[17] V. A. Drits, E. Silvester, A. Gorshkov, A. Manceau, American Mineralogist. 82 (1997) 946.
[18] E. Silvester, A. Manceau, V. A. Drits, American Mineralogist. 82 (1997) 962.
[19] B. Lanson, V. A. Drits, E. Silvester, A. Manceau, American Mineralogist. 85 (2000) 826.
[20] A. Manceau, A. Gorshkov, V. A. Drits, American Mineralogist. 77 (1992) 1133. [21] A. Manceau, A. Gorshkov, V. A. Drits, American. Mineralogist. 77 (1992) 1144.
[22] A. Manceau, N. Tamura, R. Celestre, A. MacDowell, N. Geoffroy, G. Sposito, H. Padmore, Env. Sci. Technol. 37 (2003) 75.
[23] A. Manceau, C. Tommaseo, S. Rihs, N. Geoffroy, D. Chateigner, M. Schlegel, D. Tisserand, M.A. Marcus, N. Tamura, Z.S. Chen, Geochim. Cosmo. Acta 69 (2005) 4007.
[24] R. Giovanoli, E. Stähli, W. Feitknecht, Helvetica Chimica Acta. 53 (1970) 454. [25] L. S. Balistrieri, J. W. Murray, Geochim. Cosmochim. Acta. 46 (1982) 1041.
[26] J.D. Allison, D.S. Brown, N.K. Novo-Gradac, MINTEQA2: a geochemical assessment model for environmental systems, U.S. EPA: Athens, Georgia, 1991.
[27] I. Grenthe; J. Fuger, R. Konings, R.J. Lemire, A.B. Muller, C. Nguyen-Trung, J. Wanner, Chemical Thermodynamics of Uranium, North-Holland, Amsterdam, 1992.
[28] R.J. Silva,. Mater. Res. Soc. Symp. Proc.257 (1992) 323.
[29] M.E. Torrero, I. Casas, J. De Pablo, M. Sandino, B.A. Grambow, Radiochim. Acta 66/67 (1994) 29.
[30] O. Zahraa, H. Y. Chen, M. Bouchy, J. Adv. Oxid. Technol. 4 (1999) 167.
[31] A. H. C. Chan, J. F. Porter, J. P. Barford, C. K. Chan, Water Sci. Technol. 44 (2001) 187. [32] P. C. Burns, R. C. Ewing, F. C. Hawthorne, Can. Mineral. 35 (1997) 1551.
[33] G. M. Henderson, K.W. Burton, Earth and Planetary Sciences Letters 170 (1999) 169. [34] G. E. Boyd, A. W. Adamson, L. S. Meyers, J. Am. Chem. Soc. 69 (1947) 2836.
C0 [µmol/L] qr,max [µmol/g] t1/2 [minutes] r (correlation factor) v0 [µmol/g. min] 0.28 0.062±0.003 4.5±1.4 0.9605 0.014 2.27 0.399±0.007 2.4±0.3 0.9947 0.169 5.50 0.666±0.026 1.8±0.8 0.9600 0.371 11.86 0.767±0.024 1.3±0.4 0.9842 0.606
Table 1. Fitting kinetic parameters for removal of uranyl ion from aqueous solution onto synthetic manganese oxide.
Figure 1. Structure of triclinic birnessite (a)with Na interlayer cations and hexagonal (low pH) birnessite (b). After Drits et al.[17], Silvester et al.[18] and Lanson et al.[19]
Time, t [minutes] 0 200 400 600 800 1000 1200 1400 R e moved q u a n ti ty, q r,t [µmol /g] 0,0 0,2 0,4 0,6 0,8 1,0 C0=0.28 µmol/L C0=2.27 µmol/L C0=5.50 µmol/L C0=11.86 µmol/L
Figure 2. Experimental kinetic curves for removal of the uranyl-ion from aqueous solution onto synthetic manganese oxide.
Time, t [minutes] 0 200 400 600 800 1000 1200 1400 R e moved qu an tity, q r,t [µmol/g] 0,00 0,01 0,02 0,03 0,04 0,05 0,06 0,07 Theoretical model
Experimental data, Co=0.28 [µmol/L]
Pseudo-second-order kinetic model
(a)
t
t
q
rt+
=
47
.
4
06
.
0
,Figure 3. Fitting of experimental data for removal of the uranyl-ion from aqueous solution onto synthetic manganese oxide. (a) C0=0.28 [µmol/L], (b) C0=2.27 [µmol/L], (c) C0=5.50
Time, t [minutes] 0 200 400 600 800 1000 1200 1400 R e moved qu an tity, q r,t [µmol/g] 0,0 0,1 0,2 0,3 0,4 0,5 Theoretical model
Experimental data, Co=2,26 [µmol/L]
Pseudo-second-order kinetic model
(b)
t
t
q
rt+
=
36
.
2
40
.
0
, Figure 3. (b)Time, t [minutes] 0 200 400 600 800 1000 1200 1400 R e moved qu an tity, q r,t [µmol/g] 0,0 0,2 0,4 0,6 0,8 Theoretical model
Experimental data, Co=5.50 [µmol/L]
Pseudo-second-order kinetic model
(c)
t
t
q
rt+
=
79
.
1
66
.
0
, Figure 3. (c)Time, t [minutes] 0 200 400 600 800 1000 1200 1400 Removed quant it y , q r,t [µmol/g] 0,0 0,2 0,4 0,6 0,8 Theoretical model
Experimental data, Co=11.86 [µmol/L]
Pseudo-second-order kinetic model
(d)
t
t
q
rt+
=
26
.
1
76
.
0
, Figure 3. (d)Initial concentration of uranyl ion, C0 [µmol/L] 0 2 4 6 8 10 12 14 In it ial rat e of uranyl removal, v 0 [µmol/g min] 0,0 0,1 0,2 0,3 0,4 0,5 0,6 0,7 Theoretical model Estimated-experimental data r = 0.995
one site saturation model
0 0 0 0 max , 0 0 ) 06 . 0 ( 1 ) 06 . 0 )( 45 . 1 ( 1 C C KC KC v v + = + =
Figure 4. Fitting of initial rate of uranyl removal as a function of initial concentration of uranyl ion.
Equilibrium concentration of uranyl ion, Ce [µmol/L] 0 2 4 6 8 10 Removed quant it y at equil ib rium, qe [µ mo l/ g] 0,0 0,2 0,4 0,6 0,8 1,0 Theoretical model Estimated-experimental data
One site saturation model
e e e L e L e e C C C K C K q q ) 96 . 0 ( 1 ) 96 . 0 )( 86 . 0 ( 1 max , + = + = r = 0.99
Figure 5. Fitting of removed quantity at equilibrium as a function of equilibrium concentration of uranyl ion.
Initial concentration of uranyl ion, C0 [µmol/L] 0 2 4 6 8 10 12 14 Sep a ra tion fact or, Ks 0,0 0,2 0,4 0,6 0,8 1,0 0<Ks<1
Favourable removal process
Separation factor 0 0 1 (0.961) 1 1 1 C C K K L s = + = +