HAL Id: hal-00579602
https://hal.archives-ouvertes.fr/hal-00579602
Submitted on 28 Dec 2015
HAL is a multi-disciplinary open access
archive for the deposit and dissemination of
sci-entific research documents, whether they are
pub-lished or not. The documents may come from
teaching and research institutions in France or
abroad, or from public or private research centers.
L’archive ouverte pluridisciplinaire HAL, est
destinée au dépôt et à la diffusion de documents
scientifiques de niveau recherche, publiés ou non,
émanant des établissements d’enseignement et de
recherche français ou étrangers, des laboratoires
publics ou privés.
enhancements observed by DEMETER over the Sichuan
region during the earthquake preparation
Tatsuo Onishi, Jean-Jacques Berthelier, M. Kamogawa
To cite this version:
Tatsuo Onishi, Jean-Jacques Berthelier, M. Kamogawa. Critical analysis of the electrostatic turbulence
enhancements observed by DEMETER over the Sichuan region during the earthquake preparation.
Natural Hazards and Earth System Sciences, European Geosciences Union, 2011, 11 (2), pp.561-570.
�10.5194/nhess-11-561-2011�. �hal-00579602�
Nat. Hazards Earth Syst. Sci., 11, 561–570, 2011 www.nat-hazards-earth-syst-sci.net/11/561/2011/ doi:10.5194/nhess-11-561-2011
© Author(s) 2011. CC Attribution 3.0 License.
Natural Hazards
and Earth
System Sciences
Critical analysis of the electrostatic turbulence enhancements
observed by DEMETER over the Sichuan region during the
earthquake preparation
T. Onishi1, J.-J. Berthelier1, and M. Kamogawa2
1LATMOS/IPSL, CNRS-UVSQ-UPMC, 11 Bd d’Alembert, 78280 Guyancourt, France
2Department of Physics, Tokyo Gakugei University, 1-1 Nukuikita-machi 4, Koganei-shi, Tokyo 184-8501, Japan
Received: 15 November 2010 – Revised: 11 January 2011 – Accepted: 17 January 2011 – Published: 21 February 2011
Abstract. In this paper, we report initial results from a
de-tailed statistical study of the plasma waves observed by the DEMETER satellite over the Sichuan region during a pe-riod of 20 days encompassing the large earthquake of mag-nitude M = 7.9 that occurred on 12 May 2008. The main objective of this paper is to present a statistical method to process and analyze plasma wave data and assist in detect-ing possible earthquake precursors among larger irregular disturbances arising from the natural variability of the ion-ized environment of the Earth. This method, presently used for dayside observations, involves two stages. First, VLF wave spectra are processed to recognize the various types of plasma waves usually observed at mid and low latitudes and derive a reduced number of parameters that fully char-acterize these emissions and may be conveniently used for a detailed statistical study. In a second stage, we perform a statistical analysis of the results by taking into account two “reference zones” displaced respectively 30◦ eastward and westward from the “epicentre zone”. Plasma and wave disturbances possibly induced by earthquakes in preparation are likely to maximize close to the “epicentre” zone, while natural disturbances associated, in particular, with the vary-ing magnetic activity are rather uniform over a wider longi-tude sector, thus enabling the use of observations over the reference zones as a base line. The initial results of this study show a deviation of the power spectrum of electro-static turbulence in the epicentre zone about 6 days prior to the earthquake but no significant anomalous variations can
Correspondence to: T. Onishi
be observed on other characteristics of plasma waves. From the analysis of the data over the two reference zones and us-ing recently produced sector magnetic activity indices, we conclude that the enhancement of electrostatic turbulence is associated with magnetospheric processes rather than with pre-seismic activity.
1 Introduction
An earthquake of magnitude M = 7.9 occurred at 14:28:01 CST (China Standard Time) with the epicen-tre located at 103◦longitude and 31◦latitude and at a depth
of 19 km close to the town of Chengdu in the Sichuan region of China. This event triggered a number of studies to investigate the possible existence of seismic precursors. The search for pre-seismic electromagnetic phenomena is not a new field since a first scientific paper may be traced back to the end of 19th century (Milne, 1890).
Over the last 30 years, numerous studies have been de-voted to the search for ionospheric disturbances possibly triggered by pre-seismic processes in the lithosphere. Pre-seismic atmospheric-ionospheric anomalies as well as tel-luric current and ultra-low frequency electromagnetic waves have been reported (see Pulinets and Boyarchuk, 2004; Kamogawa, 2006; Uyeda et al., 2009). These pre-seismic ionospheric and sub-ionospheric anomalies were reported initially by Antselevich (1971) and Gohkberg et al. (1989) using transmission observation of VLF electromagnetic waves propagating trough the earth-ionosphere waveg-uide. Hayakawa et al. (2010) showed statistically signifi-cant VLF/LF sub-ionospheric propagation anomalies before
M ≥6.0 shallow earthquakes in their 7-year observation. From the VHF transmission observation, the atmospheric anomalies before earthquakes were statistically verified by Fujiwara et al. (2004). Liu et al. (2000) investigated the rela-tionship between large earthquakes and ionospheric anoma-lies in the region of Taiwan using ionospheric critical plasma frequency, foF2, obtained from an ionosonde measurement. It was observed that foF2, corresponding to the electron den-sity in the F2 layer, significantly decreased in the afternoon during a few days before M ≥ 6 earthquakes, such as dur-ing 3 ∼ 4 days before M = 7.7 Taiwan Chi-Chi earthquake on 21 September 1999. Similar electron density depression above Taiwan Island was observed by the GPS total electron contents (TEC) (Liu et al., 2001). From such observations, Liu et al. (2006) constructed quantitative criteria for iono-spheric anomalies and established the statistical correlation between Taiwan M ≥ 5 earthquakes and ionospheric anoma-lies. The statistical results indicated that anomalies clearly appeared within 5 days before earthquakes. Recent statistical achievements seem to be highly encouraging for promoting further studies on the pre-seismic lithosphere-atmosphere-ionosphere (LAI) coupling (see Kamogawa, 2006). The oc-currence rate of M7-class earthquakes is about 20 times per year all over the world and this renders advantageous satel-lite observations because of the capability of covering all seismic regions for the statistical investigation of pre-seismic LAI coupling. Many satellites have been launched in search of pre-seismic ionospheric anomalies (see Pulinets and Bo-yarchuk, 2004).
DEMETER is the first micro-satellite dedicated to search-ing and identifysearch-ing disturbances of plasma and waves in the ionosphere that may be triggered by seismic activity (Parrot et al., 2006). Launched on 29 June 2004, on a 98◦
inclina-tion, nearly helio-synchronous orbit at an altitude of 715 km, DEMETER has provided a nearly continuous survey of the ionospheric plasma and plasma waves over two local time sectors 09:00–10:30 LT and 21:00–22:30 LT since Septem-ber 2004 over a period of more than 6 years until the end of the mission in December 2010. In our study we have used frequency power spectra of the ELF/VLF (∼20 Hz–20 kHz) electric field component perpendicular to orbit plane com-puted on-board from the measurements of the ICE instrument (Berthelier et al., 2006).
In the first section we briefly describe the automatic method used to process the VLF spectra developed to enable an accurate characterization of plasma waves and their sta-tistical study. Then we present the data related to the period encompassing the Sichuan EQ and in the final section we de-scribe the improved statistical method set-up to analyze the observations using results from 6 years of nearly continu-ous survey by DEMETER over a wide zone encompassing the Sichuan region. The electrostatic turbulence displays an anomalous behaviour over the epicentre region 6 days before the EQ but other plasma waves do not display any significant deviation from their average variation. In the last section of
our conclusion, the possible coupling between seismic ac-tivity and ionospheric turbulence is discussed and we briefly indicate our ongoing studies in this area.
2 VLF plasma wave automatic characterisation
Several recent studies based on DEMETER data have fo-cused on the analysis of plasma waves, e.g. Nemec et al. (2008), Molchanov et al. (2006) and Boudjada et al. (2008). Due to the variable conditions of occurrence of earthquakes and to the small amplitude of seismo-electromagnetic effects, it was not possible up to now to rec-ognize specific wave disturbances associated with individual events.
Results from Nemec et al. (2008) appear the most con-vincing at the moment and were based on a thorough statis-tical analysis of ∼3000 EQ by sorting the intensity of nat-ural waves in 10 frequency bands. However, a significant improvement in such statistical studies and in their interpre-tation would certainly be achieved if natural emissions (elec-trostatic turbulence, electromagnetic hiss, etc) could first be recognized and the statistical study performed on a reduced set of representative parameters that fully characterize each of them, such as the frequency band, the frequency of maxi-mum power, the total power, etc.
Indeed, sorting wave data by frequency only and making statistics irrespective of the position of the EQ result in the mixing of several types of natural emissions that may have totally different origin and propagation conditions. As an ex-ample, in the frequency interval of a few hundred Hz to a few kHz, two main emissions are observed at mid and low latitudes (i) ELF plasmaspheric hiss, originating from wave-particle interactions near the equatorial plasmapause at 4–6 Earth radii altitudes, and (ii) whistlers, emitted by lightning currents in tropospheric thunderstorms close to the satellite ground track or in the conjugate area. It cannot be expected that a physical process associated with seismic activity may have a similar effect on hiss and whistlers, owing to their different sources and propagation paths. In addition, hiss emissions in the ordinary mode are controlled by the local H+ gyro-frequency fH+ with their intensity peaking close
to fH+and decreasing very sharply until the cross-over
fre-quency fcoabout 60 to 100 Hz below. Below fcoand down to ∼150 Hz and depending on the local ionospheric plasma con-ditions, hiss can propagate in the extraordinary mode, most often with much less intensity than in the ordinary mode. At DEMETER altitudes, fH+ varies from ∼400 Hz at equator
to ∼600 Hz at 60◦latitude. Consequently, waves observed close to an epicentre at 500 Hz may be either above or below
fco and propagate in the ordinary or extraordinary modes,
depending on the EQ latitude and longitude. Since statisti-cal studies have to use a superposed epoch method on many earthquakes (EQ) spread over ±40◦in latitude, one should
T. Onishi et al.: Critical analysis of the electrostatic turbulence enhancements 563 sort wave emissions by their origin (whistlers, hiss) and
prop-agation mode before performing a statistical study.
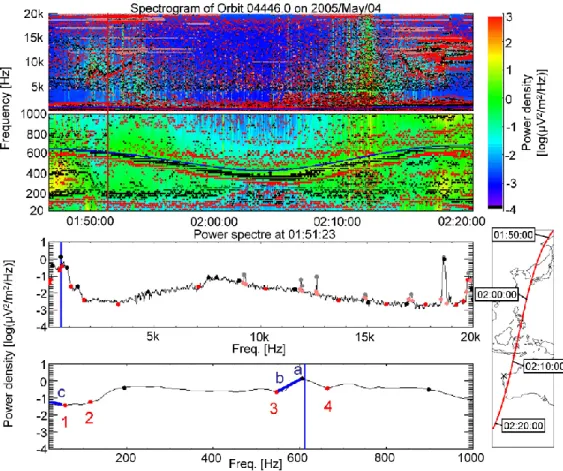
In our study we have used the on-board calculated (20 Hz– 20 kHz) VLF power spectra averaged over ∼2 s since they are available both in Burst and Survey modes. This anal-ysis has first been performed for dayside data since natural emissions such as ordinary and extraordinary hiss, whistlers etc. are more clearly distinguishable. The same work is being performed for night data. In the first stage we have developed a method to automatically identify plasma wave emissions and characterize them by a reduced set of parameters such as the frequency band, the frequency of maximum power, the total power, etc. The method has been described in detail by Onishi and Berthelier (2010) and it will be briefly summa-rized here. Basically, the shape of each VLF power spectrum is described by a number of characteristic points represent-ing local maxima, minima and discontinuities in the shape of the spectrum detected through local extrema of the second derivative of the power vs. frequency curve. A further pro-cessing of the characteristic points enables us to recognize and sort out the various natural emissions as well as the sig-nals from the ground based VLF transmitters. In addition, the power spectra can be approximated with very good accuracy by a simple linear interpolation between successive charac-teristic points. The total information on wave emissions is thus reduced to a small set of parameters that are used, in the second stage, to perform the statistical study. An example is shown in Fig. 1.
The following information can be simply extracted from the characteristic points. In order to define a frequency range of each type of emission, characteristic points of a positive 2nd derivative (red points in Fig. 1) are used with additional conditions specific to the emission.
(i) Ordinary hiss (O-hiss) defined by
– frequency and intensity of the peak hiss emission
close to fH+at point labelled a
– cross-over frequency fcoat point 3 and power index
(slope in frequency) above fcoand below the peak
emission in the frequency range indicated by the slope a–b
– frequency range above the peak emission and
av-erage power spectral index (slope in frequency). When calculating the upper frequency limit of or-dinary hiss the threshold on power was set at 0.3 µV2m−2Hz, the background level of ICE.
(ii) Extraordinary hiss (Ex-hiss) observed between points 2 and 3
– frequency range, peak frequency, total intensity
(iii) Electrostatic (ES) turbulence observed in the fre-quency range labelled c below the extraordinary hiss and down to the lowest frequency of the VLF spectrum
at 19.7 Hz and characterized by a negative power index (negative slope in frequency).
(iv) Whistler-type emissions are detected independently below and above fH+the occurrence of sporadic time
variations of the power intensity.
(v) VLF transmitter signals at 19.8 kHz from NWC with peak frequency, frequency band and total power, en-abling us in particular to study the signal’s broadening. Shown in Fig. 2 is an overview of the results for an entire orbit. In the top panel of the figure, characteristic points obtained from the automatic method are shown. Black and red dots correspond to negative and positive 2nd derivatives. In the bottom panel, peak power of the ordinary hiss indi-cated by red dots is determined from the characteristic points by selecting a local maximum nearest to the proton gyro-frequency fH+. The cross-over frequency is indicated by
pink dots and the proton gyro-frequency by a white line. In the same vein, the peak power of extraordinary hiss and elec-trostatic turbulence are recognized and indicated by blue and black dots, respectively. Whistler-type emissions are shown in white and treated separately from other emissions, even if some characteristic points relative to hiss emissions are de-tected inside the white parts of spectrogram.
3 Method of statistical analysis
One of the main difficulties in deciphering spacecraft obser-vations of plasma waves to detect possible pre-seismic ef-fects stems from the presence of natural emissions with large and very highly variable intensity. Except for whistlers gen-erated by thunderstorms, natural plasma waves are mainly controlled by ionospheric and magnetospheric processes as-sociated with auroral activity. The mid to low latitude ef-fects of auroral activity are fairly well represented by mag-netic activity indices such as Am (Menvielle and Berthelier, 1991), which may be used to evaluate, for each type of natu-ral plasma waves and for a given period and magnetic activ-ity, the statistical average intensity and the variability usually measured by the standard deviation. In principle, with the help of a large enough database and a thorough determina-tion of the statistical parameters, one should be able to assess the statistical significance of a deviation from the mean value that may be observed at time of seismic activity. However the variety and complexity of ionospheric, magnetospheric and auroral phenomena and, more importantly, their prolonged effects over hours and even days not taken into account when using “instantaneous” indices of magnetic activity, induce a noticeable uncertainty in such statistical results. To attempt to overcome this difficulty, or at least to lessen its effect, we have developed an improved method of analysis by perform-ing the same statistical study over two zones, West and East of the EQ zone, close enough to it but still far enough not to
Fig. 1. A spectrum with the characteristic points, fH+shown by the blue line. Characteristic points of positive 2nd derivative are numbered
in an order of increasing frequency.
Fig. 2. Characteristic points detected on an ICE VLF spectrogram (top) and selected characteristic points for specific plasma emissions
(bottom).
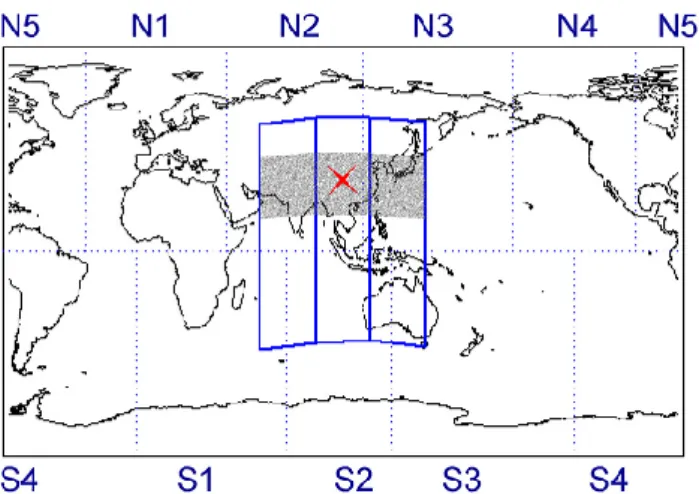
be affected by EQ-generated disturbances. These two zones, within the longitude ranges (58◦∼88◦) and (118◦∼148◦) respectively are considered as “reference zones” where the
natural emissions should behave similarly as those within the EQ zone in the longitude range (88◦∼118◦) and, in par-ticular display similar variations as a function of magnetic
T. Onishi et al.: Critical analysis of the electrostatic turbulence enhancements 565
Fig. 3. Longitude sectors of a λ indices and western, Sichuan and
eastern zones used for a statistical study. The epicentre is marked with a cross (x).
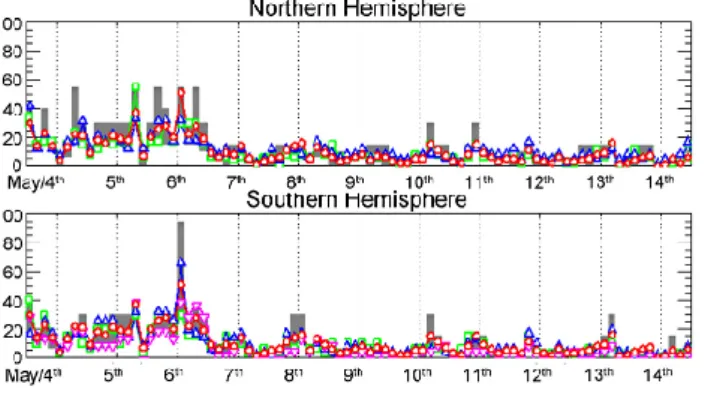
activity during the period of interest. In addition, we have also used the αλ longitude sector indices of magnetic activ-ity (Menvielle et al., 2011) because magnetic activactiv-ity may display marked variations in longitude. Each sector posi-tion is defined by an average longitude and an index at an intermediate longitude is linearly interpolated. As shown in Fig. 3, there are 5 sectors in the Northern and 4 in the South-ern Hemispheres.
4 Results 4.1 Overview
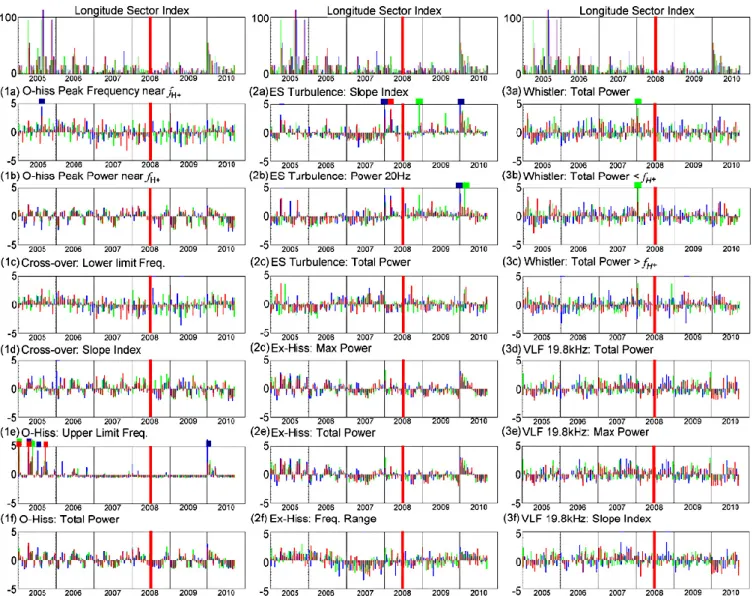
Figure 4 displays an overview of the main parameters that have characterized the various types of plasma waves in the ELF frequency range for 6 years of DEMETER operation, from 2005 to 2010, between 3 and 22 May in each year and for the western and eastern reference zones and the EQ zone. The Sichuan earthquake occurred on 12 May 2008 and is indicated by a vertical red line in each panel. To take into ac-count the dependence of magnetospheric phenomena on the Earth’s magnetic field, geomagnetic latitude is used instead of geographic latitude and, for each orbit, average values of the parameters are calculated over the geomagnetic latitudes (11◦∼31◦) that encompass the 21◦geomagnetic latitude of the epicentre. Average and standard deviation, σ , are calcu-lated in each zone for the whole set of data (i.e. for all years and all magnetic activities) and in each diagram the devia-tion from the mean value of the indicated parameter is plot-ted after normalization by σ . Data of the western, Sichuan and eastern zones are plotted in blue, red and green, respec-tively. When the deviation from the mean is greater than 4σ , a square symbol is placed above the data in the correspond-ing colour.
Several cases with deviations larger than 4σ are observed. In 2005 this was the case of the peak frequency in (Fig.4 1a)
and, more distinctly, of the upper frequency limit of the or-dinary hiss in (Fig.4 1e). These deviations are associated with large surges in magnetic activity associated with the magnetic storm in the second week of May 2005 and an ex-tended period of sporadic substorm activity observed during the third week. They fit well to the known variations of plas-maspheric hiss at time of large auroral activity. Similarly the surge of magnetic activity corresponding to the beginning of the new solar cycle in 2010 is marked by the increase of the upper frequency limit of the ordinary hiss and of the level of electrostatic turbulence as seen both on the slope index and on the power at 20 Hz.
Early in May 2008, a large increase in the total power of whistlers is observed. A closer examination of this event as a function of time and position shows an intensified power level at the high latitude border of the Sichuan and East ref-erence zones. This is better shown on the global map of the average total power of whistlers shown in Fig. 5. The power intensity above the NWC VLF transmitter on the northwest coast of Australia (slightly off to the north of the location of the transmitter due to the inclination of the Earth’s mag-netic field) is very large and concentrated. It is known that this region is subjected to heavy thunderstorm and lightning activity. In the northern conjugate region an increased in-tensity is also observed but distributed over a larger area. Since the total whistler power is calculated at frequencies below 10 kHz, these observations cannot stem from a par-asitic influence of the NWC emission at 19.8 kHz. Follow-ing Parrot et al. (2009), this observation can be explained by an enhanced transmission of whistler waves through the ionosphere above the NWC transmitter through filamentary structures generated by the interaction of high power VLF waves with the ionospheric plasma.
Finally, on 3 and 6 May 2008, large deviations of two pa-rameters related to electrostatic turbulence were observed, a positive deviation > 4σ for the power index, thus a steepen-ing of the frequency spectrum and a positive deviation > 3σ for the power at 20 Hz, the two effects resulting in fact from an increase of the electrostatic turbulence intensity at 20 Hz. One of the physical mechanisms could be suggested to ex-plain the occurrence of seismic precursors in the ionosphere as the development of a low intensity background of grav-ity or acoustic waves generated during the EQ preparation either through lithospheric processes in the fault or through surface effects. When propagating in the upper atmosphere, these waves interact with the ionospheric plasma and pro-duce field-aligned irregularities in the topside ionosphere, as was observed in the case of MSTID’s of meteorological ori-gin by Onishi et al. (2009). Such irregularities may be driven unstable by the convective motion of the plasma, leading to the development of electrostatic turbulence (ET) which may therefore be considered as a possible precursor signal in the ionosphere. We have paid a great attention to the ET disturbances observed on 6 May.
Fig. 4. Orbit average of plasma wave parameters determined from the ICE VLF spectrogram for 6 yr, 2005 to 2010, from 3 to 22 May in
each year. Data in the western, Sichuan and eastern zones are shown in blue, red and green, respectively. Data are normalized by the standard deviation σ calculated separately for each zone. Large deviations (> 4σ ) are indicated by a square symbol of the corresponding colour. The sector index is given in nT at the top of each column.
4.2 Electrostatic Turbulence (ET) variations
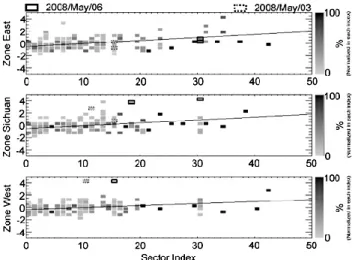
Since magnetic activity was slightly increased on 3 and 6 May compared to the neighbouring days, we investigated the statistical distribution of the values of the power index as a function of magnetic activity independently for the three zones. The results are plotted in Fig. 6.
In each zone, data from all 6 years are binned and counted in cells of 0.5σ of the variation and 1nT of the αλ lon-gitude sector index and the histograms are normalized for each value of sector index to give a distribution function in percentage at a given magnetic activity. Events on 3 and 6 May are indicated. Because of the reduced set of days with high enough magnetic activity, the average variations of the ET power index for magnetic activity above 20 nT are
characterized with a lower accuracy. Nevertheless, the power index appears to increase when magnetic activity is ≥20 nT in the Sichuan and eastern zones and ≥40 nT in the western zone. The linear fits also illustrate the increasing trend of the parameter.
The large deviations observed in the Sichuan and western zones on 6 May occur at local magnetic activity indices of 15 nT in the western zone, 15 nT and 30 nT in the Sichuan zone, and 30 nT in the eastern zone. The two activity lev-els for the Sichuan zone arise from the different position of the satellite orbit with respect to the boundary between the
αλindex sectors N2 and N3 in Fig. 3. The main informa-tion is that, on 6 May, the magnetic activity increased regu-larly from the western reference zone to the eastern reference
T. Onishi et al.: Critical analysis of the electrostatic turbulence enhancements 567
Fig. 5. Map of the total power of whistler emissions averaged over
6-yr all-year data. The epicentre of Sichuan earthquake is marked with a red cross.
Fig. 6. Statistical distribution of the power index of electrostatic
turbulence as a function of local magnetic activity derived from the
αλmagnetic indices. Data corresponding to the large deviations prior to the earthquake are marked by solid and dotted rectangles. Linear fits of data are superimposed.
zone. Similarly, on 3 May the large deviation corresponds to a magnetic activity of 10 nT in the western zone, 10 to 15 nT in the Sichuan zone and 15 nT in the eastern zone, and again magnetic activity was regularly increasing from west to east but at a slower pace than on 6 May.
To summarize, the event on 6 May is the largest one in the Sichuan zone with the deviation of ET > 4σ from its aver-age level in the Sichuan and western zone, but insignificant (< 1σ ) in the eastern zone. On 3 May, the deviation is > 4σ in the western zone, ∼ 2.5σ in the Sichuan zone and, again, insignificant on the eastern zone. One must be aware that the small number of observations at high magnetic activity (≥ 30 nT) induces a significant uncertainty in evaluating the
amplitude of the deviation in the eastern zone where mag-netic activity is always the highest (and ≥ 30 nT on 6 May). We focus in the following on the observations on 6 May. As a first conclusion, the deviation of ET is as large in the west-ern zone as in the Sichuan zone, contrary to what would be expected for a disturbance induced by seismic activity in the EQ region.
The study was then extended to the southern latitudes of the three zones as indicated in Fig. 3. Plotted in Fig. 7 is a synthetic colour coded representation of the whole set of ET power index measurements from 2005 to 2010 in the Sichuan zone and the two reference zones in the West and the East. The event of 6 May is clearly visible slightly south-ward of the epicentre and one can also observe, along the same orbit, a similar variation of the ET parameters at south-ern latitudes in the conjugate region of the ET enhancement in Sichuan zone. The intensity of the ET disturbance in the South is actually larger than in the Northern Hemisphere over the Sichuan region. The western reference zone displays a similar situation with a large deviation of the ET power index from its average value in the southern conjugate region, more intense and spread over a wider range of latitudes. The exis-tence of conjugate ET disturbances can be explained by the strong electrical coupling between the northern and south-ern ionospheres. Nevertheless, the existence of disturbances with a maximum intensity in the Southern Hemisphere can-not be expected if the source is in the opposite hemisphere, associated with the Sichuan EQ.
The presence of ET disturbances of similar intensity in the western reference zone compared to the Sichuan zone and the observation of higher intensity ET disturbances in the southern conjugate area of the western and Sichuan regions suggest that the ET event are due to ionospheric and mag-netospheric processes associated with a surge of magnetic activity. This is supported by data shown in Fig. 8, where the variations of the αλ longitude sector indices from 4 to 14 May have been plotted. The surge in magnetic activity on 5 and 6 May is clearly visible in both hemispheres. More im-portantly, the Southern Hemisphere diagram definitely shows the occurrence of a very large spike of magnetic activity in the 00:00–03:00 UT time interval on 6 May, coincident with the DEMETER orbits over the Sichuan and West zones at 01:00 UT and 03:00 UT respectively. This is a rather unusual dissymmetrical enhancement of magnetic activity that natu-rally explains the higher intensity and wider domain of oc-currence of the ET disturbance in the Southern Hemisphere.
5 Conclusions
We have performed a detailed statistical study to search for possible anomalous variations in the VLF natural emissions observed onboard DEMETER over the Sichuan region dur-ing a 20 day period encompassdur-ing the Great Sichuan earth-quake on 12 May 2008. In the first stage, the raw spectral
Fig. 7. All original data of power index of electrostatic turbulence used in this statistical study from year 2005 to year 2010. The data are
sorted along three zones, the Sichuan zone (central column) and the two reference zones west (left) and east (right) to the Sichuan zone. In each column, geomagnetic latitudes are on the x-axis, positive in the Northern Hemisphere, negative in the Southern Hemisphere. For each year the time in days varies along the y-axis between 3 and 22 May. The time and geomagnetic latitude of the Sichuan EQ are indicated by horizontal and vertical red lines. The EQ geomagnetic latitude is indicated by a dotted red line in the reference zones. All earthquakes with
M ≥5 that occurred in these zones and periods are marked with circles, whose diameter is proportional to the magnitude.
data were processed to detect and characterize the different types of plasma waves usually observed at mid and low lati-tudes. Electrostatic turbulence, through its power spectral in-dex and its intensity at 20 Hz, has shown an anomalous vari-ation in time and space 6 days prior to the earthquake. In the second stage an improved statistical method has been devel-oped to search for a likely origin of these disturbances. Using nearly simultaneous observations over two reference zones west and east of the Sichuan zone and a finer representation of magnetic activity by means of longitude sector indices, we opt for the conclusion that all results are consistent with the
observed enhancement of electrostatic turbulence being gen-erated by magnetospheric processes that are at the origin of the surge of magnetic activity. These findings were obtained thanks to the new and improved statistical method of analysis that rely on reference zones and longitude sector magnetic in-dices and also to the very large database acquired by DEME-TER over 6 years of operation. They point out the significant difficulty and possible errors that can be made when assess-ing with less precaution the origin of disturbances observed during the preparatory phase of large earthquakes.
T. Onishi et al.: Critical analysis of the electrostatic turbulence enhancements 569
Fig. 8. αλ indices of magnetic activity in N2 (blue triangle) and
N3 (green square) in the Northern Hemisphere (top) and in S1 (blue triangle), S2 (green square) and S3 (purple inverse triangle) in the Southern hemisphere (bottom) in the period from 4 to 14 May. The ET disturbance recorded over the Sichuan region and its conjugate area occurs on 6 May. Range of indices are indicated in grey by maximum and minimum indices. Global am-index is plotted in red circles. Vertical dotted lines correspond to 00:00:00 UT of each day.
We are currently extending our analysis to the ionospheric plasma measurements provided by DEMETER during the same Sichuan period and to other large earthquakes observed during the DEMETER observation phase. The results will be reported in forthcoming papers.
Acknowledgements. This work was supported by CNES funding through grants from CNES-EU60015. This research was partially supported by the Ministry of Education, Science, Sports and Cul-ture (MEXT) of Japan, Grant-in-Aid for Young Scientists (B), No. 21710180, 2009 (MK) and under its Observation and Research Pro-gram for Prediction of Earthquakes and Volcanic Eruptions (MK), and Ito Science Foundation, 2007 (MK).
Edited by: C.-V. Meister
Reviewed by: two anonymous referees
The publication of this article is financed by CNRS-INSU.
References
Antselevich, M. G.: The influence of Tashkent earthquake on earth’s magnetic field and the ionosphere, Tashkent earthquake 26 April 1966, FAN publ., Tashkent, 187–188, 1971.
Berthelier, J.-J., Godefroy, M., Leblanc, F., Malingre, M., Men-vielle, M., Lagoutte, D., Brochot, J.-Y., Colin, F., Elie, F., Legen-dre, C., Zamora, P., Benoist, D., Chapuis, Y., Artru, J., and Pfaff,
R.: ICE, The electric field experiment on DEMETER, Planet. Space Sci., 54, 5, 456–471, 2006.
Boudjada, M. Y., Schwingenschuh, K., Biernat, H. K., Berthelier, J. J., Blecki, J., Parrot, M., Stachel, M., Aydogar, ¨O., Stangl, G., and Weingrill, J.: Similar behaviors of natural ELF/VLF ionospheric emissions and transmitter signals over seismic Adri-atic regions, Nat. Hazards Earth Syst. Sci., 8, 1229–1236, doi:10.5194/nhess-8-1229-2008, 2008.
Fujiwara, H., Kamogawa, M., Ikeda, M., Liu, J. Y., Sakata, H., Chen, Y. I., Ofuruton, H., Muramatsu, S., Chuo, Y. J., and Ohtsuki, Y. H.: Atmospheric anomalies observed dur-ing earthquake occurrences, Geophys. Res. Lett., 31, L17110, doi:10.1029/2004GL019865, 2004.
Gokhberg, M. B., Gufeld, I. L., Rozhnoy, A. A., Marenko, V. F., Yampolsky, V. S., and Ponomarev, E. A.: Study of seismic influ-ence on the ionosphere by super long-wave probing of the Earth ionosphere wave-guide, Phys. Earth Planet. In., 57, 1–2, 64–67, 1989.
Hayakawa, M. and Hobara, Y.: Current status of seismo-electromagnetics for short-term earthquake prediction, Geomat-ics, Natural Hazards and Risk, 1, 2, 115–155, 2010.
Hayakawa, M., Kasahara, Y., Nakamura, T., Muto, F., Horie, T., Maekawa, S., Hobara, Y., Rozhnoi, A. A., Solovieva, M., and Molchanov, O. A.: A statistical study on the correlation be-tween lower ionospheric perturbations as seen by subionospheric VLF/LF propagation and earthquakes, J. Geophys. Res., 115, A09305, doi:10.1029/2009JA015143, 2010.
Kamagowa, M.: Preseismic lithosphere-atmosphere-ionosphere coupling, Eos, 87, p. 417, p. 424, 2006.
Liu, J. Y., Chen, Y. I., Pulinets, S. A., Tsai, Y. B., and Chuo, Y. J.: Seismo-ionospheric signatures prior to M ≥ 6.0 Taiwan earth-quakes, Geophys. Res. Lett., 27, 3113–3116, 2000.
Liu, J. Y., Chen, Y. I., Chuo, Y. J., and Tsai, H. F.: Variations of ionospheric total electron content during the Chi-Chi earthquake, Geophys. Res. Lett., 28, 1383–1386, 2001.
Liu, J. Y., Chen, Y. I., Chuo, Y. J., and Chen, C. S.: A statistical investigation of preearthquake ionospheric anomaly, J. Geophys. Res., 111, A05304, doi:10.1029/2005JA011333, 2006.
Menvielle, M. and Berthelier, A.: The K-derived planetary indices: description and availability, Rev. Geophys. Space Phys., 29, 415– 432, 1991.
Menvielle, M., Iyemori, T., Marchaudon, A., and Nose, M.: Ge-omagnetic Indices, in: GeGe-omagnetic Observations and Models (IAGA Special Sopron Book Series, vol. 5), 1st edition, edited by: Mandea, M. and Korte, M., Springer Science+Business Me-dia, Heidelberg, 183–228, 2011.
Milne, J.: Earthquakes in connection with electric and magnetic phenomena, Trans. Seismol. Soc. Japan, 15, 135 pp., 1890. Molchanov, O., Rozhnoi, A., Solovieva, M., Akentieva, O.,
Berthe-lier, J. J., Parrot, M., Lefeuvre, F., Biagi, P. F., Castellana, L., and Hayakawa, M.: Global diagnostics of the ionospheric perturba-tions related to the seismic activity using the VLF radio signals collected on the DEMETER satellite, Nat. Hazards Earth Syst. Sci., 6, 745–753, doi:10.5194/nhess-6-745-2006, 2006. Nemec, F., Santolik, O., Parrot, M., and Berthelier, J. J.:
Spacecraft observations of electromagnetic perturbations con-nected with seismic activity, Geophys. Res. Lett., 35, L05109, doi:10.1029/2007GL032517, 2008.
Nemec, F., Santolik, O., and Parrot, M.: Decrease of intensity
of ELF/VLF waves observed in the upper ionosphere close to earthquakes: A statistical study, J. Geophys. Res., 114, A04303, doi:10.1029/2008JA013972, 2009.
Onishi, T. and Berthelier, J.-J.: Synthetic characterization of VLF electric field spectra from the ICE experiment on DEMETER: Automatic recognition and characterization of natural and man made emissions, Notes du pˆole de plan´etologie, n. 21, June 2010. Onishi, T., Tsugawa, T., Otsuka, Y., Berthelier, J.-J., and Lebreton, J.-P.: First simultaneous observations of daytime MSTIDs over North America using GPS-TEC and DEMETER satellite data, Geophys. Res. Lett., 36, L11808, doi:10.1029/2009GL038156, 2009.
Parrot, M., Berthelier, J. J., Lebreton, J. P., Sauvaud, J. A., San-tol´ık, O., Blecki, J.: Examples of unusual ionospheric obser-vations made by the DEMETER satellite over seismic regions, Phys. Chem. Earth, 31, 486–495, doi:10.1016/j.pce.2006.02.011, 2006.
Parrot, M., Inan, U. S., Lehtinen, N. G., and Pinc¸on, J. L.,: Pen-etration of lightning MF signals to the upper ionosphere over VLF ground-based transmitters, J. Geophys. Res., 114, A12318, doi:10.1029/2009JA014598, 2009.
Pulinets, S. and Boyarchuk, K.: Ionospheric Precursors of Earth-quakes, Springer, 316 pp., 2004.
Uyeda, S., Kamogawa, M., and Nagao, T.: Electromagnetic sig-nals of Earthquakes, Complexity in Earthquakes, Tsunamis, and Volcanoes, and Forecasting and Early Warning of their Haz-ards, edited by: William, H. K. L., Series of Encyclopedia of Complexity and System Science, Meyers, R. (Editor-in-Chief), Springer, 2621–2635, 2009.
Uyeda, S. , Nagao, T., and Kamogawa, M.: Short-term earthquake prediction: current status of seismo-electromagnetics, Tectono-physics, 470, 205–213, doi:10.1029/2009JA015143, 2009.