HAL Id: hal-01694400
https://hal.univ-reims.fr/hal-01694400v2
Submitted on 5 Mar 2018
HAL is a multi-disciplinary open access
archive for the deposit and dissemination of
sci-entific research documents, whether they are
pub-lished or not. The documents may come from
teaching and research institutions in France or
abroad, or from public or private research centers.
L’archive ouverte pluridisciplinaire HAL, est
destinée au dépôt et à la diffusion de documents
scientifiques de niveau recherche, publiés ou non,
émanant des établissements d’enseignement et de
recherche français ou étrangers, des laboratoires
publics ou privés.
Hierarchical extraction of landslides from
multiresolution remotely sensed optical images
Camille Kurtz, André Stumpf, Jean-Philippe Malet, Pierre Gançarski, Anne
Puissant, Nicolas Passat
To cite this version:
Camille Kurtz, André Stumpf, Jean-Philippe Malet, Pierre Gançarski, Anne Puissant, et
al..
Hierarchical extraction of landslides from multiresolution remotely sensed optical
im-ages.
ISPRS Journal of Photogrammetry and Remote Sensing, Elsevier, 2014, 87, pp.122-136.
Hierarchical extraction of landslides from multiresolution
remotely sensed optical images
Camille Kurtza,∗, André Stumpfb,c,∗, Jean-Philippe Maletb, Pierre Gançarskid, Anne Puissantc, Nicolas Passate aLIPADE, Université Paris Descartes, France
bIPGS, Université de Strasbourg, CNRS, France cLIVE, Université de Strasbourg, CNRS, France dICube, Université de Strasbourg, CNRS, France eCReSTIC, Université de Reims Champagne-Ardenne, France
Abstract
The automated detection and mapping of landslides from Very High Resolution (VHR) images present several chal-lenges related to the heterogeneity of landslide sizes, shapes and soil surface characteristics. However, a common geomorphological characteristic of landslides is to be organized with a series of embedded and scaled features. These properties motivated the use of a multiresolution image analysis approach for their detection. In this work, we propose a hybrid segmentation/classification region-based method, devoted to this specific issue. The method, which uses im-ages of the same area at various spatial resolutions (Medium to Very High Resolution), relies on a recently introduced top-down hierarchical framework. In the specific context of landslide analysis, two main novelties are introduced to enrich this framework. The first novelty consists of using non-spectral information, obtained from Digital Terrain Model (DTM), as a priori knowledge for the guidance of the segmentation/classification process. The second novelty consists of using a new domain adaptation strategy, that allows to reduce the expert’s interaction when handling large image datasets. Experiments performed on satellite images acquired over terrains affected by landslides demonstrate the efficiency of the proposed method with different hierarchical levels of detail addressing various operational needs.
Keywords: landslide mapping, VHR images, multiresolution region-based analysis, hierarchical approach, binary
partition tree, domain adaptation
1. Introduction 1.1. Context
In the field of Earth observation, a new generation of sensors with meter and sub-meter resolution has led to an increased production of Very High Resolution (VHR) optical images (Benediktsson et al.,2012), and to improved op-erational capabilities for monitoring geohazards. Especially, several studies demonstrated that such kind of imagery enables to inventory and delineate landslide-affected areas (Nichol and Wong,2005;Barlow et al.,2006;Martha et al.,
2010;Mondini et al.,2011;Stumpf and Kerle,2011), providing valuable information for the estimation of potential risks to infrastructures and human lives. Comprehensive landslide inventory maps should ideally also provide infor-mation about the respective sub-parts of each single landslide which are often characterized by different kinematic patterns. Such type of spatial information on landslide sub-units is of paramount importance for quantitative hazard assessments (Thiery et al.,2007) and the identification of landslide that are more prone to imminent acceleration or fluidization (Raucoules et al.,2013). VHR satellite images contain sufficient spatial details to depict small geomor-phological surface features such as faults, scarps, fissures, rock blocks and lobes, and should in principle also enable an ∗Camille Kurtz and André Stumpf are considered as equal first authors of this manuscript. Corresponding author: Camille Kurtz. Tel.: +33
(0)1.83.94.58.07, Fax: +33 (0)1.83.94.58.07.
Email addresses: [email protected](Camille Kurtz), [email protected] (André Stumpf), [email protected](Jean-Philippe Malet), [email protected] (Pierre Gançarski),
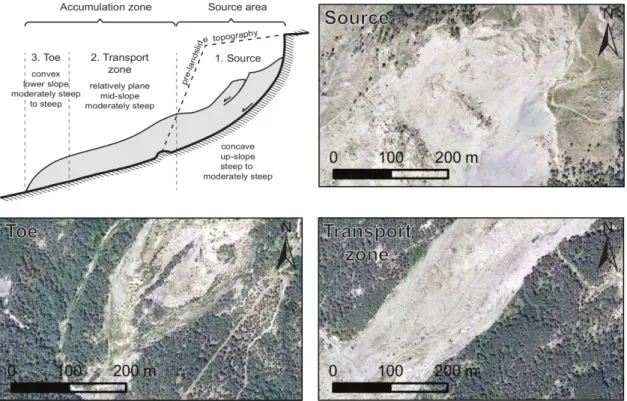
Figure 1: Schematic partition of a landslide into sub-units (source area, transport area and toe) and their typical geomorphological features. The image depicts the distinguished sub-units on an aerial photograph (50 cm, © IGN, 2008) and shows the heterogeneous surfaces including deformation features such as fissures and different sizes of rock blocks.
This example illustrates that geomorphological definitions do not correspond directly to spectrally homogeneous areas depicted in the remote sensing images.
analysis at the level of sub-parts composing a landslide. However, established concepts of landslide geomorphology, such as a first order differentiation between source area, transport area and toe (Figure1), do not directly correspond to spectrally homogeneous pixels or regions in VHR images. Indeed, the different sub-parts appear heterogeneous as they generally contain different kinds of basic elements with a specific spatial organization (e.g., different kinds of fissures, different sizes and shapes of rock blocks, etc.). Consequently, by opposition to lower resolution images (Yilmaz,2009;Kayastha et al.,2013), landslides can be considered as hierarchies of complex patterns composed by sub-objects of interest. One may notice that the conceptual model in Figure1allows us to identify potentially useful features (e.g., slope gradient, slope curvature, differences in altitude) to distinguish the different landslide sub-parts.
Due to the expanding fleet of VHR optical satellites such as the French PLEIADESconstellation (de Lussy et al.,
2005), the challenges associated with VHR images are gaining increasingly greater importance in the context of
landslide mapping (Guzzetti et al.,2012). On the one hand, the size and the complexity of the images make the visual analysis a time consuming and error prone task (Galli et al.,2008;Fiorucci et al.,2011). On the other hand, state-of-the-art image analysis tools, which are usually considered for the mapping of landslides from lower resolution images, rely on radiometric homogeneous hypotheses of the landslides represented in the images. Consequently, these tools
cannot handle the new levels of spatial details provided by VHR images (Blaschke,2010). Therefore, new image
analysis methodologies have to be proposed for the hierarchical mapping of landslides from VHR optical satellite images.
1.2. Related works
In this context, various region-based approaches have been proposed to automate the extraction of landslides from VHR images (Barlow et al.,2006;Martha et al.,2010; Lu et al.,2011; Stumpf and Kerle,2011;Lahousse et al.,
textural information (Townshend et al.,2000;Mallinis et al.,2008), region-based approaches enable to consider high-level (e.g., contextual, geometrical) features to describe the objects to be classified. Indeed, region-based approaches enable to transfer high-level knowledge in computer-accessible features leading to discriminatory decision sets. Such
decision sets have been employed for the mapping of landslides from HR (Martha et al.,2010) and multi-temporal
VHR images (Lu et al.,2011).Stumpf et al.(2013) have also proposed a supervised framework to automatically select discriminative features among a multitude of potentially useful ones. Nevertheless, most of the proposed approaches do not consider the hierarchical organization of the objects of interest (Benz et al.,2004), that is a serious drawback when dealing with VHR optical satellite images.
To tackle this issue, two key-concepts can be considered: using multiple images, and using multiple spatial res-olutions. On the one hand, multiple images provide complementary information, that can enrich each other. This is specifically true in the case where such images gather different radiometric values, that then carry various semantic information. On the other hand, using images at multiple spatial resolutions provides hierarchical links between their respective radiometric information. (In particular, the availability of a large range of spatial resolutions, from Medium Spatial Resolution (MR, 30–5 m) to VHR images, has already led to methods for the extraction of hierarchical pat-terns (Akcay and Aksoy,2008;Wemmert et al.,2009;Gaetano et al.,2009).) These considerations motivate our use of multiple images at multiple spatial resolutions (Chang et al.,2007). In particular, we propose to take advantage of this potential spatial (Sun et al.,2003) and radiometric enrichment to propose a multiresolution representation of the data, leading to a hierarchical unsupervised region-based approach.
1.3. Contributions
Based on these considerations, a top-down hierarchical region-based framework has been recently proposed by
Kurtz et al.(2012) to segment and classify multiresolution images from the lowest to the highest resolution, and then finally extract complex patterns from VHR images. This top-down hierarchical approach (TDHA) constitutes a generic and versatile framework. In this work, we propose to adapt and improve it, in order to efficiently deal with the case of landslide mapping from remote sensing imagery.
From a methodological point of view, our contributions are twofold. Firstly, we propose to integrate topographic and morphometric a priori knowledge derived from non-spectral data, namely Digital Terrain Model (DTM), for guiding the segmentation/classification process. This strategy has shown promising results in the context of mapping shallow landslides with pixel-based approaches (Mondini et al.,2013). In our approach, this knowledge is used for the construction of the hierarchical image representation data structure, namely a binary partition tree (BPT) (Salembier and Garrido, 2000) considered for the segmentation. It is also used to enrich the feature space in the context of a multiresolution classification procedure (Kurtz et al.,2010). This enriched TDHA is described in Subsection2.1. Secondly, we propose a new strategy that allows to reduce the experts’ interaction when handling large image datasets. Indeed, the proposed TDHA uses experts’ knowledge via the interactive definition of segmentation examples for each
semantic class, and at each resolution. Based on the domain adaptation paradigm (Daumé III and Marcu, 2006),
whose relevance has already been proved for classification of satellite images (Bruzzone et al.,1999;Bahirat et al.,
2012), we propose a strategy that enables to reduce a minima the error-prone and time-consuming task that consists
of providing segmentation examples. This domain adaptation strategy is described in Subsection2.2.
From an applicative point of view, the proposed method has been used for analysing multiresolution image datasets and map different landslide sub-units. These experiments, described in Section3, demonstrate the efficiency of the proposed method with different hierarchical levels of detail, addressing various operational needs.
To the best of our knowledge, this work constitutes the first application of a top-down hierarchical strategy, dealing with multiresolution images, for landslides monitoring purpose.
2. Methodology
This section presents the proposed workflow for the segmentation/classification of landslides from multiresolution satellite images. Subsection2.1provides a description of the TDHA, and how it is enhanced by integrating
morphome-tric a priori knowledge derived from DTM. Subsection2.2details the proposed domain adaptation strategy enabling
to use the knowledge learned on a reference source dataset to automatically process another dataset representing the same type of objects.
Example-based hierarchical segmentation Multiresolution clustering 1 1 1 2 Output Process SegmentationIS1 Input Step 1 Step 2 Step n resolution rImage I 1 1 resolution rImage I 2 2 resolution rImage I n n Example-based hierarchical segmentation Example-based hierarchical segmentation Example-based hierarchical segmentation Example-based hierarchical segmentation Example-based hierarchical segmentation Example-based hierarchical segmentation Clusters projection 3 Multiresolution information SegmentationIS2 SegmentationISn Clusters projection 3 ClassificationIC1 Multiresolution clustering 2 Multiresolution clustering 2 ClassificationIC2 Multiresolution information
Clusters obtained
Clusters obtained
ClassificationIC1
ClassificationIC2
ClassificationICn
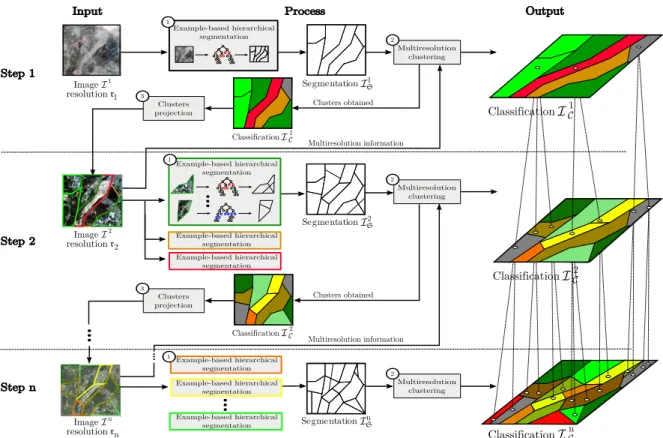
Figure 2: Workflow overview of the proposed TDHA (see text).
2.1. Top-down hierarchical approach for segmentation/classification of landslide multiresolution images
The proposed TDHA, summarized in Figure2, takes as input a multiresolution set ofn imagesI1, . . . ,In (in
our case,n = 3 images are considered: one MR, one HR and one VHR image). It provides as output n
segmenta-tion/classification maps computed using a top-down strategy. It performsn successive steps (one per spatial resolution image). Each step is composed of:
• an example-based hierarchical segmentation (see Figure2-¬, and Subsection2.1.1); • a multiresolution clustering (see Figure2-, and Subsection2.1.2).
This approach is mainly based on an iterative decomposition strategy: at each resolution/step, the output is embedded into the next resolution image to be processed as input of the next step (see Figure2-®).
2.1.1. Example-based hierarchical segmentation
Overview. The segmentation of a satellite image is a complex task since the different objects of interest do not
necessarily share the same spatial scale. To deal with this issue, the segmentation step is divided intok different sub-steps, applied independently to a group of similar thematic ground areas (k is set by the expert and corresponds to the number of thematic ground areas extracted by the multiresolution clustering approach from the previous resolution image, see Subsection2.1.2).
Each sub-step requires a segmentation example interactively defined by the expert (Figure2-¬). Segmentation
is performed by using a hierarchical strategy based on Binary Partition Trees (BPTs) (Salembier and Garrido,2000;
Salembier and Wilkinson,2009;Valero et al.,2010;Benediktsson et al.,2011;Alonso-González et al.,2012). Thus, defining a segmentation example consists of providing a cut of the BPT. To this end, a software has been designed to visualize the segmentation results for different cuts in real-time (see Subsection3.2). The expert can interactively
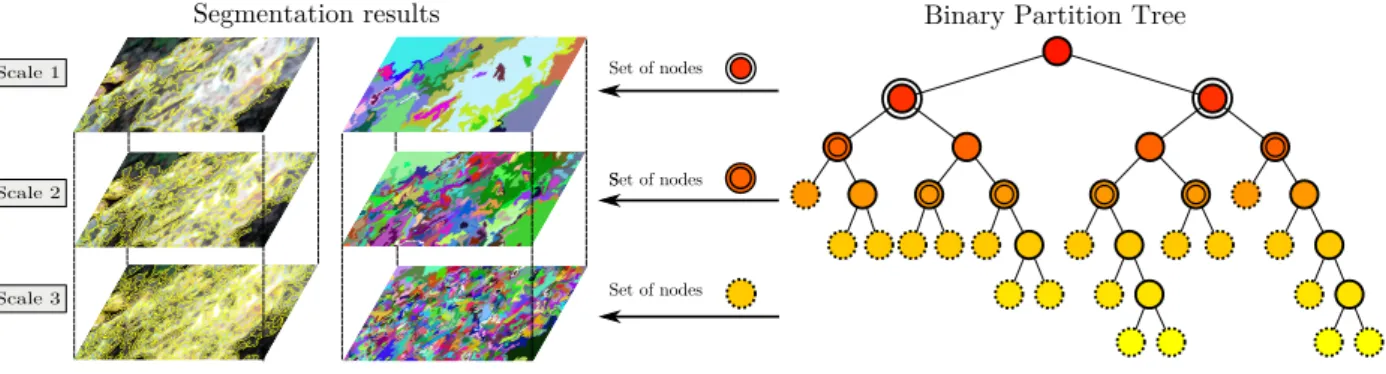
Binary Partition Tree Segmentation results Set of nodes SSet of nodes Set of nodes Scale 1 Scale 2 Scale 3
Figure 3: An example of BPT associated to an HR image (the number of nodes is significantly reduced, for sake of readability). The nodes of the tree are depicted by color disks (the root is the highest node). The colors of the nodes (from yellow to red) symbolize the decrease of the similarity measure Orbetween two neighboring regions (and thus, also the decrease of the function α controlling the trade-off between Orand Og). For the
sake of visualization, three partitions associated to three cuts of the BPT are depicted.
parse the tree to select a set of nodes producing the required tree-cut example (Figure3). The experts’ behavior is then learned. More precisely, a tree-cut example is represented by a set of centroids (modeled by color histograms and spatial features) using a clustering algorithm. This example is automatically reproduced in the similar thematic ground areas of the image by using a cutting strategy that processes all the associated BPTs.
Technical description.
Building a BPT: The BPT of a multivalued imageI : E → V with B spectral bands Vb, is built in a bottom-up
approach (i.e., from its leaves to its root). The leaves of the tree are composed by the regions belonging to the initial partition. Practically, the initial partition ofE is generally composed by the flat zones ofI. The remaining nodes are obtained by successively merging couples of (already defined) nodes of the tree. Such couples of nodes are generally chosen as spatially adjacent, thus leading to a partition ofE. The root node represents the entire image support E.
A huge number of distinct BPTs may be obtained for a same initial partition ofE. In order to decide which BPT
is the most relevant, it is then necessary to define the priority of the fusions between nodes. A BPT generation then relies on two main notions: a region model (which specifies how regions are characterized), and a merging criterion (which defines the similarity of neighboring regions and thus the merging order).
The basic models and criteria used in most image segmentation approaches generally rely on radiometric
homo-geneity hypotheses (Garrido et al.,1998). Such models are well adapted to process MR images, but when dealing
with VHR images, other geometric and/or spatial features require consideration. Morphological features related to the sensed ground surface, can provide relevant information for the delineation of the landslides and their sub-parts.
They can be obtained from DTM and are typically linked with distinct geomorphological processes (Anders et al.,
2011). Morphological features such as the slope and the curvature of the regions (see Figure1) can be considered to characterize the nodes during the construction of the BPT.
We propose to rely on both the increase of the ranges of the intensity values (for each spectral band) and on the morphological features of the regions in order to merge in priority objects composing the landslide sub-parts. In the sequel, the chosen region model and merging criterion are defined.
Region model: A node/regionRi⊆ E is modeled here by a couple of values
Mr(Ri) =h(v−b(Ri), vb+(Ri))iBb=1 (1)
Mg(Ri) = (slop(Ri), curv(Ri)) (2)
wherev?
b provides the extremal values for theb-th spectral band inI, while slop and curv are functions providing
the slope and the curvature, respectively. Broadly speaking,MrandMgprovide (low-level) spectral and geometrical
information. During the merging process, the region model of two merged regionsRiandRjis then provided by
Mr(Ri∪ Rj) =h(min{vb−(Ri), v−b(Rj)}, max{vb+(Ri), v+b(Rj)})iBb=1 (3)
WhileMris derived directly from the image, values for the slopeslop and the curvature curv are obtained as the first
and the second order derivatives of a DTM representing the topographic surface. (Further details on the computation of the derivatives from the DTM at different spatial scales are provided in Subsection3.1.2.)
Merging criterion: At each step, the algorithm determines the pair of most similar connected regions minimizing the increase of the ranges of the intensity values (for each spectral band) and having similar morphological properties. This leads to the following merging criteria
Or(Ri, Rj) = 1 B B X b=1 max{v+ b (Ri), v+b(Rj)} − min{v−b(Ri), vb−(Rj)} v+ b(E)− v − b (E) (5) Og(Ri, Rj) = 1
2(|slop(Ri)− slop(Rj)| + |curv(Ri)− curv(Rj)|) (6)
The similarity measure between two neighboring regionsRiandRjare then computed as:
O(Ri, Rj) = α.Or(Ri, Rj) + (1− α).Og(Ri, Rj) (7)
withα∈ [0, 1], where Or(Ri, Rj) and Og(Ri, Rj) have been normalized. In practice, the closer the nodes are to the
root, the less relevantOris. Consequently, the weightα can be defined as a function depending directly on the value
ofOr(and decreasing whenOrincreases). In particular, it has been experimentally observed that a standard Gaussian
formulation
α(Or) = exp(−Or2) (8)
provides a satisfactory behavior of the merging functionO (Kurtz et al.,2011).
Based on these chosen model regions and merging criterion, the BPT is built, as exemplified in Figure3. As a
concern of the merging criterion, a part of the BPT nodes may be affected by outlier regions composed of very small sets of pixels with extremely low or high intensity values (Equation (5)). This behavior could seriously affect the resulting partitions extracted from the BPT, then leading to over-segmentation results. However, this issue is handled by the classification step that will aggregate smaller regions to larger ones based on their spectral and morphological similarities (e.g., , a small region with extreme values surrounded by a larger region with different values but with the same altitude and slope).
2.1.2. Multiresolution clustering
Overview. The classification of the segments created by the previous step is performed by using a multiresolution
clustering approach (Kurtz et al.,2010) to automate as much as possible the global process (which is already affected by a semi-automatical segmentation step). Instead of characterizing the segments extracted at the current resolution by using classical features (e.g., color, texture, shape), we use their decompositions at the next resolution (Figure2-). To this end, for each segment, a class-based histogram is computed modeling its composition in terms of radiometric clusters into the next resolution image. A classical clustering approach – here, theK-MEANS(MacQueen,1967) – is then performed to createc groups of segments sharing similar features where c is set by the expert (we also offer the possibility to instantiate this methodology with a supervised classification approach). Once these groups have been
created, the expert selects and recognizes them to match with potential thematic ground classes (e.g., Cluster 1→
Vegetation,. . . , Cluster c→ Landslide).
These c clusters are then embedded into the next resolution image to be processed as input of the next step
(Figure2-®) and segmented into sub-clusters of interest. Practically, the c clusters are then considered in the next
resolution image as thek groups of thematic ground areas to be segmented, and new BPTs are built inside these
groups of segments (see Subsection2.1.1). This original strategy enables to cluster into similar groups (at the current resolution), regions sharing similar image characteristics at the next considered resolution.
Technical description.
As stated above, the multiresolution clustering approach used in the proposed TDHA is mainly based on the notion of color class-based histogram to characterize the segments to be classified. These multiresolution features are well adapted to deal with MR and HR images to enable the extraction/classification of the whole structure of the landslides.
0.0 0.2 0.4 0.6 0.8 1.0 0 2 4 6 8 10 Normalized Altitude −0.004 −0.002 0.000 0.002 0.004 0 200 400 600 800 1000 1200 1400 Curvature 5 10 15 20 25 30 35 40 0.0 0.1 0.2 0.3 0.4 0.5 0.6 Slope, w=200 m Slope [°] Curvature, w=200 m D ensit y Normalized Altitude a b c Entire landslide Toe Transport
zone Sourcearea
Toe Entire landslide Toe Entire landslide Source area Transport zone Source area Transport zone
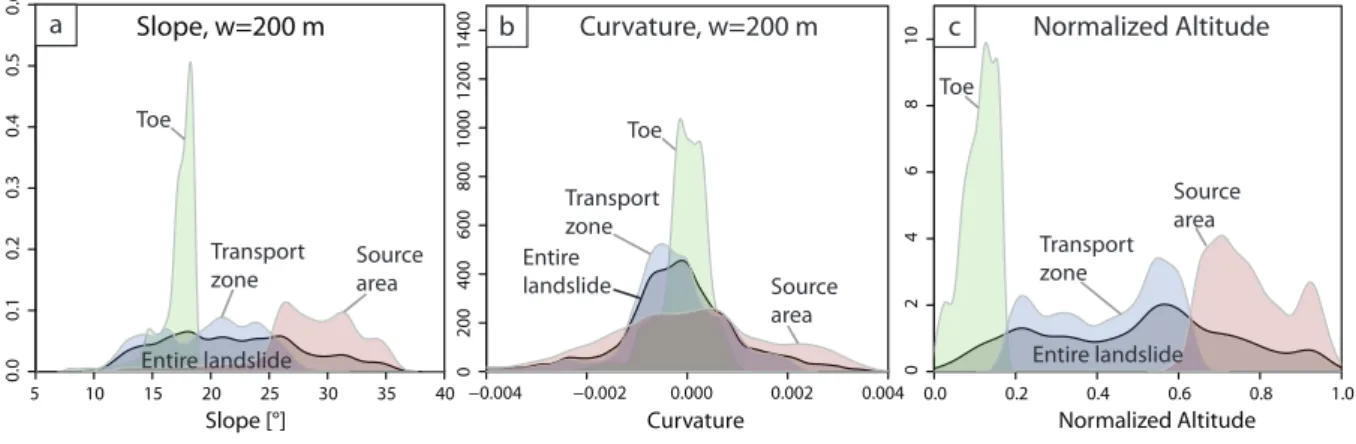
Figure 4: Probability density distributions of the morphological features for the landslide sub-units at the La Valette landslide. (a) Local slope at a window size of 200 m. (b) Local curvature at a window size of 200 m. (c) Altitude normalized by the range of altitude values over the entire landslide.
In the specific case of the classification of the landslide sub-units (i.e., source area, transport area, toe) from VHR images, it is also relevant to consider the morphological features of the data during their classification. Consequently, we consider both the radiometric and the spatial properties of the ground during the classification of the regions extracted from the VHR images. In this way, we propose to characterize each segment extracted from the VHR images using the following features:
• the radiometric average value of each spectral bandA1, . . . , AB;
• the slope valueslop; • the curvature valuecurv; • the normalized altitude valuealt.
Indeed, preliminary experiments have shown that morphological features could enable separation of the different classes related to the considered object of interest. In particular (see Figure4) slope and normalized altitude seem to be powerful features to discriminate the landslide sub-units.
2.2. Domain adaptation strategy
The classical domain adaptation approaches act by transferring the learned model (in general, a classifier) from a training to a target dataset for which a priori information is not available. We propose hereinafter a wise extension of such approaches enabling the transfer of a segmentation established interactively by an expert on a geographic subset of a remote sensing dataset to automatically process the data in a target region of interest.
2.2.1. Transfer of the learned elements
Once a multiresolution set of images has been processed (i.e., segmented and classified) in a training area, it becomes possible to transfer the learned segmentation examples and clusters to process the set of images for target regions of interest. The underlying idea is that a specific landslide (or sub-units of a landslide) extracted from a particular ground unit will present similar spatial and radiometric characteristics as other landslides within the same geographic ground unit. Consequently, we assume that the landslides (and their sub-components) from the training and the target area can be characterized with similar geometrical and radiometric (i.e., slope, curvature, normalized altitude) features.
• theK tree-cut examples provided by the expert (for each thematic ground area of each resolution image in the training area) during the hierarchical example-based segmentation step
K = k1+· · · + knsets of color histograms and geometrical features (9)
TheseK examples can be used as input of the example-based segmentation approach to run the cutting strategy
on the BPTs built for the different thematic ground areas of the images. This approach enables to automatically segment then images at the target area;
• theC centroids of the clusters (related to the different resolution images) learned during the multiresolution clustering step (and their potential associated semantic label, e.g., Cluster 1→ Vegetation class)
C = c1+· · · + cnsets of centroids (10)
TheseC centroids can be used as input of the multiresolution clustering approach to classify the segments
automatically created by the example-based segmentation approach. 2.2.2. Robustness to statistical variability
Due to potential differences in the environmental conditions (e.g., differences in atmospheric conditions, sun in-cidence angle, variations of the lithology, possible changes in surface soil moisture), the statistical distributions of the data in the target area may differ from the training area in a similar manner than between different datasets (Bahirat et al.,2012). Consequently, the statistical properties of the transferred learned elements could not be relevant to effi-ciently segment and classify the images at the target area. For instance, if the distribution of the color values is shifted from the training to the target area, the tree-cut examples provided by the expert during the hierarchical example-based segmentation step (modeled by color histograms) could not be adapted to segment the images composing the target area. Indeed, the algorithm used to repeat the segmentation examples on the remaining parts of the images is mainly based on the computation of a distance between pairs of histograms and most of the classical distance (e.g., the Euclidean one) are sensitive to the translation of the color values.
To deal with this issue, a solution consists of using a more robust distance to compute the similarity between histograms. We propose to use the constrained Dynamic Time Warping (DTW) similarity measure to compare the
considered histograms (Sakoe and Chiba,1978). Indeed, this similarity measure enables small distortions on the
radiometric axis (Petitjean et al.,2012a).
LetH(A) =hH1(A), H2(A), . . . , Hv(A)i and H(B) = hH1(B), H2(B), . . . , Hv(B)i be two histograms of v
bins. The similarity measure is computed as
DT Wλ(H1···i(A), H1···j(B)) = +∞ if|i − j| ≥ λ |Hi(A)− Hj(B)| + min DT Wλ(H1···i−1(A), H1···j−1(B)) DT Wλ(H1···i(A), H1···j−1(B)) DT Wλ(H1···i−1(A), H1···j(B)) otherwise (11) whereλ∈ Z represents the tolerance of distortions on the radiometric axis and Hx···y(?) represents the sub-histogram
hHx(?), . . . , Hy(?)i. This similarity measure requires larger computation times than the Euclidean distance, but
provides better results. Associated to this measure, different averaging methods have been recently proposed (Petitjean et al.,2011;Petitjean and Gançarski,2012) in order to define efficiently the mean histograms.
Since the centroids of the clusters learned during the multiresolution clustering step are modeled by class-based histograms (and robust spatial features), they are more adapted to deal with the statistical variability among the con-sidered areas. Consequently, these elements can be transferred without adapting them to the statistical distribution of the target area.
3. Experiments
The datasets used to test the proposed method are described in Subsection 3.1. In order to allow the expert
to actually test the proposed multiresolution methodology, a software has been designed. This tool is described in Subsection3.2. The evaluation protocol is presented in Subsection3.3while the experimental settings and the results obtained are presented in Subsection3.4.
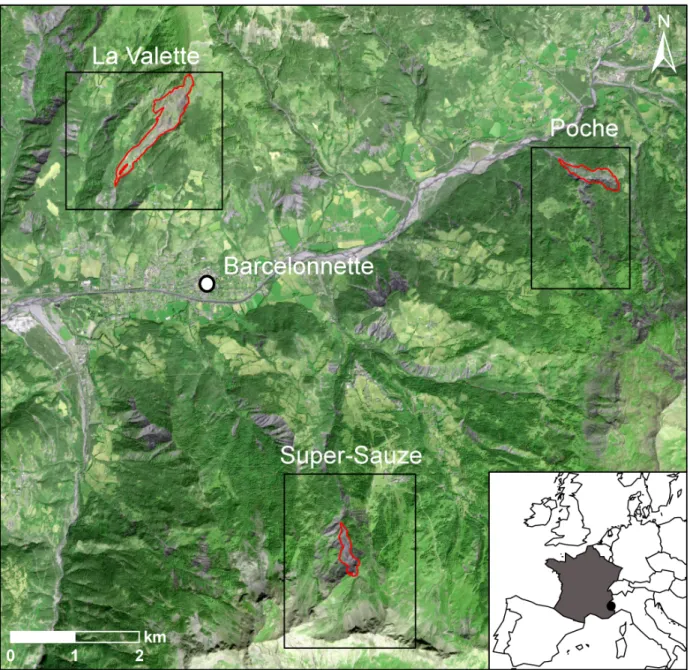
Figure 5: Study area: overview of the Barcelonnette basin (South East France) and of the three large active landslides considered in this experiment. This map has been built from an HR image (5 m) acquired in 2009 (© RAPIDEYE).
3.1. Data
3.1.1. Multiresolution images
The study area is the Barcelonnette basin (South East French Alps) which is characterized by specific slope, lithological, and climate conditions favoring the triggering of landslides of different sizes (Malet et al.,2005). In this study, three subsets comprising the La Valette, the Poche and the Super-Sauze slow-moving landslides are examined (Figure5). These landslides have a similar spatial organization with the presence of a more or less circular (in the horizontal plane) scarp area and an elongated transit zone narrower than the source area. These geometrical features are characteristic of flow-like landslides. Moreover, the three landslides have developed the same lithology (e.g., black marls) and are characterized by important coverage of bare soils at the surface; the radiometric values observed on
each landslide are therefore in the same range. We then consider three datasets (denoted LAVALETTE, POCHEand
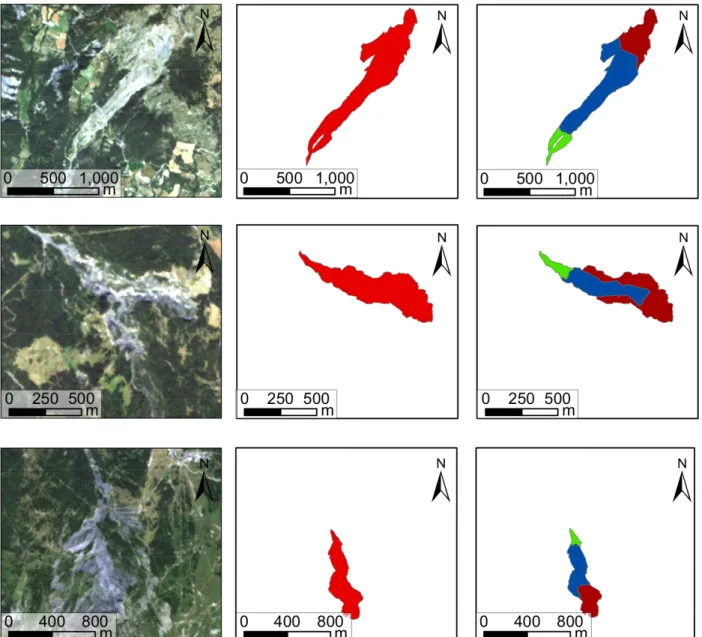
SUPER-SAUZEand presented in Figure6) composed each of:
• a LANDSATTM MR (30 m) multispectral image with seven spectral bands (denoted asI1);
• a RAPIDEYEHR (5 m) multispectral image with five spectral bands (denoted asI2);
• a VHR (50 cm) ortho-image, geometrically corrected, with three spectral bands (denoted asI3).
All these images have been acquired in Summer 2009.
In order to avoid image-to-image registration issues, all the data are georeferenced in the same local cartographic projection (Lambert I). This guarantees the feasibility of the multiresolution approach. In addition, as the proposed multiresolution methodology is region-based, the image-to-image mapping is not operated at the pixel level but at the region one. This property can seriously reduce potential image-to-image registration issues that are not fixed by the georeferencing step at the pixel level.
3.1.2. Terrain parameters
For each dataset, a DTM with a spatial resolution of 3.4 m is available. These models have been derived from three LiDAR surveys acquired in Summer 2009. From these DTMs, a slope gradient image and a curvature image are computed. In the classical case, the computation of the raster files corresponding to these gradient images is usually
done in a3 m× 3 m neighborhood moving window. However, when dealing with a high spatial resolution DTM,
this small size of neighborhood captures a lot of local details that are not relevant for the general partitioning of the landslide. To deal with this issue a solution consists of resampling the obtained raster files to enable the consideration of more general structures (e.g., scarp, track, toe). Since simple resampling to coarser resolution would lead to a loss of information, we propose in these experiments to use a multiscale approach (Wood,1996) that allows the computation of resampled images with variable window sizes via a least square fitting strategy. We have experimentally assessed the impact of the main parameter% (i.e., the longitudinal curvature window size – expressed in meters) by setting it to different successive values (3,. . . , 115) and found that % ≥ 39 corresponds to a scale adapted to deal with the different structures of interest that need to be extracted (Figure7).
These gradient images have been resampled successively to5.0 m and 0.5 m spatial resolution images in order to
process the HR and VHR images composing the datasets. In addition, these resulting images have been georeferenced in the same local cartographic projection as the one used for the considered multiresolution optical images.
3.1.3. Levels of analysis
To evaluate the efficiency of the proposed methodology, several tests have been performed to extract hierarchies of complex patterns in the three datasets. The TDHA was run with three images as input (n = 3) in order to extract three levels of details:
• Level 1. Large natural areas from the MR imagesI1: spatial separation between mineral and vegetated areas.
• Level 2. Landslides structures from the HR imagesI2: landslide bodies and surrounding crests and gullies.
• Level 3. Landslides sub-parts from the VHR imagesI3: source area, transport area and toe.
For Levels 1 and 2, the principal task was mainly to distinguish the landslide bodies from the surrounding crests and gullies, and since the affected area is one compact object this rather corresponds to an image segmentation task. 3.2. Software
In order to allow the expert to test the proposed multiresolution methodology, a software tool has been designed to interactively browse each BPT in a “threshold-like” approach in order to determine the most satisfactory segmentation examples (globally, and/or by refining one or several branches).
Due to the pre-processing of the data structures, the short computation time (less than 30 seconds of CPU) enables, in particular, to carry out several segmentations to finally select the best one. We have also developed (and integrated
Figure 6: Multiresolution images of the three datasets. Top to bottom lines: LAVALETTE, POCHE, SUPER-SAUZE. Left column: MR images (30 m) acquired in 2009 (© LANDSATTM). Center column: HR images (5 m) acquired in 2009 (© RAPIDEYE). Right column: VHR images (50 cm) acquired in 2009 (© IGN).
in this software) a TIFF library which allows to load only the subdivisions of the images that are necessary to the current segmentations. This library enables to reduce the memory resources required by the application.
This tool has been implemented using the Java MUSTIClibrary and the Orfeo Toolbox (OTB) framework. Both
are open source libraries and are freely available1. It is planned to fully integrate the proposed methodology into these
libraries and to distribute this software under a free license.
1The MUSTICJava library, developed by some of the authors, can be downloaded at the following url:http://icube-bfo.unistra.
fr/fr/index.php/Plateformes. The OTB framework is an open source set of tools for remote sensing data exploitation. It has been developed by the French Space Agency (CNES) to promote the use and the exploitation of the images derived from the PLEIADESsystems (de Lussy et al.,2005). It can be downloaded at the following url:http://otb.cnes.fr.
Figure 7: Illustration of the multiscale resampling approach of the DTM used on the LAVALETTEdataset. This figure shows the influence of the window size parameter % on the computation of the slope and curvature of the terrain.
3.3. Evaluation protocol
Two evaluation protocols have been used to assess the efficiency of the TDHA:
1. visual analysis of the segmentation/classification results (for Level 1): a grade between 1 (bad accuracy) and 10 (high accuracy);
2. quantitative accuracy assessment with comparisons to ground-truth maps (for Levels 2 and 3).
To perform quantitative accuracy assessment, the classification results have been compared to certified ground-truth maps by using different quality indexes. The ground-truth maps are based on field work and visual interpretation of (V)HR satellite imagery. Figure8presents the ground-truth maps used in the experiments to evaluate the accuracy of the classification results.
We describe hereinafter the quality indexes considered in this study. The first index that has been used is the
average F-measureF corresponding to the mean, for each class, of the obtained F-measures. To this end, for each
thematic class, the best corresponding clusters (in terms of partitions) were extracted. Then, we have computed: the percentage of false positives (denoted byf(p)), the percentage of false negatives (denoted byf(n)) and the percentage
of true positives (denoted byt(p)). These measures are used to estimate the precision
P and the recall R of the results:
P = t (p) t(p)+ f(p) (12) R = t (p) t(p)+ f(n) (13)
For each experiment, we have then computed the geometrical meanP of the obtained precisions and the geometrical
meanR of the obtained recalls. Finally, we have computed the mean F-measure F which is the harmonic mean of the
mean precision and the mean recall:
F = 2 · P.R
Figure 8: Ground-truth maps associated to the three datasets. Top to bottom lines: LAVALETTE, POCHE, SUPER-SAUZE. Left column: HR images (5 m) acquired in 2009 (© RAPIDEYE). Center column: Level 2. Landslide structures (in red). Right column: Level 3. Landslide sub-parts: source area (in brown), transport area (in blue) and toe (in light green).
The second index that has been computed is the Kappa indexK, which is a measure of global classification accuracy
(Congalton,1991):
K = Pr(a)1 − Pr(e)
− Pr(e) (15)
wherePr(a) is the relative agreement among the observers, and Pr(e) is the hypothetical probability of chance
agreement. The Kappa index takes values in[0, 1] and decreases as the classification is in disagreement with the
ground-truth map. We have computed this index as follows. The approach consists of considering all point couples (x1, x2) = ((x1, y1), (x2, y2)) and seeing the configuration of these two points in each partition (the clustering result
and the ground-truth). There are four possible configurations; for each one, a counter is associated and incremented each time a configuration appears:
(a) (b)
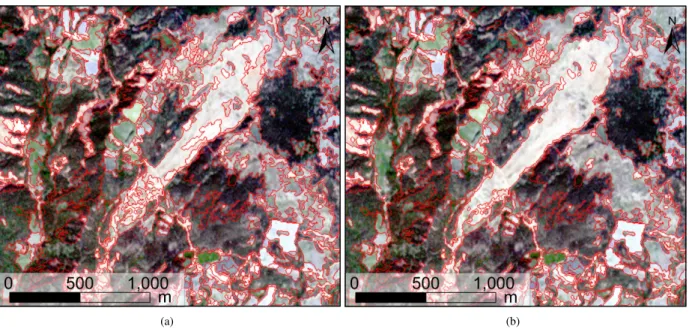
Figure 9: Extract of the results (Level 2) obtained from the HR image of the LAVALETTEdataset. (a) Segmentation result obtained by considering only the radiometric information. (b) Segmentation result obtained by considering both the radiometric and the spatial information. The borders of the regions are depicted in red.
1. x1and x2belong to the same partition both in the clustering and in the reference map (counterss);
2. x1and x2belong to the same partition in the clustering but not in the reference map (countersd);
3. x1and x2belong to the same partition in the reference map but not in the clustering (counterds);
4. x1and x2belong to the same partition neither in the reference map nor in the clustering (counterdd).
Thus, the Kappa index is computed with:
Pr(a) = ss+ dd ss+ sd+ ds+ dd (16) and Pr(e) = (ss+ sd)· (ss+ ds) + (sd+ dd)· (ds+ dd) (ss+ sd+ ds+ dd)2 (17) The computation of these class-specific indexes requires the matching of classes of interest with clusters extracted by the unsupervised classification approach. To this end, we have used an automatic strategy, which consists of selecting the clusters that maximize the overlapping with the corresponding class.
As the results provided by theK-MEANSalgorithm are sensitive to the initialization step of the algorithm, each classification run has been repeated ten times. We have then computed the variance valueσ obtained for each consid-ered evaluation index and for each series of runs.
3.4. Experimental study 3.4.1. General settings
To process the three considered datasets, the TDHA has been parametrized as follows. The example-based hi-erarchical segmentation step and the multiresolution clustering step have been iteratively run three times (n = 3) to extract the objects of interest linked to the three considered scales. To perform,K = 11 tree-cut examples have been provided by the expert (k1= 1, k2= 4, k3= 6) and C = 20 clusters have been extracted (c1= 4, c2= 6, c3= 10).
The values of these parameters have been chosen in agreement with the experts in landslide analysis to enable the
extracted corresponding respectively to four land-cover classes: high reflecting mineral areas, low reflecting mineral areas, herbaceous vegetation areas and forest areas.
Preliminary experiments with the example-based hierarchical segmentation approach have shown that using tree-cut examples modeled by10 color histograms, each one composed of 100 bins is sufficient to produce relevant results. One may notice that the multiresolution clustering approach did not directly find all the appropriate clusters with respect to the different classes of object of interest. To tackle this problem, the standard solution consists of extracting a higher number of clusters than the number of thematic classes contained in the expected results. Once these clusters have been extracted, the expert could recognize and manually associate them to natural landcover classes.
3.4.2. Extension of TDHA for landslide detection
To validate the extension of TDHA to landslide detection, and in particular the interest of the use of spatial features, we have compared the results obtained by introducing or not these features both in the segmentation and in the classification steps.
Segmentation step. In order to evaluate the interest of constraining the way to build the BPTs by using or not the spa-tial features, we have run the segmentation step by varying theα parameter of the merging criterion (see Equation (7)) to different values.
The first segmentation experiment has been performed by only considering the radiometric region model of the
nodes during their fusions. To this end, the weightα has been set to 1.0 in the equation of the merging criterion.
The second segmentation experiment has been performed by considering both the radiometric and the geometrical region models of the nodes during their fusions. To this end, the weightα has been defined as stated in Equation (8). Once the images of the different datasets have been segmented by the hierarchical segmentation step, the resulting regions have been classified using the proposed multiresolution clustering approach. To evaluate the quality of these segmentation results, we focus on the results of the HR images (Level 2) for the three datasets.
After classification, the comparisons between the classified regions resulting from the first segmentation exper-iment (i.e., only the radiometric model) and the ground-truth maps have shown Kappa values and F-Measures of
(K = 0.38 and F = 0.61) for the LA VALETTEdataset, (K = 0.36 and F = 0.54) for the POCHE dataset and
(K = 0.37 and F = 0.58) for the SUPER-SAUZEdataset. After classification, the comparisons between the
classi-fied regions resulting from the second segmentation experiment (i.e., both radiometric and geometric models) and the
ground-truth maps have shown Kappa values and F-Measures of (K = 0.41 and F = 0.63) for the LAVALETTE
dataset, (K = 0.39 and F = 0.57) for the POCHEdataset and (K = 0.40 and F = 0.61) for the SUPER-SAUZE
dataset.
To assess visually the differences between the segmentation results obtained by considering or not the spatial
information, Figure9focuses on the segmentation results of the HR image of the LA VALETTE dataset. One can
see that the segmentation results obtained with the proposed landslides extension of the TDHA are spatially more consistent and regular than the results obtained without considering the spatial information. These quantitative and visual accuracy assessments show that considering spatial features during the segmentation step of the TDHA enables to enhance the segmentation of landslides.
Classification step. After the segmentation step, the resulting regions have been classified using the proposed mul-tiresolution clustering approach. The regions extracted at Level 1 and Level 2 have been characterized using com-position histograms and the classification maps obtained have been visually or quantitatively evaluated. For Level 3, different combinations of radiometric and spatial features have been used to characterize the regions to be classified:
• Experiment 1: (A1, A2, A3) the radiometric mean value of each spectral band;
• Experiment 2: (A1, A2, A3, slop) the radiometric mean value of each spectral band combined with the slope
value;
• Experiment 3: (A1, A2, A3, curv) the radiometric mean value of each spectral band combined with the
curva-ture value;
• Experiment 4: (A1, A2, A3, slop, curv) the radiometric mean value of each spectral band combined with the
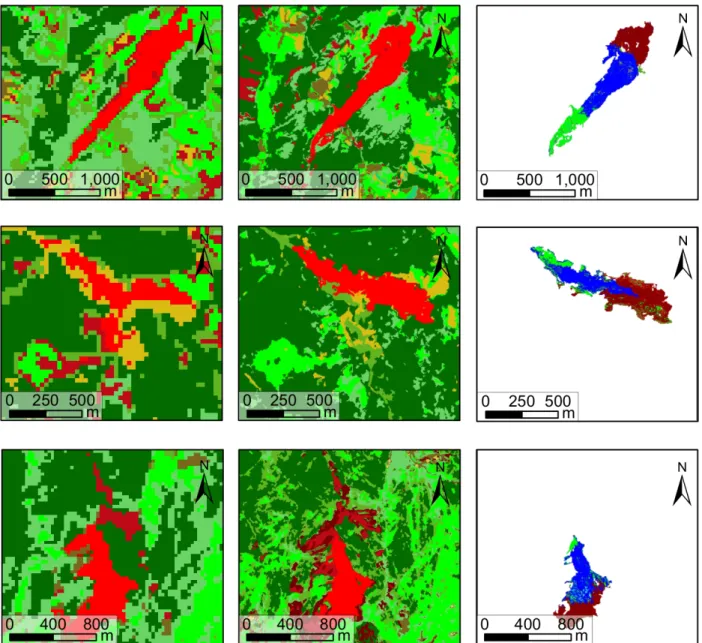
Figure 10: Classification results obtained from the three datasets (that have been processed independently). Top to bottom lines: LAVALETTE, POCHE, SUPER-SAUZE. Left column: Level 1 obtained from MR images. Center column: Level 2 obtained from HR images. Right column: Level 3 obtained from VHR images.
• Experiment 5: (A1, A2, A3, slop, curv, alt) the radiometric mean value of each spectral band combined with
the slope, the curvature and the altitude values.
As the altitude information of the regions represent absolute values extracted from the DTM, they can differ from one landslide to another and then cannot be sufficiently discriminative to separate the regions composing the different sub-units of the landslides. To deal with this issue, we have normalized the altitude values of the regions by using the global structure of the landslides extracted at Level 2. To this end, we assume that a landslide has a slope structure.
By notingaltmax andaltmin its highest and lowest altitude, respectively, we then affect to each regionRi ⊆ E
composing the landslide a normalized altitude value computed as: altnorm(Ri) =
alt(Ri)− altmin
altmax− altmin
Table 1: Evaluation results on the LAVALETTE, POCHE, SUPER-SAUZEdatasets. Each dataset has been processed independently.
Levels Features Visual evaluation
1. Landslide position Multires. histograms 8/10 7/10 5/10
Evaluation with ground-truth maps
F ± σ K ± σ F ± σ K ± σ F ± σ K ± σ
2. Landslide body Multires. histograms 0.63 ± 0.01 0.41 ± 0.02 0.57 ± 0.01 0.39 ± 0.02 0.61 ± 0.01 0.40 ± 0.02
3. Landslide sub-parts Exp1 (A1, A2, A3) 0.65 ± 0.01 0.38 ± 0.01 0.63 ± 0.02 0.37 ± 0.01 0.64 ± 0.02 0.38 ± 0.01 Exp2 (A1, A2, A3, slop) 0.67 ± 0.02 0.41 ± 0.02 0.65 ± 0.01 0.40 ± 0.02 0.67 ± 0.01 0.42 ± 0.02 Exp3 (A1, A2, A3, curv) 0.65 ± 0.02 0.40 ± 0.01 0.64 ± 0.02 0.38 ± 0.02 0.63 ± 0.02 0.38 ± 0.01 Exp4 (A1, A2, A3, slop, curv) 0.67 ± 0.01 0.41 ± 0.02 0.67 ± 0.01 0.48 ± 0.02 0.66 ± 0.02 0.41 ± 0.01 Exp5 (A1, A2, A3, slop, curv, alt) 0.69 ± 0.02 0.42 ± 0.01 0.68 ± 0.02 0.42 ± 0.01 0.67 ± 0.02 0.42 ± 0.02
LAVALETTE POCHE SUPER-SAUZE
Results obtained on the three datasets are shown on Figure10. For each level of analysis, the classification maps obtained are represented. The results of the visual and quantitative accuracy assessments are presented in Table1.
Figure10(left column) presents the results for the extraction of large natural areas (Level 1) from the MR im-ages. The mineral parts (orange, red clusters) and the vegetation parts (light green, dark green clusters) are correctly
separated by the process. Furthermore, the landslides are correctly located in the image. Figure10(center column)
presents the results for the extraction of the landslides structures (Level 2) from the HR images. The landslide body is correctly delineated in the classification result and the different kinds of vegetation (light green, dark green clusters) are correctly separated by the process. Finally, Figure10(right column) shows the results for the extraction of the landslide sub-parts (Level 3) from the VHR images.
To compare the impact of the different spatial features used during the classification of the regions extracted at Level 3, Figure11shows the classification results obtained on the LAVALETTEusing the different combinations of features. One can note that the more discriminative spatial features are the slope and the altitude values, that enable to accurately separate the landslide structure in the different sub-parts of interest. This visual study is also confirmed by the results of the comparisons with the ground-truth maps presented in Table1.
3.4.3. Domain adaptation experiment
Experimental protocol. To evaluate the interest of the presented domain adaptation strategy, learning transfer experi-ments have been carried out:
• SUPER-SAUZE → LA VALETTE: the SUPER-SAUZE area has been used as training area while the LA
VALETTEarea has been used as target area;
• LAVALETTE→ POCHE: the LAVALETTEarea has been used as training area while the POCHEarea has been used as target area;
• POCHE→ SUPER-SAUZE: the POCHEarea has been used as training area while the SUPER-SAUZEarea has
been used as target area.
Practically, theK = 11 tree-cut examples (provided by the expert during the example-based segmentation step) and
theC = 20 centroids of the clusters (learned during the multiresolution clustering step) which are resulting from the processing of the training area, have been transferred to automatically process the target dataset. However, as different specific thematic classes (i.e., mineral and/or vegetated clusters) are not present in the considered target datasets, the segmentation examples and the learned clusters corresponding to these classes have not been considered during the transfer step.
The impact of theλ parameter (required for the computation of the constrained DTW similarity measure) on the
Figure 11: Classification results at Level 3 obtained from the VHR image of the LAVALETTEdataset. Top left: ground-truth map. Top cen-ter: experiment 1 (A1, A2, A3). Top right: experiment 2 (A1, A2, A3, slop). Bottom left: experiment 3 (A1, A2, A3, curv). Bottom center:
experiment 4 (A1, A2, A3, slop, curv). Bottom right: experiment 5 (A1, A2, A3, slop, curv, alt).
tolerance of distortions on the radiometric axis between the bins of pairs of color histograms during their comparisons (see Equation (11)). It enables to deal with the statistical variability of the datasets during the transfer of the learned
knowledge. To study the impact ofλ, we have run the domain adaptation experiments on images at different
resolu-tions, by varying the parameter (λ = 0, 5, 10, 15, 20, 25, . . . , 100). As the considered color histograms are composed
each of100 bins, the maximal value of λ is 100. Each experiment has then been assessed by using the evaluation
measures presented previously.
Domain adaptation results. Evaluation results obtained on the domain adaptation experiments are presented in
Ta-ble2. The results obtained on the three datasets are slightly lower when the segmentation examples and the clusters learned are transferred from another dataset than when they are learned directly. However, such results are sufficient to detect landslides. Furthermore, these experiments show that it is possible to maximize the potential of the expert-defined segmentation examples (and thus to reduce the time spent by the expert) to process several large datasets sensed over similar hazardous territories.
Impact of theλ parameter. We discuss hereinafter the impact of the choice of the λ parameter value during the
learning transfer step. The result of this impact-study is presented in Figure12. Fromλ = 0 to λ = 20, the quality of the segmentation and clustering results increases. In particular, best results are obtained whenλ = 15 for the (LA
VALETTE→ POCHE) experiment and whenλ = 20 for the (POCHE→ SUPER-SAUZE) experiment. Afterλ = 20 the quality of the results remains stable.
Such experiments confirm our original assumption: the automatic reproduction step of the tree-cut examples is directly affected by the differences between the statistical distributions of the data composing the training area and the target one. However, the results obtained show that the use of the constrained DTW similarity measure to compare the considered histograms is a relevant strategy to deal with this issue.
Nevertheless, a too high value ofλ can increase the computation times. Experiments show that λ = 15 is a good
Table 2: Evaluation results of the domain adaptation experiments. For each experiment one dataset has been used as training dataset while another one has been used as target one.
Levels Features Visual evaluation
1. Landslide position Multires. histograms 7/10 6/10 5/10
Evaluation with ground-truth maps
F ± σ K ± σ F ± σ K ± σ F ± σ K ± σ
2. Landslide body Multires. histograms 0.61 ± 0.02 0.38 ± 0.02 0.56 ± 0.01 0.38 ± 0.02 0.59 ± 0.01 0.38 ± 0.01
3. Landslide sub-parts Exp1 (A1, A2, A3) 0.63 ± 0.01 0.37 ± 0.01 0.59 ± 0.02 0.36 ± 0.02 0.62 ± 0.01 0.37 ± 0.01 Exp2 (A1, A2, A3, slop) 0.65 ± 0.01 0.40 ± 0.02 0.61 ± 0.01 0.39 ± 0.02 0.65 ± 0.02 0.41 ± 0.02 Exp3 (A1, A2, A3, curv) 0.65 ± 0.02 0.40 ± 0.01 0.61 ± 0.01 0.37 ± 0.01 0.61 ± 0.01 0.39 ± 0.02 Exp4 (A1, A2, A3, slop, curv) 0.65 ± 0.01 0.39 ± 0.01 0.58 ± 0.02 0.48 ± 0.02 0.65 ± 0.02 0.40 ± 0.01 Exp5 (A1, A2, A3, slop, curv, alt) 0.66 ± 0.02 0.42 ± 0.01 0.63 ± 0.02 0.41 ± 0.01 0.65 ± 0.02 0.42 ± 0.02
SUPER-SAUZE→ LAVALETTE LAVALETTE→ POCHE POCHE→ SUPER-SAUZE
λ = 15 0 10 20 30 40 50 60 70 80 90 100 Value of λ 0 0.2 0.4 0.6 0.8
KappaK index F-Measure ¯F index (a) Results for the LAVALETTE→ POCHEexperiment.
λ = 20 0 10 20 30 40 50 60 70 80 90 100 Value of λ 0 0.2 0.4 0.6 0.8
KappaK index F-Measure ¯F index (b) Results for the POCHE→ SUPER-SAUZEexperiment. Figure 12: Impact study of the λ parameter for the computation of the constrained Dynamic Time Warping similarity measure.
Discussion. We show in this study that the hierarchical segmentation and classification models learned on a first
dataset sensed over a particular landslide can be re-used in order to automatically process other datasets sensed over the same kind of landslide. An actual limit is that the proposed approach requires that the multiresolution images used for the mapping only cover the landslide surface (and not a larger heterogeneous region with different types of landslides). A potential solution to this issue would consist of integrating the TDHA to a landslide mapping framework initialized with a landslide detection approach (Stumpf et al.,2013). Such a detection step could be performed from a low resolution image covering a large heterogeneous area composed of various landslides. The TDHA approach could then be used for the fine mapping of a particular landslide selected by the detector. The domain adaptation strategy could then be used to automatically process other landslides of the large area.
3.4.4. Comparisons with related works
To highlight the relevance of the proposed top-down multiresolution methodology for landslide mapping, we compared the results obtained within this framework to those obtained with other related methodologies. In particular, we considered two specific segmentation approaches, based on a bottom-up strategy and that can be used to extract landslide features directly from the VHR images (i.e., in a monoresolution fashion).
and a region-merging algorithm (based on both image spectral and textural characteristics) (Baatz and Schape,2000) which have shown satisfactory results in the context of remote sensing image segmentation. We have used the OTB implementation of the Mean-Shift segmentation algorithm with manually selected parameter values and an implemen-tation of the region-merging segmenimplemen-tation algorithm provided in the Definiens eCognition software. The segmenimplemen-tation maps, provided by these two algorithms from the VHR images, have been classified in the same way as we did in the TDHA for the extraction of the landslide sub-parts (Level 3): the regions were characterized using the combination of radiometric and spatial features (Experiment 5 in Section3.4.2). The classification results (at the Level 3)
ob-tained on the three datasets (LAVALETTE, POCHE, SUPER-SAUZE) by these two algorithms have been compared
quantitatively (Kappa values and F-Measures) to the results obtained with the TDHA (Table1, last line).
This study has shown that the percentages of sub-parts of the landslides well recognized with the Mean-Shift and the region-merging algorithms are lower than those obtained with the TDHA (for each dataset considered individu-ally). In average for the three datasets, the proposed multiresolution methodology enables to extract a large part of the
objects of interest (K = 0.42 and F = 0.68) while these scores reach (K = 0.40 and F = 0.64) with the Mean-Shift
algorithm and (K = 0.38 and F = 0.61) with the region-merging algorithm. A qualitative analysis carried by two
experts in landslide mapping has also confirmed these results.
This comparative study suggests that the proposed top-down multiresolution methodology provides better results than those obtained with a bottom-up strategy applied on VHR images. Furthermore, the TDHA enables to extract different levels of objects of interest while most of the other related approaches enable only the extraction at a single semantic level. This multiscale property leads to a better understanding of the observed scenes and their compositional structures which is a crucial need when dealing with the mapping of geohazards. In addition, our methodology is interactive and thus intuitive to configure for the expert who needs to process rapidly huge mass of data.
4. Conclusion
This article has introduced a novel approach for the detection of landslides from multiresolution sets of images. It is based on a top-down multiresolution hierarchical approach that takes advantage both of geomorphological informa-tion for guiding the segmentainforma-tion/classificainforma-tion steps, and of a domain adaptainforma-tion strategy to optimize and minimize the expert’s interaction.
From a methodological point of view, it constitutes an original solution to address the issues linked to the analysis of VHR images. Based on a multiresolution paradigm, the proposed approach enables to deal with such images without being convoluted by the large size and the level of details of these data. Furthermore, this partitioning approach authorizes to adapt the scale of the segmentation process to restricted areas of the images instead of segmenting the whole dataset using only one segmentation parameter. To reduce the amount of time spent by the expert to supervise the global extraction process, it has been proposed to re-use the knowledge learned on a first dataset in order to automatically process other datasets. We have seen that considering the DTW criteria as similarity measure when comparing the knowledge extracted from a training area to the one extracted from a target area, enables to deal with the variability in the statistical distribution of the data, and then to enhance the classification process.
From an applicative point of view, this article has proposed a novel strategy to address the issues linked to the analysis of geohazards. Experiments performed on three sets of multiresolution satellite images were carried out to evaluate the robustness of this methodology in the context of the extraction of natural landslides. These experiments have provided satisfactory and accurate classification results which may be further used for operational needs, in particular for the assessment of natural disasters in hazardous areas.
This work opens up various research perspectives. As methodological perspectives, the choice of the considered spatial features in the segmentation and in the classification processes has to be deeply studied. For instance, textural and topological features could be used. We also plan to validate the proposed methodology by using other segmenta-tion and classificasegmenta-tion strategies. Finally, we plan to study more formally the robustness of the learning transfer step to deal with different kinds of landslides and images. As thematical perspectives, the impact of potential image-to-image spatial registration issues (at the region level) will be analyzed in a future study. As technological perspectives, the
coming pair of SENTINEL-2 satellites will provide at the same time images with different spatial and radiometric
resolutions (four bands at10 m, six bands at 20 m and three bands at 60 m at a high temporal frequency. Coupled
multiresolution complementarity adapted to deal with landslides extraction. In this context, we plan to study new trends to extend the proposed approach to deal with such properties by using dedicated multitemporal approaches (Petitjean et al.,2012b).
Acknowledgements
The research leading to these results has received funding from the French Agence Nationale de la Recherche (Grant Agreement ANR-10-COSI-012-03), and from the Service National d’Observation CNRS-INSU OMIV (Ob-servatoire Multidisciplinaire des Instabilités de Versants).
References
Akcay, H.G., Aksoy, S., 2008. Automatic detection of geospatial objects using multiple hierarchical segmentations. IEEE Transactions on Geoscience and Remote Sensing 46, 2097–2111.
Alonso-González, A., Valero, S., Chanussot, J., López-Martinez, C., Salembier, P., 2012. Processing multidimensional SAR and hyperspectral images with binary partition tree. Proceedings of the IEEE 101, 723–747.
Anders, N.S., Seijmonsbergen, A.C., Bouten, W., 2011. Segmentation optimization and stratified object-based analysis for semi-automated geo-morphological mapping. Remote Sensing of Environment 115, 2976–2985.
Baatz, M., Schape, A., 2000. Multiresolution segmentation–An optimization approach for high quality multi-scale image segmentation, in: Ange-wandte Geographische Informationsverarbeitung Symposium, pp. 12–23.
Bahirat, K., Bovolo, F., Bruzzone, L., Chaudhuri, S., 2012. A novel domain adaptation Bayesian classifier for updating land-cover maps with class differences in source and target domains. IEEE Transactions on Geoscience and Remote Sensing 50, 2810–2826.
Barlow, J., Franklin, S., Martin, Y., 2006. High spatial resolution satellite imagery, DEM derivatives, and image segmentation for the detection of mass wasting processes. Photogrammetric Engineering and Remote Sensing 72, 687–692.
Benediktsson, J.A., Bruzzone, L., Chanussot, J., Dalla Mura, M., Salembier, P., Valero, S., 2011. Hierarchical analysis of remote sensing data: Morphological attribute profiles and binary partition trees, in: Soille, P., Pesaresi, M., Ouzounis, G.K. (Eds.), Proceedings of the International Symposium on Mathematical Morphology – ISMM, Springer. pp. 306–319.
Benediktsson, J.A., Chanussot, J., Moon, W., 2012. Very High-Resolution remote sensing: Challenges and opportunities. Proceedings of the IEEE 100, 1907–1910.
Benz, U.C., Hofmann, P., Willhauck, G., Lingenfelder, I., Heynen, M., 2004. Multi-resolution, object-oriented fuzzy analysis of remote sensing data for GIS-ready information. ISPRS Journal of Photogrammetry and Remote Sensing 58, 239–258.
Blaschke, T., 2010. Object based image analysis for remote sensing. ISPRS Journal of Photogrammetry and Remote Sensing 65, 2–16.
Bruzzone, L., Prieto, D., Serpico, S., 1999. A neural-statistical approach to multitemporal and multisource remote-sensing image classification. IEEE Transactions on Geoscience and Remote Sensing 37, 1350–1359.
Chang, Y.L., Liang, L.S., Han, C.C., Fang, J.P., Liang, W.Y., Chen, K.S., 2007. Multisource data fusion for landslide classification using generalized positive Boolean functions. IEEE Transactions on Geoscience and Remote Sensing 45, 1697–1708.
Comaniciu, D., Meer, P., 2002. Mean shift: A robust approach toward feature space analysis. IEEE Transactions on Pattern Analysis and Machine Intelligence 24, 603–619.
Congalton, R., 1991. A review of assessing the accuracy of classifications of remotely sensed data. Remote Sensing of Environment 37, 35–46. Daumé III, H., Marcu, D., 2006. Domain adaptation for statistical classifiers. Journal of Artificial Intelligence Research 26, 101–126.
Fiorucci, F., Cardinali, M., Carlà, R., Rossi, M., Mondini, A.C., Santurri, L., Ardizzone, F., Guzzetti, F., 2011. Seasonal landslide mapping and estimation of landslide mobilization rates using aerial and satellite images. Geomorphology 129, 59–70.
Gaetano, R., Scarpa, G., Poggi, G., 2009. Hierarchical texture-based segmentation of multiresolution remote-sensing images. IEEE Transactions on Geoscience and Remote Sensing 47, 2129–2141.
Galli, M., Ardizzone, F., Cardinali, M., Guzzetti, F., Reichenbach, P., 2008. Comparing landslide inventory maps. Geomorphology 94, 268–289. Garrido, L., Salembier, P., Garcia, D., 1998. Extensive operators in partition lattices for image sequence analysis. Signal Processing 66, 157–180. Guzzetti, F., Mondini, A.C., Cardinali, M., Fiorucci, F., Santangelo, M., Chang, K.T., 2012. Landslide inventory maps: New tools for an old
problem. Earth-Science Reviews 112, 42–66.
Hölbling, D., Füreder, P., Antolini, F., Cigna, F., Casagli, N., Lang, S., 2012. A semi-automated object-based approach for landslide detection validated by persistent scatterer interferometry measures and landslide inventories. Remote Sensing 4, 1310–1336.
Kayastha, P., Dhital, M.R., De Smedt, F., 2013. Application of the analytical hierarchy process (AHP) for landslide susceptibility mapping: A case study from the Tinau watershed, west Nepal. Computers & Geosciences 52, 398–408.
Kurtz, C., Passat, N., Gançarski, P., Puissant, A., 2010. Multiresolution region-based clustering for urban analysis. International Journal of Remote Sensing 31, 5941–5973.
Kurtz, C., Passat, N., Gançarski, P., Puissant, A., 2012. Extraction of complex patterns from multiresolution remote sensing images: A hierarchical top-down methodology. Pattern Recognition 45, 685–706.
Kurtz, C., Passat, N., Puissant, A., Gançarski, P., 2011. Hierarchical segmentation of multiresolution remote sensing images, in: Soille, P., Pesaresi, M., Ouzounis, G.K. (Eds.), Proceedings of the International Symposium on Mathematical Morphology – ISMM, Springer. pp. 343–354. Lahousse, T., Chang, K.T., Lin, Y.H., 2011. Landslide mapping with multi-scale object-based image analysis: A case study in the Baichi watershed,
Taiwan. Natural Hazards and Earth System Science 11, 2715–2726.
Lu, P., Stumpf, A., Kerle, N., Casagli, N., 2011. Object-oriented change detection for landslide rapid mapping. IEEE Geoscience and Remote Sensing Letters 8, 701–705.
de Lussy, F., Kubik, P., Greslou, D., Pascal, V., Gigord, P., Cantou, J., 2005. PLEIADES-HR image system products and geometric accuracy, in: Proceedings of the ISPRS Hannover Workshop on High-Resolution Earth Imaging for Geospatial Information – WHREI, pp. 50–57. MacQueen, J.B., 1967. Some methods of classification and analysis of multivariate observations, in: Proceedings of the Berkeley Symposium on
Mathematical Statistics and Probability – BSMSP, pp. 281–297.
Malet, J.P., Laigle, D., Remaître, A., Maquaire, O., 2005. Triggering conditions and mobility of debris flows associated to complex earthflows. Geomorphology 66, 215–235.
Mallinis, G., Koutsias, N., Tsakiri-Strati, M., Karteris, M., 2008. Object-based classification using Quickbird imagery for delineating forest vegetation polygons in a Mediterranean test site. ISPRS Journal of Photogrammetry and Remote Sensing 63, 237–250.
Martha, T.R., Kerle, N., Jetten, V., van Westen, C.J., Kumar, K.V., 2010. Characterising spectral, spatial and morphometric properties of landslides for semi-automatic detection using object-oriented methods. Geomorphology 116, 24–36.
Martha, T.R., Kerle, N., van Westen, C.J., Jetten, V., Kumar, K.V., 2012. Object-oriented analysis of multi-temporal panchromatic images for creation of historical landslide inventories. ISPRS Journal of Photogrammetry and Remote Sensing 67, 105–119.
Martha, T.R., Kumar, K.V., 2013. September, 2012 landslide events in Okhimath, India – An assessment of landslide consequences using very high resolution satellite data. Landslides 10, 469–479.
Mondini, A.C., Guzzetti, F., Reichenbach, P., Rossi, M., Cardinali, M., Ardizzone, F., 2011. Semi-automatic recognition and mapping of rainfall induced shallow landslides using optical satellite images. Remote Sensing of Environment 115, 1743–1757.
Mondini, A.C., Marchesini, I., Rossi, M., Chang, K.T., Pasquariello, G., Guzzetti, F., 2013. Bayesian framework for mapping and classifying shallow landslides exploiting remote sensing and topographic data. Geomorphology (In press). doi:10.1016/j.geomorph.2013.06. 015.
Nichol, J., Wong, M.S., 2005. Satellite remote sensing for detailed landslide inventories using change detection and image fusion. International Journal of Remote Sensing 26, 1913–1926.
Petitjean, F., Gançarski, P., 2012. Summarizing a set of time series by averaging: From Steiner sequence to compact multiple alignment. Theoretical Computer Science 414, 76–91.
Petitjean, F., Inglada, J., Gançarski, P., 2012a. Satellite image time series analysis under time warping. IEEE Transactions on Geoscience and Remote Sensing 50, 3081–3095.
Petitjean, F., Ketterlin, A., Gançarski, P., 2011. A global averaging method for Dynamic Time Warping, with applications to clustering. Pattern Recognition 44, 678–693.
Petitjean, F., Kurtz, C., Passat, N., Gançarski, P., 2012b. Spatio-temporal reasoning for the classification of satellite image time series. Pattern Recognition Letters 33, 1805–1815.
Raucoules, D., de Michele, M., Malet, J.P., Ulrich, P., 2013. Time-variable 3D ground displacements from High-Resolution Synthetic Aperture Radar (SAR). Application to La Valette landslide (South French Alps). Remote Sensing of Environment 139, 198–204.
Sakoe, H., Chiba, S., 1978. Dynamic programming algorithm optimization for spoken word recognition. IEEE Transactions on Acoustics, Speech and Signal Processing 26, 43–49.
Salembier, P., Garrido, L., 2000. Binary partition tree as an efficient representation for image processing, segmentation, and information retrieval. IEEE Transactions on Image Processing 9, 561–576.
Salembier, P., Wilkinson, M.H.F., 2009. Connected operators: A review of region-based morphological image processing techniques. IEEE Signal Processing Magazine 26, 136–157.
Stumpf, A., Kerle, N., 2011. Object-oriented mapping of landslides using random forests. Remote Sensing of Environment 115, 2564–2577. Stumpf, A., Lachiche, N., Malet, J.P., Puissant, A., 2013. Active learning in the spatial domain for remote sensing image classification. IEEE
Transactions on Geoscience and Remote Sensing (In press). doi:10.1109/TGRS.2013.2262052.
Sun, W., Heidt, V., Gong, P., Xu, G., 2003. Information fusion for rural land-use classification with High-Resolution satellite imagery. IEEE Transactions on Geoscience and Remote Sensing 41, 883–890.
Thiery, Y., Malet, J.P., Sterlacchini, S., Puissant, A., Maquaire, O., 2007. Landslide susceptibility assessment by bivariate methods at large scales: Application to a complex mountainous environment. Geomorphology 92, 38–59.
Townshend, J.R.G., Huang, C., Kalluri, S.N.V., Defries, R.S., Liang, S., Yang, K., 2000. Beware of per-pixel characterization of land cover. International Journal of Remote Sensing 21, 839–843.
Valero, S., Salembier, P., Chanussot, J., 2010. New hyperspectral data representation using binary partition tree, in: Proceedings of the IEEE International Geoscience and Remote Sensing Symposium – IGARSS, pp. 80–83.
Wemmert, C., Puissant, A., Forestier, G., Gançarski, P., 2009. Multiresolution remote sensing image clustering. IEEE Geoscience and Remote Sensing Letters 6, 533–537.
Wood, J.D., 1996. The geomorphological characterisation of digital elevation models. Ph.D. thesis. University of Leicester (UK).
Yilmaz, I., 2009. Landslide susceptibility mapping using frequency ratio, logistic regression, artificial neural networks and their comparison: A case study from Kat landslides (Tokat–Turkey). Computers & Geosciences 35, 1125–1138.