HAL Id: hal-01395538
https://hal.archives-ouvertes.fr/hal-01395538
Submitted on 31 Mar 2021
HAL is a multi-disciplinary open access archive for the deposit and dissemination of sci-entific research documents, whether they are pub-lished or not. The documents may come from teaching and research institutions in France or abroad, or from public or private research centers.
L’archive ouverte pluridisciplinaire HAL, est destinée au dépôt et à la diffusion de documents scientifiques de niveau recherche, publiés ou non, émanant des établissements d’enseignement et de recherche français ou étrangers, des laboratoires publics ou privés.
Neutron diffraction of calcium aluminosilicate glasses
and melts
Louis Hennet, James W.E. Drewitt, Daniel R. Neuville, Viviana Cristiglio,
Jad Kozaily, Séverine Brassamin, Didier Zanghi, Henry E. Fischer
To cite this version:
Louis Hennet, James W.E. Drewitt, Daniel R. Neuville, Viviana Cristiglio, Jad Kozaily, et al.. Neutron diffraction of calcium aluminosilicate glasses and melts. Journal of Non-Crystalline Solids, Elsevier, 2016, 451, pp.89 - 93. �10.1016/j.jnoncrysol.2016.05.018�. �hal-01395538�
Hennet, L., Drewitt, J. W. E., Neuville, D. R., Cristiglio, V., Kozaily, J.,
Brassamin, S., Zanghi, D., & Fischer, H. E. (2016). Neutron diffraction
of calcium aluminosilicate glasses and melts. Journal of
Non-Crystalline Solids, 451, 89-93.
https://doi.org/10.1016/j.jnoncrysol.2016.05.018
Peer reviewed version License (if available): CC BY-NC-ND
Link to published version (if available):
10.1016/j.jnoncrysol.2016.05.018
Link to publication record in Explore Bristol Research
PDF-document
This is the author accepted manuscript (AAM). The final published version (version of record) is available online via Elsevier at 10.1016/j.jnoncrysol.2016.05.018.
University of Bristol - Explore Bristol Research
General rightsThis document is made available in accordance with publisher policies. Please cite only the published version using the reference above. Full terms of use are available:
Neutron diffraction of calcium aluminosilicate glasses and melts.
Louis Henneta,1, James W.E. Drewittb, Daniel R. Neuvillec, Viviana Cristigliod, Jad Kozailye,
Séverine Brassamina, Didier Zanghia, Henry E. Fischerd,
aCNRS-CEMHTI, University of Orleans, 1d avenue de la Recherche Scientifique, 45071 Orléans cedex 2, France
bSchool of Earth Sciences, University of Bristol, Wills Memorial Building, Queens Road, Bristol, BS8 1RJ, UK
cIPGP-CNRS, Géomatériaux, Sorbonne Paris Cite, 75005 Paris, France dInstitut Laue Langevin (ILL), 6 rue Jules Horowitz, BP 156, 38042 Grenoble, France
eRafik Hariri University, P.O. Box 10, Damour-Chouf 2010, Lebanon
Abstract
The combination of neutron diffraction with aerodynamic levitation and laser heating,
pioneered by Neville Greaves and co-workers about 15 years ago, is an important tool for
studying the structure of liquid melts. Since the first work on liquid Al2O3 published in 2001,
the technique has been largely improved and experiments are now routinely performed at
neutron sources, providing interesting structural information on various materials.
In this paper, the structure of glass-forming compounds in the system CaO-Al2O3-SiO2
was measured by applying neutron diffraction with aerodynamic levitation. Results obtained
in the liquid state above the melting point and from the glass at room temperatures are
presented. Various compositions were studied by increasing the silica content and by
changing the ratio CaO/Al2O3. As observed using other methods, the main structural changes
relate to modification of the Al-O short range order.
1 Introduction
Calcium aluminosilicate, CaO-Al2O3-SiO2 (CAS), glasses and melts are of both
technological and scientific interest. In particular their good optical and mechanical properties
[1,2] and their refractory nature make them attractive for a wide range of industrial
applications, including the production of concrete [3,4]. CAS melts are also the main
components of slags produced in furnaces in coal and steel industries. In geosciences, they are
of fundamental importance as they form a significant fraction of the composition of
geological magmas [5,6,7].
The thermodynamic and dynamic properties of CAS show a strong dependence with the
microscopic structure [8]. It is, therefore, important to study in detail the high temperature
properties of the melts. In order to study the liquid state, we used the aerodynamic levitation
technique combined with CO2 laser heating. This technique was pioneered about 15 years ago
by Neville Greaves with teams from the University of Aberystwyth (UK) and the
CNRS-CEMHTI in Orléans (France) [9,10].
In this paper, we present results obtained from various CAS glass compositions at both
room temperature and in the liquid state. Some of these glass compositions have already been
studied by x-ray diffraction at room temperature [11,12] but only a few have been analyzed
by neutron diffraction, in particular along the join R=1.57 [11,13]. Here and in the following,
the R value is defined as the ratio CaO/Al2O3. In the liquid state only the compositions
without silica have been studied extensively [14,15]. Our first results obtained for CAS
liquids with low silica content have been reported recently in combination with Molecular
Dynamics (MD) simulations. [16]. A recent work is also devoted to the study of CAS slags
with other compositions [17]. The objective of the present investigation is to complete these
order to better understand the structure of the glasses and melts, in relation with the observed
properties.
2 Technical details
2.1 Sample preparation
The samples were prepared from high purity crystalline CaCO3, Al2O3 and SiO2
powders. The appropriate quantities of powders were melted at 1600°C for 4 hours in a
platinum crucible and then quenched to room temperature. The resulting materials were
grinded and re-melted several times in order to ensure a good homogeneity of the glasses. A
full description of the sample preparation is described in Neuville et al. [18]. The required
quantity of material for each sample was then levitated in air using an argon-oxygen (~3%)
gas flow and melted by laser heating. Rapid quenching, achieved by switching off the laser
power, resulted in the formation, on cooling, of solid spherical samples with diameters of
4 mm (for the glass measurements) and 2.7 mm (to investigate the liquid state under
levitation). The samples studied are listed in Table I. As in previous works, we employ the
notation Cax.y, where x and y refer to the molar concentration of SiO2 and Al2O3,
respectively, and 1-x-y is the CaO molar content. The precise molar compositions of the
glasses are reported in Neuville et al [7,19].
2.2 Neutron diffraction
The neutron diffraction (ND) measurements were made using the aerodynamic
levitation and laser heating device installed on the D4C diffractometer [20] at the Institut
Laue–Langevin (Grenoble, France), as described in ref [21]. Diffraction measurements were
taken for the liquid samples at temperatures above the melting point for all studied
compositions, for the empty levitation device inside the diffraction chamber, and for
vanadium samples with the aim of making an absolute normalization of the scattering
fitting the positions of the Bragg peaks obtained from a reference nickel sample. The neutron
wavelength used during the experiment was 0.4969 Å, giving a scattering vector Q-range of
0.3-23.6 Å-1. The data processing was performed using the program CORRECT [22] which corrects the data for attenuation, background, multiple scattering and inelasticity (Placzek)
effects. Since, for various technical reasons, there can be appreciable uncertainties with
respect to the relative beam-illuminated volumes of the vanadium samples compared to the
CAS samples using the levitation technique, we found it more accurate and reliable to
perform an auto-normalization of the scattered intensity from the CAS samples. Specifically,
the high-Q asymptote of the sample's intensity (after accounting for the Placzek inelasticity
effect) was scaled so as to be equal to the theoretical self-scattering that depends only on the
known composition of the sample. We then also confirmed that the atomic number density
required for accurate normalization of the r-space function G(r) (see equation in section 3.2)
was equal to the theoretical atomic number density, thereby acting as an r-space consistency
check of our auto-normalization performed in Q-space.
3 Experimental results
3.1 Structure factors
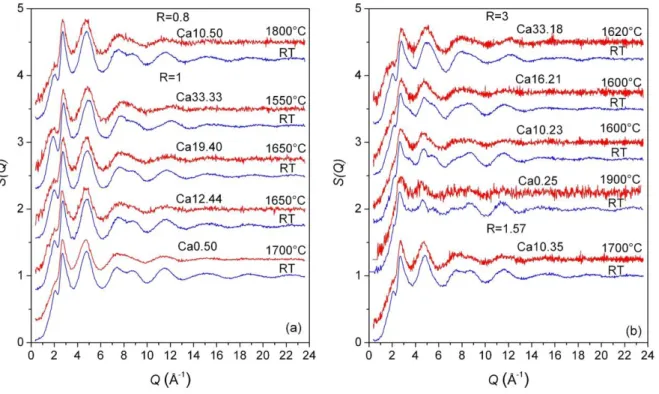
The total structure factors S(Q) of all studied samples at room temperature and in the
liquid state are presented in figure 1. For all compositions, room and high temperature
measurements are very similar with only a few differences due principally to thermal effects
which increase the structural disorder. This means that the short range order is very close in
the glasses and melts. As observed for the compositions along the composition lines R=1 and
3, by increasing the SiO2 content, the first peak (FSDP) in S(Q) shifts towards lower Q
values with a higher intensity. This shows that the degree of intermediate-range order, higher
are less visible in the liquid state, they seem to be at the same positions found for the glasses
and the same Q shift is observed with increasing SiO2 content.
Figure 1. Total structure factors S(Q) of the CAS glasses and liquids for R=0.8 and 1 (a) and R=1.57 and 3 (b). The liquid temperatures are reported in the figure.
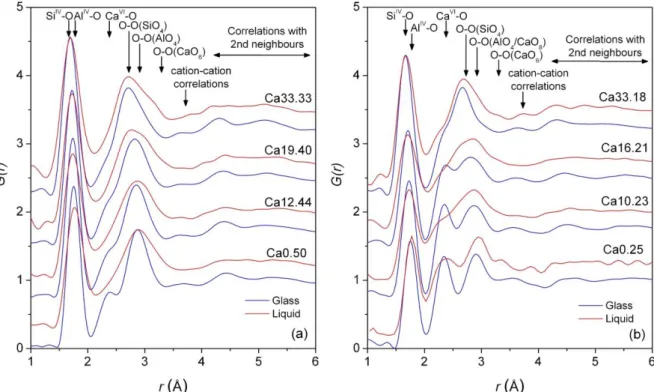
3.2 Pair distribution functions
The total pair distribution function is calculated from the structure factor by the Fourier
transform:
0 0 2 [ ( ) 1] sin( )d 2 1 1 ) ( S Q Q Qr Q r r G ,where 0 denotes the atomic number density. All values are listed in Table 1. For
glasses they were calculated using densities measured with the Archimedean method applying
toluene as immersion liquid [7,23]. For melts, they were derived from densities determined by
Figure 2. Total pair distribution functions G(r) for the CAS glasses and liquids along the composition lines R=1 (a) and R=3 (b). The positions of the various O-O correlations, as calculated assuming SiO4 and AlO4 tetrahedra and CaO6 octahedra, are shown as a guide. The
oscillations above r=4 Å arise from correlations between second neighbours.
Figure 2 shows the total pair distribution functions G(r) for all the compositions studied
along the joins 1 and 3.
The calcium aluminate compositions Ca0.50 and Ca0.25 have previously been studied
in detail using neutron and x-ray scattering techniques in combination with MD and RMC
simulations [14,25]. For these two compositions, the first peak found respectively at 1.76 and
1.74Å in the glass arises purely from the contribution of the nearest neighbour Al-O
correlations. On melting, the observed shift of its position towards higher values is
characteristic of an increase of the proportion of AlO5 units in the structure (see data reported
in Table I). In all G(r)s, the peak at around 2.3-2.35 Å arises from Ca-O bonds and is less
resolved in the melt. In particular, the Ca-O peak broadens in the Ca0.25 composition and
becomes barely resolvable from the next O-O correlations in the Ca0.50 melt, thus
[26], which combined with the use of MD simulations, provides much more detailed
structural information on the Ca-O coordination environment.
With the introduction of silica, the first peak corresponds to an overlapped contribution
from both the Al-O and the Si-O nearest neighbour pairs. Its position moves gradually toward
the Si-O bond distance as the SiO2 content is increased. It becomes more difficult to
determine the respective contributions of the Si-O and Al-O bonds, and the Ca-O correlations
are also affected by the associated increase of the O-O contribution from SiO4 tetrahedra that
largely overlaps the peak and make the analysis more difficult. For composition along the join
R=1.57, a detailed structural study have been made using x-ray and neutron diffraction
experiment [13] and with Reverse Monte Carlo and MD simulations [27].
NMR experiments performed on all these glass compositions show that Al is 4-fold
coordinated along the join R=3 up to 20% silica content and with small amounts of AlO5
units above and along the join R=1 (values are reported in table I for all compositions) [19].
For all liquids, only a small enlargement is observed on the high r side of the first peak. This
is in accordance with an increase of the number of the AlO5 units observed to elongate the
Al-O distance in the Ca0.50 melt [26]. With CAS compounds, cation-cation correlations
contribute much less to the total G(r) than cation-O bonds and give rise only to small features
found around 3.5 Å.
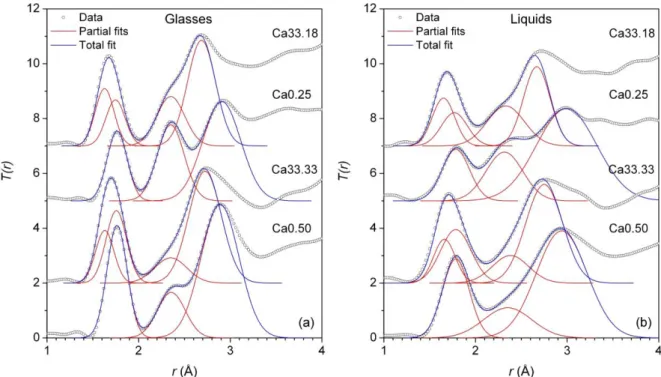
The determination of the coordination numbers and bond distances is performed using a
Gaussian fit to the correlation function T(r)=4r0g(r) as described in Hannon and Parker
[28]. Results of the fits are presented in figure 3 for glasses (a) and melts (b). In each case,
only the two extreme compositions along the lines R= 1 and 3 are presented. The complete
results are summarized in table I.
For the silicate samples, the Gaussian fit was performed by fixing the coordination
1.65 Å in the liquid state. For all samples, the average coordination numbers of Al–O bonds
are found to be around 4 in accordance with NMR results [19]. Assuming perfect tetrahedra
(angle of 109.47), it is possible to estimate the O-O bond length for SiO4 and AlO4 as 2.62
and 2.83 Å, respectively, in the glass. The Ca-O distance found around 2.32 Å is
characteristic of 6-fold coordinated Ca as found in previous works [13,14,16,30]. Considering
perfect CaO6 octahedra, an O-O distance of 3.28 Å is calculated (2.32 x √2). The positions of
these three calculated O-O bond distances are indicated in figure 2. This shows that the shape
of the wide O-O correlations which give distances between 2.5 and 3.5 Å can be reasonably
described by the contribution of these 3 pairs. However, higher coordinated Ca found in
previous works [13,29] would give rise to O-O correlations at positions between those for
AlO4 and CaO6 polyhedra and cannot be excluded. Indeed, the Ca-O correlations for 7- and
8-fold coordinated Ca are expected around 2.4 and 2.5 Å and if present they are thus difficult to
resolve.
As seen previously, accurate information about the Ca-O local structure is difficult to
obtain due to large overlapping contributions from the O-O correlations and temperature
effects which broaden the peaks. This precludes the determination of Ca-O coordination
number from our total structure measurements. By comparison to XANES experiments at the
Ca-Kedge, Ca was estimated to be in regular 6-fold coordination in C3A glass (Ca0.25),
7-fold coordination in CA (Ca50.00) with localized 6- to 7-7-fold coordination sites in CAS
glasses [18,30]. A recent NDIS study of the Ca50.00 composition found a Ca coordination
number of 6.2 in the liquid state and around 6.4 in the glass [26]. This shows that the use of
more selective techniques than conventional ND are important in order to more precisely
determine the atomic arrangement around Ca atoms. Recently, NDIS experiments have been
Figure 3. Total correlation function T(r) for the compositions bearing 0 or 33% of SiO2 along
the joins R=1 and 3 for glasses (a) and melts (b). The partial fits and the final result are compared with the experimental data.
4 Discussion
As shown in various papers [26,29,30], the Ca0.25 glass (R=3) has a structure
composed by tetrahedraly coordinated Al, Q2 species with 2 bridging (BO) and 2 non-bridging (NBO) oxygen atoms, and Ca in a regular six fold coordination. With increasing the
Al2O3 content, Al changes from Q2 to a mixture of Q3 and Q4 species for Ca0.39 (R=1.57)
[27] and Q4 in the Ca0.50 glass (R=1) associated to some proportion of AlO5 units to ensure
the cationic mobility as shown in [19,30]. This change in the Q species distribution implies a
decrease of the number of NBO leading to the observed increase of the viscosity with the
Al2O3 content [30].
With adding silica along the join R = 3, the distribution of Al into Q species increases
also from Q2 to Q4 for the Ca23.21 (not studied in this paper) as shown in Al NMR, Raman
spectroscopy and XANES at the Al K-edge [19]. In this case, the increase of the SiO2 content,
species and concentrate all NBOs around them. For the Ca33.18 composition, the Q species of
Si increase from Q0 to Q1 whereas Al Q species stay in Q4 and some AlO5 units appears. Along the join R=1, which is the charge compensation line, the glasses are then fully
polymerised and by using XANES experiments at the Ca absorption edge, Neuville et al
explained the evolution of the FSDP by an increase of the ring size from 4 to 5 members for
low and high silica content [18]. When R is increased, Ca atoms play the role of network
modifiers with the creation of NBOs leading to less ordered structure.
In the silicate glasses, the first peak in G(r) is a weighted sum of the Si-O and Al-O
correlations. By fixing the tetrahedral configuration of the SiO4 units during the fit to T(r), it
is possible to derive reasonable Al-O bond lengths of 1.74-1.76 Å and 1.76-1.78 Å in the
glasses and melts, respectively. The Al-O coordination numbers are slightly higher in the
melts, reflecting an increased proportion of AlO5 units for most of the compositions. It can be
noted that with an error bar of ± 0.5 neutron scattering technique is not sensitive enough to
reproduce the evolution of the coordination numbers determined with NMR at room
temperature (see table I). For Ca0.25, if the distance Al-O at room temperature found at 1.74
Å is characteristic of purely 4-fold coordinated Al in accordance with the amount of AlO5
(Table1), the found coordination number of 4.2 is a bit high, although it is within the error bar
of ±0.5. This could be explained with a possible small influence of the Ca-O correlation
(highest concentration) but more probably by an overestimation of the density, measured on a
sample using a different cooling rate. New density measurements will be performed directly
on the measured sample and ongoing x-ray scattering experiment on theses glass
compositions will also enable to conclude. At high temperatures, there is no precise
determination of the AlO5 content and the main results come from MD simulation (some of
them are reported in Table I). For C3A, one can see that different values can be obtained,
The study of Ca-O correlations is more difficult due to large overlapping O-O
contributions. From a simple Gaussian fit, it seems that the bond distances (summarized in
Table I) and thus the coordination number, doesn’t change by increasing the silica content
along the joins R=1 and 3. Depending on the temperature and the composition, the Ca-O
coordination number is then expected to be between 6 and 7 by comparison with a previous
study [26,30]. However, a more sophisticated fit including all contributions is needed to get
more accurate information on the Ca-O correlation and take into account existing Ca with
higher coordination.
The small effect of the increase of the silica content was also observed by Cormier et al
along the join R=1.57 [13,27]. They found that even at low silica contents, silicon becomes
part of the aluminate network and thus attributed the changes observed on the dynamics to
structural rearrangements at medium range order.
The large number of atomic pairs in the CAS system complicates the data analysis. In
order to have a full description of the short range order for these compositions, additional high
temperature EXAFS measurements at the Ca-K absorption edge would be useful. Indeed,
existing works are limited to very few melt compositions [30]. Using diffraction, it is
necessary to use more selective techniques. The Ca X-ray absorption edge at 4.038 keV
precludes the use of anomalous scattering experiments as performed with liquid Y2O3 [32].
NDIS is then a good solution, despite the long counting times required due to the relatively
small size of the levitated spheres.
In addition of these experimental techniques, interesting information can be also derived
from MD and/or RMC simulations. Drewitt et al studied various calcium aluminate melts
including Ca0.50 and Ca0.25 [14]. From these simulations, they derived information about
the distribution of coordination numbers for Ca and Al and the various bond angle
distributions provide insight into the connectivity of polyhedra. L. Cormier et al studied in
informationthey got also information on the ring statistics, the distribution of the Q species,
the number of NBOs, or the existence of triclusters. This interplay between triclusters, NbOs
and AlO5 units was also studied by MD simulation for the low silica content composition
along the join R=1 [16] enabling to derive also valuable information on the dynamics [33].
5 Conclusion
This study shows that the use of neutron diffraction combined with levitation techniques
is an important tool for deriving structural information from liquid materials and to obtain
useful information about coordination numbers and bond lengths.
In this work we showed that limited structural changes are observed by increasing the
ratio CaO/Al2O3 or the SiO2 content in CAS glasses. At high temperatures a small increase in
the Al-O coordination number is observed. This is due to the presence of a larger fraction of
AlO5 units. The short range order around Ca remains almost unchanged over the whole
composition range studied. These observations are in good agreement with previous results
obtained with other techniques. The combination of these results with simulations will make it
possible to derive reliable information in the liquid state and in particular about the dynamics.
Acknowledgements
We thank Alain Bertoni for help with the diffraction experiments and the Institut
Laue-Langevin for the beamtime allocation. We also thank the French National Research Agency
R T (°C) 0 (Å-3) rSi-O ± 0.02 Å rAl-O ± 0.02 Å rCa-O ± 0.05 Å CNSi-O ± 0.5 CNAl-O ± 0.5 AlO5 units Ca10.50 0.8 RT 0.0783 1.62 1.75 2.32 4.04 4.09 4.2% 1800 0.0745 1.65 1.76 2.34 4.05 4.26 / Ca0.50 1 RT 0.0773 / 1.75 2.35 / 4.05 3.5% 1700 0.0734 / 1.78 2.32 / 4.20 15%,18% [14,25] Ca12.44 1 RT 0.0772 1.62 1.76 2.34 4.02 4.07 4.5% 1650 0.0737 1.65 1.77 2.32 4.05 4.18 10% [33] Ca19.40 1 RT 0.0773 1.62 1.76 2.34 4.08 4.05 5.8% 1650 0.0737 1.65 1.77 2.34 4.05 4.10 8% [33] Ca33.33 1 RT 0.0770 1.62 1.75 2.34 4.05 4.06 8% 1550 0.0735 1.65 1.77 2.36 4.05 4.23 / Ca10.35 1.57 RT 0.0758 1.62 1.76 2.35 4.04 4.11 2.6% 1700 0.0716 1.65 1.77 2.32 4.05 4.15 1.2 [27] Ca0.25 3 RT 0.0723 / 1.74 2.34 / 4.20 0% 1900 0.0632 / 1.77 2.32 / 4.20 5%;10% [14,34] Ca10.23 3 RT 0.0736 1.62 1.75 2.34 4.02 4.05 0% 1600 0.0684 1.65 1.77 2.30 4.05 4.18 / Ca16.21 3 RT 0.0744 1.62 1.75 2.34 4.08 4.09 0% 1600 0.0691 1.65 1.76 2.30 4.04 4.20 / Ca33.18 3 RT 0.0759 1.62 1.74 2.34 4.05 4.12 7% 1620 0.0703 1.65 1.76 2.32 4.05 4.19 /
Table I Summary of the structural parameters for all samples. The join composition is indicated as well as the proportion of AlO5 units in glasses determined by NMR [19] and melts from MD simulations.
References
1 M. E. Lines, J. B. MacChesney, K. B. Lyons, A. J. Bruce, A. E. Miller, and K. Nassau, J.
Non-Cryst. Solids 107 (1989) 251-260
2 F. T. Wallenberger and S. D. Brown, Compos. Sci. Technol. 51 (1994) 243-263
3 F. Puertas, A. Fernandez-Jimenez, Cement Concrete Comp. 25 (2003) 287-292
4 C. Li, H. Sun, L. Li, Cement Concrete Res. 40 (2010) 1341-1349
5 S. Jahn, P. Madden, Phys. Earth Planet. In. 162 (2007) 129-139
6 N. De Koker, Geochim. Cosmochim. Acta. 74 (2010) 5657 –5671
7 D. R. Neuville, L. Cormier and D. Massiot, Geochim. Cosmochim. Acta, 68 (2004)
5071-5079
8 B. O. Mysen, Structure and Properties of Silicate Melts, Elsevier, Amsterdam, 1988
9 C. Landron, L. Hennet, J. P. Coutures, T. Jenkins, C. Aletru, N. Greaves, A. K. Soper, and
G. Derbyshire, Rev. Sci. Instrum. 71 (2000) 1745-1751
10 C. Landron, L. Hennet, T. Jenkins, N. Greaves, J. P. Coutures, A. K. Soper, Phys. Rev.
Lett. 86 (2001) 4839-4842
11 L. Cormier, D. R. Neuville, G. Calas, J. Am. Ceram. Soc. 88 (2005) 2292–2299
12 V. Petkov, S. J. L. Billinge, S. D. Shastri, and B. Himmel, Phys. Rev. Let. 86 (2000)
3436-3439
13 L. Cormier, D.R. Neuville, G. Calas, J. Non-Cryst Solids 274 (2000) 110-114
14 J. W. E. Drewitt, S. Jahn, V. Cristiglio, A. Bytchkov, M. Leydier, S. Brassamin, H. E.
Fischer, L. Hennet, J. Phys. Cond. Mat. 23 (2011) 155101
15 L. Hennet, I. Pozdnyakova, A. Bytchkov, D. L. Price, G. N. Greaves, M. Wilding, S.
Fearn, C. M. Martin, D. Thiaudière, J.-F. Bérar, N. Boudet, M.-L. Saboungi, J. Chem. Phys.
16 N. Jakse, M. Bouhadja, J. Kozaily, J. W. E. Drewitt , L. Hennet, D. R. Neuville, H. E.
Fischer, V. Cristiglio, A. Pasturel, Appl. Phys. Lett. 101 (2012) 201903
17 M. Liu, A.Jacob, C. Schmetterer, P.J. Masset, L. Hennet, H.E. Fischer, J. Kozaily, S.Jahn,
A. Gray-Weale, J. Phys. Cond. Mat., 28 (2016) 135102.
18 D. R. Neuville, L. Cormier, A. M. Flank, V. Briois and D. Massiot, Chem. Geol. 213
(2004) 153-163
19 D. R. Neuville, L. Cormier, D. Massiot, Chem. Geol. 229 (2006) 173-185
20 H. E. Fischer, G. J. Cuello, P. Palleau, D. Feltin, A. C. Barnes, Y. S. Badyal, J. M.
Simonson, Appl. Phys. A 74 (2002) S160-S162
21 L. Hennet, I. Pozdnyakova, A. Bytchkov, V. Cristiglio, P. Palleau, H. E. Fischer, G. J.
Cuello, M. R. Johnson, P. Melin , D. Zanghi , S. Brassamin , J.-F. Brun, D. L. Price, M.-L.
Saboungi, Rev. Sci. Instrum. 77 (2006) 053903
22 M.A. Howe, R. L. McGreevy, P. Zetterström P, NFL Studsvik Internal Report CORRECT:
a correction programme for neutron diffraction data (1996)
23 D.R. Neuville, Private communication.
24 P. Courtial and D. B. Dingwell, Geochim. Cosmochim. Acta 59 (1995) 3685-3695
25 V. Cristiglio, L. Hennet, G. J. Cuello, I. Pozdnyakova, M. Leydier, J. Kozaily, H. E.
Fischer, M. R. Johnson, D. L. Price, J. Non-Cryst. Solids 356 (2010) 2492-2496
26 J. W. E. Drewitt, L. Hennet, A. Zeidler, S. Jahn, P. S. Salmon, D. R Neuville, H. E.
Fischer, Phys. Rev. Lett. 109 (2012) 235501
27 L; Cormier,D. Ghaleb, D.R. Neuville, J.M. Delaye, G. Calas, J. Non-Crystal. Solids. 332,
(2003) 255-270.
28 A.C. Hannon, J.M. Parker, J. Non-Cryst. Solids 274 (2000) 102-109
30 D.R. Neuville, L. Cormier, A.M. Flank, D. de Ligny, J. Roux, P Lagarde, Am. Min. 93
(2008) 228-234
31 J. W. E. Drewitt, A. C. Barnes, S. Jahn, S. C. Kohn, M. J. Walter, A. Novikov, D. R.
Neuville, H. E. Fischer, L. Hennet In Prep. (2016)
32 L. Hennet, D. Thiaudière, C. Landron, P. Melin, D. L. Price, J.-P. Coutures, J.-F. Bérar,
M.-L. Saboungi, Appl. Phys. Lett. 83 (2003) 3305-3307
33 M. Bouhadja, N. Jakse, and A. Pasturel, J. Chem. Phys. 138 (2013) 224510
![Table I Summary of the structural parameters for all samples. The join composition is indicated as well as the proportion of AlO5 units in glasses determined by NMR [19] and melts from MD simulations](https://thumb-eu.123doks.com/thumbv2/123doknet/14792322.601948/15.892.107.792.144.539/summary-structural-parameters-composition-indicated-proportion-determined-simulations.webp)
