HAL Id: hal-02067818
https://hal.archives-ouvertes.fr/hal-02067818
Submitted on 14 Feb 2020HAL is a multi-disciplinary open access archive for the deposit and dissemination of sci-entific research documents, whether they are pub-lished or not. The documents may come from teaching and research institutions in France or abroad, or from public or private research centers.
L’archive ouverte pluridisciplinaire HAL, est destinée au dépôt et à la diffusion de documents scientifiques de niveau recherche, publiés ou non, émanant des établissements d’enseignement et de recherche français ou étrangers, des laboratoires publics ou privés.
on Yield, Chemical Composition, and Mechanism
Laura Chiappini, Emilie Perraudin, Nicolas Maurin, Benedicte
Picquet-Varrault, Wuyin Zheng, Nicolas Marchand, Brice Temime-Roussel,
Anne Monod, Annaïg Le Person, François Bernard, et al.
To cite this version:
Laura Chiappini, Emilie Perraudin, Nicolas Maurin, Benedicte Picquet-Varrault, Wuyin Zheng, et al.. Secondary Organic Aerosol Formation from Aromatic Alkene Ozonolysis: Influence of the Pre-cursor Structure on Yield, Chemical Composition, and Mechanism. Journal of Physical Chemistry A, American Chemical Society, 2019, 123 (7), pp.1469-1484. �10.1021/acs.jpca.8b10394�. �hal-02067818�
Secondary Organic Aerosol Formation from Aromatic Alkene Ozonolysis:
Influence of the Precursor Structure on Yield, Chemical Composition and
Mechanism
L. Chiappini1, E. Perraudin1,4, N. Maurin1, B. Picquet-Varrault1, W. Zheng2, N.
Marchand2, B. Temime-Roussel2, A. Monod2, A. Le Person3,5, F. Bernard3, G.
Eyglunent2,3, A. Mellouki3, J.-F. Doussin1
1Laboratoire Interuniversitaire des Systèmes Atmosphériques (LISA), UMR7583, CNRS,
Université Paris-Est-Créteil (UPEC) et Université Paris Diderot (UPD), Institut Pierre Simon Laplace (IPSL), Créteil, France
2Aix-Marseille Université, CNRS, LCE UMR 7376, 13331, Marseille, France
3ICARE (Institut de Combustion, Aérothermique, Réactivité et Environnement) CNRS (Centre
National de la Recherche Scientifique) – UPR3021, 1C, Avenue de la recherche scientifique, 45071 Orléans cedex 02, France
4Now at EPOC, UMR 5805, University of Bordeaux, CNRS, Allée Geoffroy Saint-Hilaire,
33615 Pessac Cedex, France
5Now at Univ. Lille, CNRS, UMR 8516 - LASIR - Laboratoire de Spectrochimie Infrarouge et
Raman, F-59000 Lille, France
Correspondence to: E. Perraudin (+33 5 4000 2476 ; emilie.perraudin@u-bordeaux.fr)
2 3 4 5 6 7 8 9 10 11 12 13 14 15 16 17 18 19 20 21 22 23 24 25 26 27 28 29 30 31 32 33 34 35 36 37 38 39 40 41 42 43 44 45 46 47 48 49 50 51 52 53 54 55 56 57 58 59 60
Abstract
The influence of the precursor chemical structure on secondary organic aerosol (SOA) formation was investigated through the study of the ozonolysis of two anthropogenic aromatic alkenes: 2-methylstyrene and indene. Experiments were carried out in three different simulation chambers: ICARE 7300L FEP Teflon chamber (ICARE, Orléans, France), EUPHORE FEP Teflon chamber (CEAM, Valencia, Spain) and CESAM evacuable stainless steel chamber (LISA, Créteil, France). For both precursors, SOA yield and growth were studied on a large range of initial concentrations (from ~60 ppbv to 1.9 ppmv) and the chemical composition of both gaseous and particulate phases was investigated at a molecular level. Gas-phase was described using FTIR spectroscopy and on-line gas chromatography coupled to mass spectrometry and particulate chemical composition was analysed i) on-line by thermo-desorption coupled to chemical ionisation mass spectrometry (TD-API-AMS) and ii) off-line by supercritical fluid extraction coupled to gas chromatography and mass spectrometry (SFE-GC-MS). The results obtained from a large set of experiments performed in three different chambers and using several complementary analytical techniques were in very good agreement. SOA yield was up to 10 times higher for indene ozonolysis than for methylstyrene ozonolysis at the same reaction advancement. For 2-methylstyrene ozonolysis, formaldehyde and o-tolualdehyde were the two main gaseous phase products while o-toluic acid was the most abundant amongst six products detected within the particulate phase. For indene ozonolysis, traces of formic and phthalic acids, as well as eleven species were detected in the gaseous phase and eleven other products were quantified in the particulate phase, where phthaldialdehyde was the main product. Based on the identified products, reaction mechanisms were proposed that highlight specific pathways due to the precursor chemical structure. These mechanisms were finally compared and discussed regarding SOA formation. In the case of 2-methylstyrene ozonolysis, ozone adds mainly on the external and substituted double bond, yielding only one C8- and mono-functionalized Criegee intermediate and hence more volatile products as well as lower SOA mass than indene ozonolysis in similar experimental conditions. In the case of indene, ozone adds mainly on the five-carbon-ring and di-substituted C=C double bond, leading to the
2 3 4 5 6 7 8 9 10 11 12 13 14 15 16 17 18 19 20 21 22 23 24 25 26 27 28 29 30 31 32 33 34 35 36 37 38 39 40 41 42 43 44 45 46 47 48 49 50 51 52 53 54 55 56 57 58 59 60
formation of two C9- and bi-functionalized Criegee intermediates, which then evolve via different pathways including the hydroperoxide channel and form highly condensable first-generation products.
1. Introduction
Airborne particles influence visibility, cloud formation, light absorption and scattering, and thus they play a key role on climate (IPCC, 2013).1 Particle impacts on health have been
observed and confirmed for many years now by epidemiologic studies showing the influence of their size.2-5 Secondary organic aerosol (SOA) is formed in the atmosphere by gas-particle
partitioning of semi- or low volatile oxidation products of volatile organic compounds (VOCs) and accounts for a significant fraction of tropospheric fine aerosol, in remote areas as well as in urban areas.6,7
It is critical for atmospheric modelling to describe SOA formation and understand processes at the molecular level since aerosol impacts on health and climate are tightly linked to chemical composition. The need for reliable mechanisms describing SOA formation was reported by landmark reviews8-11 and more recent papers, as only incomplete or
oversimplified schemes are yet available.12-15 This implies the investigation of the parameters
influencing SOA formation. The precursor molecular structure, since it controls the oxidation mechanisms and hence the nature of the secondary products, is one of these key parameters. As an example, Bonn et al. observed that aerosol formation yields highly depend on the location of the C=C double bond: SOA yields are higher for -pinene (endocyclic double bond) than for -pinene (exocyclic double bond) ozonolysis.16 A few other
studies have also investigated the influence of the hydrocarbon structure on SOA formation yields. Keywood et al. investigated a series of cycloalkenes ozonolysis and found that (i) SOA yields increase with increasing number of carbons in the cycloalkane ring, (ii) SOA yields are enhanced by the presence of a methyl group located at a C=C double-bonded site but reduced by the presence of a methyl group at a non-double-bonded site.17 Ng et al.
reported that, for a large set of terpenes, regardless of the reaction systems (ozonolysis or
2 3 4 5 6 7 8 9 10 11 12 13 14 15 16 17 18 19 20 21 22 23 24 25 26 27 28 29 30 31 32 33 34 35 36 37 38 39 40 41 42 43 44 45 46 47 48 49 50 51 52 53 54 55 56 57 58 59 60
photooxidation), precursors can be classified into two groups : (i) compounds with only one C=C double bond, for which the first oxidation step is rate-limiting and aerosols are formed mainly from low volatility first-generation oxidation products and (ii) compounds with more than one double bond, for which the second oxidation step may also be rate-limiting and second-generation products contribute substantially to SOA growth.18
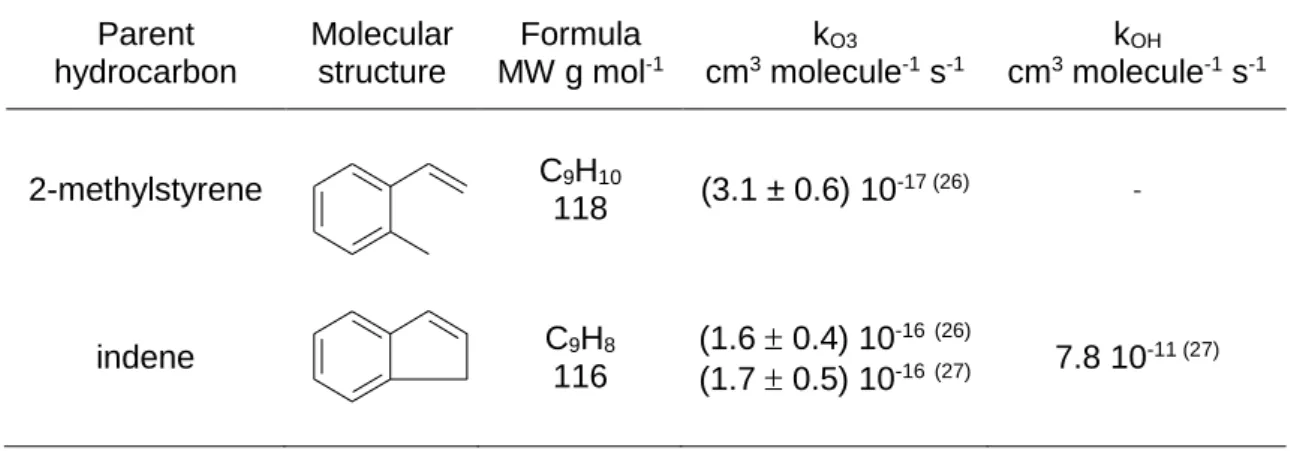
To further investigate the influence of the precursor structure on SOA formation arising from anthropogenic precursors, this study focuses on the ozonolysis of two mono-aromatic compounds bearing an additional external and conjugated unsaturation available to react with ozone: 2-methylstyrene and indene (Table 1). These two compounds both exhibit very similar structures, they only differ by the structural configuration of the reactive C=C double bond which is involved in a cycle (indene) or not (2-methylstyrene). These two VOCs were detected in the atmosphere19 and were found to be emitted by biomass burning20-23 and
automobile exhausts.24,25
Table 1. Molecular Structures and Reactivity Rate Constants of the Aromatic Alkenes Parent hydrocarbon Molecular structure Formula MW g mol-1 kO3 cm3 molecule-1 s-1 kOH cm3 molecule-1 s-1 2-methylstyrene C9H10 118 (3.1 ± 0.6) 10 -17 (26) -indene C9H8 116 (1.6 0.4) 10-16(26) (1.7 0.5) 10-16(27) 7.8 10 -11 (27)
This work focuses for the first time on the formation of SOA from the ozonolysis of 2-methylstyrene and indene and investigating the role of their structure and product formation pathways on SOA formation. The experiments were performed using three different simulation chambers: ICARE 7300L FEP Teflon chamber (ICARE, Orléans, France), EUPHORE FEP Teflon chamber (CEAM, Valencia, Spain) and CESAM evacuable stainless steel chamber (LISA, Créteil, France). The interest of the present work lies in the description of the gaseous and particulate phase chemical composition at the molecular level and in the
2 3 4 5 6 7 8 9 10 11 12 13 14 15 16 17 18 19 20 21 22 23 24 25 26 27 28 29 30 31 32 33 34 35 36 37 38 39 40 41 42 43 44 45 46 47 48 49 50 51 52 53 54 55 56 57 58 59 60
reaction pathways proposed for each compound identified in the aerosol. The comparison of ozonolysis mechanisms for 2-methylstyrene and indene allows for discussion of aerosol formation and chemical composition related to the precursor chemical structure.
2. Experimental section 2.1. Chemicals and gases
2-Methylstyrene (95 % purity), indene (99 % purity), o-tolualdehyde (99 % purity), benzoic acid (> 99.5 % purity), phenyl formate (95 % purity), 2-acetylbenzoic acid (98 % purity), 3-hydroxybenzaldehyde (> 97 % purity), phthalic acid (99 % purity), 3-hydroxy benzoic acid (99 % purity) and BSTFA (N,O bis(trimethylsilyl)trifluoroacetamide containing 1% trimethylchlorosilane) were purchased from Sigma Aldrich. Tridecane (purity > 97 %) and 2-methylphenol (> 99 %) and 1,3-dioxolane (99%) were purchased from Fluka. Sabinaketone was synthesized in MEREIA group in LISA (Créteil, France).
Purified air was used for ICARE and EUPHORE chamber experiments, whereas a mixture of N2 produced from evaporation of pressurized liquid nitrogen (Air Liquide) and O2 (Alphagaz
1, Air Liquide) was used for CESAM chamber experiments. Helium (alphagaz 1), methane (N45), SF6 (0.9997), and CO2 (SFE-grade) were purchased from Air Liquide.
Dichloromethane (HPLC grade) was purchased from Prolabo.
2.2. Simulation chamber experiments and SOA production
In order to account for possible wall effects on SOA yields or composition and to take advantage of the diversity of various analytical environments, three different chambers were used for this study. Two of them, ICARE and EUPHORE chambers, are made of FEP Teflon film (with surface to volume (S/V) ratios of 3.2 and 0.66 m-1 respectively) and the third one is
a stainless steel evacuable chamber, CESAM (S/V = 4.3 m-1). The main characteristics of
each chamber are provided in Table 2. A more complete description of these installations has been previously reported in the literature by Le Person et al. for the ICARE chamber26,
Klotz et al. and Martin-Reviejo and Wirtz, for the EUPHORE chamber28,29 and Wang et al. for
the CESAM chamber.30 2 3 4 5 6 7 8 9 10 11 12 13 14 15 16 17 18 19 20 21 22 23 24 25 26 27 28 29 30 31 32 33 34 35 36 37 38 39 40 41 42 43 44 45 46 47 48 49 50 51 52 53 54 55 56 57 58 59 60
In the following paragraphs, 2-methylstyrene and indene are referred to as MeS and Ind. ICARE, EUPHORE and CESAM chambers are referred to as I, E and C, respectively. Hence, experiments are named according to the precursor, the chamber and the number of the experiment (e.g. Ind_E1 is experiment # 1 performed in EUPHORE chamber with indene as precursor).
All instruments used for gaseous phase and particulate phase characterisation are listed in Table 2. Gases were analysed using ozone UV absorption monitor, FTIR spectroscopy as well as on-line gas chromatography coupled to mass spectrometry (GC-MS) and off-line liquid chromatography coupled to mass spectrometry (LC-MS) after sampling with DNPH cartridges for carbonyl compound analysis specifically (see SI1 for details). Gas phase product yields were obtained by plotting product concentrations as a function of consumed parent hydrocarbon (HC) ([products] = f([HC]). Hence, average product yields could be determined from the linear least-square regression of experimental data. The particulate phase was physically characterized using Scanning Mobility Particle Sizer (SMPS) and a Tapered Element Oscillating Microbalance monitor (TEOM) and chemically described by on-line thermo-desoprtion – Atmospheric Pressure Ionisation – Aerosol Mass spectrometry (TD-API-AMS)31 and off-line supercritical Fluid Extraction coupled to Gas Chromatography and
Mass spectrometry (SFE-GC-MS) after sampling on filters (GF/F, 47 mm, Whatman).32
The amount of reacted hydrocarbon varied from ~ 60 ppbv to ~ 1.9 ppmv for 2-methylstyrene and from ~ 80 ppbv and ~ 0.9 ppmv for indene. All experiments were performed under dry conditions (%RH < 5%). No radical scavenger or seed aerosol was used. During MeS_I3 and Ind_I2 experiments only, 1,3-dioxolane (2 ppmv) was used as OH tracer. Experimental conditions are reported in Table 2, as well as the order of reactant introduction. More details on SOA formation experimental procedures and instrument parameters are provided in the Supporting Information (SI2.).
2 3 4 5 6 7 8 9 10 11 12 13 14 15 16 17 18 19 20 21 22 23 24 25 26 27 28 29 30 31 32 33 34 35 36 37 38 39 40 41 42 43 44 45 46 47 48 49 50 51 52 53 54 55 56 57 58 59 60
7
Table 2. Initial Experimental Conditions and SOA Formation Yields
Simulation chamber Parent hydrocarbon Exp
# [HC]0 (ppbv) [O3]0 (ppbv) T (K) [HC] (µg m-3) MO (µg m-3) YSOA (%)
ICARE (a), (d), (e) 2-methylstyrene MeS_I1 900 (g) 870 2982 4340250 - -
ICARE (a), (d), (e) 2-methylstyrene MeS_I2 1900 (g) 820 2982 5020250 - -
ICARE (a), (d), (e) 2-methylstyrene MeS_I3 1700 (g) 670 (h) 2962 4530250 - -
CESAM (c) 2-methylstyrene MeS_C1 948 (f) 58 2941 17020 2.60.5 1.50.2
CESAM (c) 2-methylstyrene MeS_C2 948 (f) 148 (i) 2941 58020 14.20.5 2.40.1
CESAM (c) 2-methylstyrene MeS_C3 957 (f) 105 2962 41720 12.10.5 2.90.2
CESAM (c) 2-methylstyrene MeS_C4 957 (f) 193 (i) 2962 95020 21.80.5 2.30.1
CESAM (c) 2-methylstyrene MeS_C5 957 (f) 413 (i) 2962 194120 54.50.5 2.80.1
ICARE (a), (d), (e) indene Ind_I1 800 (g) 950 2972 3460200 - -
ICARE (a), (d), (e) indene Ind_I2 900 (g) 950 2982 3900200 - -
EUPHORE (b), (d) indene Ind_E1 756 (f) >1000 2941 3900200 3750200 965
EUPHORE (b), (d) indene Ind_E2 100 (g) 124 2931 46430 1016 223
EUPHORE (b), (d) indene Ind_E3 100 (g) 118 3042 45030 543 12.11.5
CESAM (c) indene Ind_C1 789 (f) 270 2961 168620 4620.5 27.40.3
CESAM (c) indene Ind_C2 789 (f) 26 (i) 2971 11320 100.5 8.80.8
CESAM (c) indene Ind_C3 789 (f) 100 (i) 2971 45420 690.5 15.20.4
CESAM (c) indene Ind_C4 789 (f) 281 (i) 2971 124820 3140.5 25.10.3
CESAM (c) indene Ind_C5 778 (f) 70 2941 52720 900.5 17.10.5
CESAM (c) indene Ind_C6 778 (f) 140 (i) 2941 89520 1370.5 15.30.3
(a) indoor, FEP Teflon chamber, V= 7.3 m3, S/V = 3.2 m-1, O
3 UV absorption monitor (APOA-360, Horiba), FTIR (Magna 5700, Nicolet), SMPS: CPC (3022A, TSI) + DMA (3081,
TSI).26
(b) outdoor + retractable steel housing closed during experiments, FEP Teflon, V = 200 m3, S/V = 0.66 m-1, O
3 UV absorption monitor (ML9810, Monitor Labs), FTIR (Magna 550,
Nicolet), on-line GC-PID (8130, Fisons), on-line GC-MS (Saturn 2000, Varian), off-line LC-MS (LCQ Advantage Thermo Finnigan) after sampling on DNPH cartridges, SMPS: CPC (3010, TSI) + DMA (3081 , TSI), TEOM (1400a, Rupprecht and Patashnick) operated : at 27°C, 1 min accumulation time and using PM1 sampling head.28, 29
(c) indoor, stainless steel, V = 4.2 m3 , S/V = 4.3 m-1, O
3 UV absorption monitor (APOA-370, Horiba), FTIR (Tensor 37, Bruker), SMPS: CPC (3010, TSI) + DMA (3080 , TSI).30 (d) on-line TD-API-AMS.31
(e) off-line SFE-GC-MS after sampling on filters (GF/F, 47mm, Whatman).32
(f) The parent hydrocarbon was introduced first. In Ind_E1 only, ozone was added slowly in order to decrease the reaction rate. (g) Ozone was introduced before the parent hydrocarbon.
(h) Experiment was performed in presence of 1,3-dioxolane (2 ppmv) used as OH tracer.
(i) Experiment was performed just following the previous one without chamber evacuation. The parent hydrocarbon was introduced in large excess and small quantities of ozone were
added in the chamber once gas-particle equilibrium from the previous experiment was established and aerosol growth completed.
2 3 4 5 6 7 8 9 10 11 12 13 14 15 16 17 18 19 20 21 22 23 24 25 26 27 28 29 30 31 32 33 34 35 36 37 38 39 40 41 42 43 44 45 46 47 48 49 50 51 52 53 54 55 56 57 58 59
2.3. Aerosol yield and aerosol growth
For each experiment, SOA yield (Y) was calculated from the ratio of the formed aerosol mass concentration (M0) to the amount of reacted hydrocarbon (HC) at the maximum particle
concentration. The aerosol mass concentration was measured directly from the TEOM instrument when available or calculated using SMPS measured volume concentration assuming a specific SOA density value. Density measurements arising from the parallel use of TEOM and SMPS ranged from 0.8 to 1.2 g cm-3. Temperature is one varying parameter
from one experiment to the other (Table 2) which could contribute to the observed differences in density. Nevertheless, density estimations can only be considered as qualitative here and should be determined more precisely with complementary experiments. Therefore, a density value of 1 g cm−3 was assumed for SOA mass calculation from aerosol volume provided by SMPS measurements. Parent hydrocarbon and particle concentrations were corrected for dilution and wall losses (i) by applying a first order loss rate obtained from the measured decay of the particles at the end of each experiment, in EUPHORE experiments or (ii) based on the flow rate used for chamber inner pressure regulation in the CESAM chamber, which exhibits negligible wall losses in this particle size range and within the experiment timescale.30
For each hydrocarbon, “yield curves” were plotted by fitting experimental yields versus final M0 using the volatility basis set (VBS) model developed by Donahue and co-workers,
further referred to as the four-product model and described by the following equation :
i i O i M C Y / 1 *
where Ci* is the saturation concentration of compound i.34 For parametrisation, experimental
data points were fitted using non-linear least square regressions.
SOA time-dependent growth curves, i.e. M0 as a function of the amount of hydrocarbon
reacted Δ[HC], were plotted for all experiments, in order to investigate the relative contribution of first- and second-generation products to SOA formation and growth.18
2 3 4 5 6 7 8 9 10 11 12 13 14 15 16 17 18 19 20 21 22 23 24 25 26 27 28 29 30 31 32 33 34 35 36 37 38 39 40 41 42 43 44 45 46 47 48 49 50 51 52 53 54 55 56 57 58 59 60
3. Results
3.1. Gas-phase chemical composition 2-Methylstyrene ozonolysis
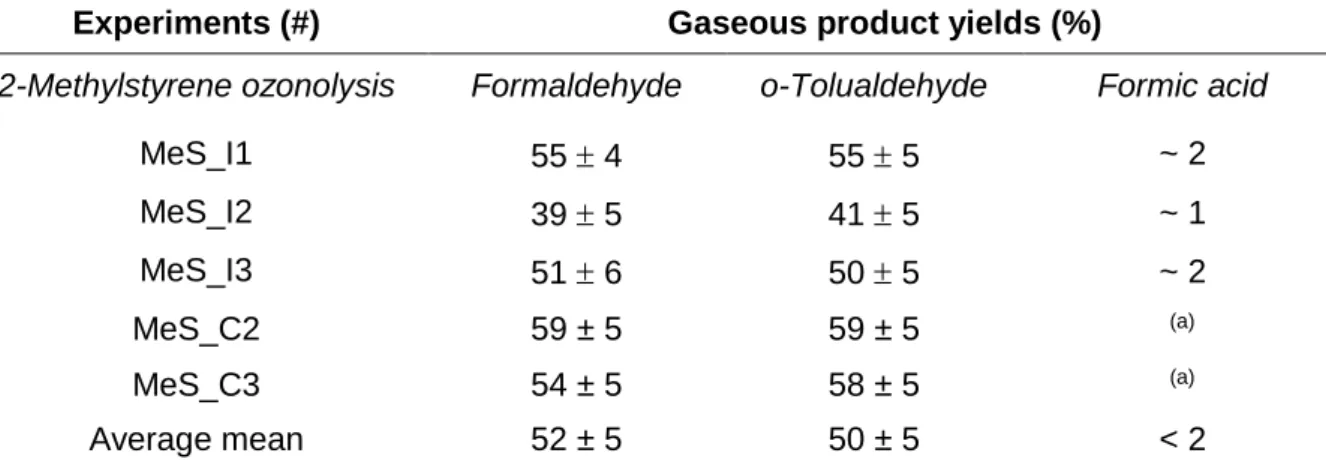
The gas phase analysis by FTIR spectroscopy showed the formation of formaldehyde, formic acid and o-tolualdehyde. The main products, formaldehyde (52 ± 5 %) and o-tolualdehyde (50 ± 5 %) were found to be of primary origin. Their formation yields were determined for the five experiments performed in the ICARE and the CESAM chambers (Table 3). Formaldehyde and o-tolualdehyde formation yields were higher in CESAM chamber and the sum of both products was slightly exceeding 100%. This may be explained by either underestimation of uncertainties or a small secondary contribution for these products possibly due to wall effects. Formic acid was produced in far lower quantities (about 2%) and was probably a secondary reaction product. These results are consistent and comparable with previous results reported for styrene ozonolysis where formaldehyde and benzaldehyde were the major products formed with yields of ~ 375 % and 415 % respectively35 and 355
% for both compounds.36 Formic acid was also observed previously as a minor product with
yields of about 1-2 %.35
Toluic acid, which was the main component detected in the particulate phase, was sought in the gas phase but not detected.
Table 3. Molar Yields of the Gas Phase Products Formed during 2-Methylstyrene Ozonolysis
Experiments (#) Gaseous product yields (%)
2-Methylstyrene ozonolysis Formaldehyde o-Tolualdehyde Formic acid
MeS_I1 55 4 55 5 ~ 2 MeS_I2 39 5 41 5 ~ 1 MeS_I3 51 6 50 5 ~ 2 MeS_C2 59 ± 5 59 ± 5 (a) MeS_C3 54 ± 5 58 ± 5 (a) Average mean 52 ± 5 50 ± 5 < 2
(a) not detected. 2 3 4 5 6 7 8 9 10 11 12 13 14 15 16 17 18 19 20 21 22 23 24 25 26 27 28 29 30 31 32 33 34 35 36 37 38 39 40 41 42 43 44 45 46 47 48 49 50 51 52 53 54 55 56 57 58 59 60
Indene ozonolysis
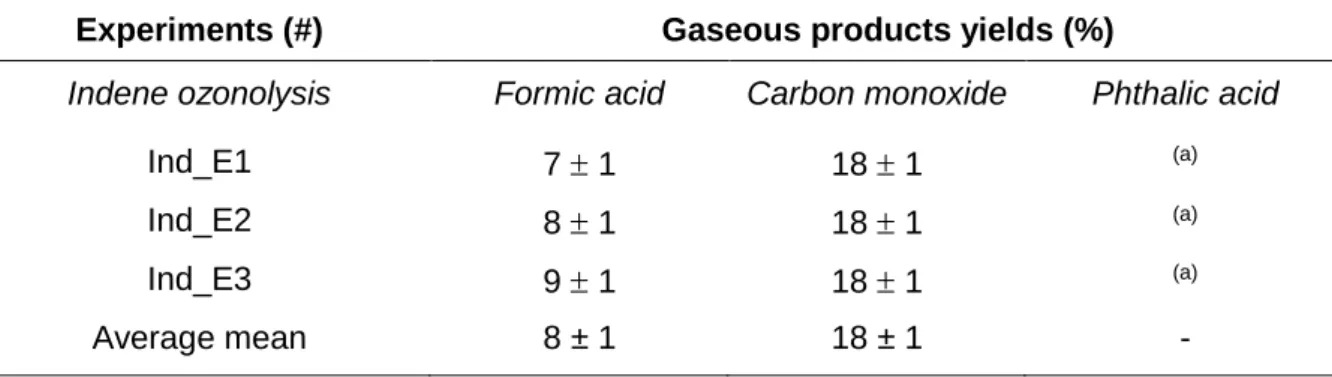
In ICARE chamber experiments, formic acid was detected in the gas phase at very low concentrations, below the quantification limit (about 25 ppb defined as 10 times the standard deviation). Phthalic acid was also detected in these experiments but could not be quantified because its very low volatility prevented a quantitative introduction in the chamber and hence FTIR calibration. In CESAM chamber experiments, no gas phase products could be positively identified using FTIR spectra. In EUPHORE chamber experiments, formic acid and carbon monoxide were detected using FTIR spectroscopy and molar yields were determined to be 8 ± 1 % and 18 ± 1 % respectively (Table 4). Moreover, 14 other reaction products were detected by on-line GC-MS and for most of them a molecular structure was proposed (Table 5). All species bearing a carbonyl function were also detected using DNPH cartridge sampling and off-line LC-MS analysis. Furthermore, in experiment Ind_E1, where concentrations were much higher, formaldehyde, acetaldehyde and acetone were also identified using this technique.
Table 4. Molar Yields of the Gas Phase Products Formed during Indene Ozonolysis
Experiments (#) Gaseous products yields (%)
Indene ozonolysis Formic acid Carbon monoxide Phthalic acid
Ind_E1 7 1 18 1 (a)
Ind_E2 8 1 18 1 (a)
Ind_E3 9 1 18 1 (a)
Average mean 8 ± 1 18 ± 1 -
(a)not detected.
It should be emphasized that two impurities were detected in indene using on-line GC-MS. This was not completely negligible since their concentrations could be estimated, based on the same response factor as indene, representing about 10% of indene concentration in total. These two compounds were assigned to an undetermined alkylated aromatic compound (C10H14, molecular ion m/z 134) and to 2-methylstyrene. Indeed, the formation of
2-methylstyrene ozonolysis products could be measured during indene ozonolysis
2 3 4 5 6 7 8 9 10 11 12 13 14 15 16 17 18 19 20 21 22 23 24 25 26 27 28 29 30 31 32 33 34 35 36 37 38 39 40 41 42 43 44 45 46 47 48 49 50 51 52 53 54 55 56 57 58 59 60
experiments. o-Tolualdehyde (M1) was detected in Ind_E1, Ind_E2 and Ind_E3 and two particulate products of methylstyrene ozonolysis, i.e. methylphenylformate (M2) and 2-methylphenol (M6), were also detected in Ind_E1, probably due to higher initial concentrations in this experiment. Moreover, it should be noted also that toluene was present in the chamber during Ind_E1 and Ind_E3 experiments at very low concentrations.
2 3 4 5 6 7 8 9 10 11 12 13 14 15 16 17 18 19 20 21 22 23 24 25 26 27 28 29 30 31 32 33 34 35 36 37 38 39 40 41 42 43 44 45 46 47 48 49 50 51 52 53 54 55 56 57 58 59 60
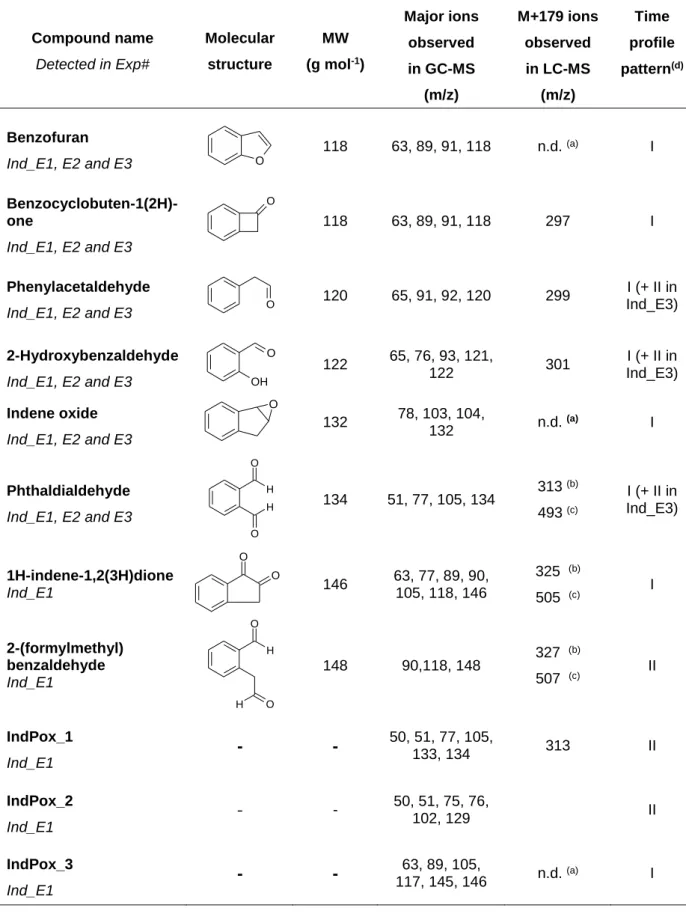
Table 5. Gas Phase Products Formed during Indene Ozonolysis Identified using On-Line GC-MS and/or Off-On-Line LC-MS
Compound name Detected in Exp# Molecular structure MW (g mol-1) Major ions observed in GC-MS (m/z) M+179 ions observed in LC-MS (m/z) Time profile pattern(d) Benzofuran Ind_E1, E2 and E3 O 118 63, 89, 91, 118 n.d. (a) I Benzocyclobuten-1(2H)-one Ind_E1, E2 and E3 O 118 63, 89, 91, 118 297 I Phenylacetaldehyde Ind_E1, E2 and E3 O 120 65, 91, 92, 120 299 I (+ II in Ind_E3) 2-Hydroxybenzaldehyde Ind_E1, E2 and E3 OH O 122 65, 76, 93, 121, 122 301 I (+ II in Ind_E3) Indene oxide Ind_E1, E2 and E3 O 132 78, 103, 104, 132 n.d. (a) I Phthaldialdehyde Ind_E1, E2 and E3 H H O O 134 51, 77, 105, 134 313 (b) 493 (c) I (+ II in Ind_E3) 1H-indene-1,2(3H)dione Ind_E1 O O 146 63, 77, 89, 90, 105, 118, 146 325 (b) 505 (c) I 2-(formylmethyl) benzaldehyde Ind_E1 H O O H 148 90,118, 148 327 (b) 507 (c) II IndPox_1 Ind_E1
-
-
50, 51, 77, 105, 133, 134 313 II IndPox_2 Ind_E1-
- 50, 51, 75, 76, 102, 129 II IndPox_3 Ind_E1-
-
117, 145, 146 63, 89, 105, n.d. (a) I(a) not detected in LC-MS analysis.
(b) molecular ion of monosubstituted DNPH derivative. (c) molecular ion of disubstituted DNPH derivative.
(d) the time profile pattern was either primary-like (I) or secondary-like (II). 2 3 4 5 6 7 8 9 10 11 12 13 14 15 16 17 18 19 20 21 22 23 24 25 26 27 28 29 30 31 32 33 34 35 36 37 38 39 40 41 42 43 44 45 46 47 48 49 50 51 52 53 54 55 56 57 58 59 60
The other 11 ozonolysis products detected in the gas phase during indene ozonolysis experiments were all detected in Ind_E1 and most of them were also present in Ind_E2 and Ind_E3. Among them, indene oxide, phthaldialdehyde, 1H-indene-1,2(3H)dione and 2-(formylmethyl)benzaldehyde were identified as indene ozonolysis products and formation pathways were proposed. Furthermore, 2-hydroxy-benzaldehyde, benzofuran, benzocyclobuten-1(2H)-one and phenylacetaldehyde were also identified but no reaction pathway could be proposed to explain their formation from indene, indicating that they may result from impurities oxidation. Finally, three other compounds were also detected for which no molecular structure could be proposed. Nevertheless, they are presented in Table 5, along with mass spectra information since some of them, such as IndPox_2, were assumed to be abundant, as suggested by their signal abundances.
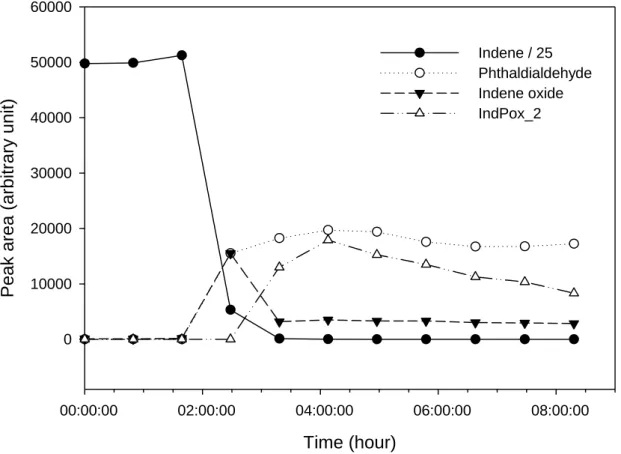
The time evolution of these products was also studied in order to retrieve information on their formation as well as degradation pathways, although it is important to stress that complementary experiments should be performed to confirm the following results. As noticed in Table 5, most of the products show a typical primary product profile. This is illustrated on Figure 1 by the GC-MS signal of indene and selected products (phthaldialdehyde, indene oxide and IndPox_2) versus time. Among the primary-like products, some were found to be rapidly consumed after formation, such as indene oxide. Moreover, phthaldialdehyde, as well as 2-hydroxybenzaldehyde and phenylacetaldehyde, have a primary-like product pattern in Ind_E1 and Ind_E2 but a more likely secondary-like product profile in Ind_E3, due to a delayed formation or transfer from the particles back to the gaseous phase. Ind_E2 and Ind_E3 were performed with comparable initial concentrations of ozone and indene, except that the chamber temperature was higher during Ind_E3 experiment. Thus, it is expected that for these semi-volatile compounds, a temperature increase would induce an increase in the vapor pressure and therefore a later gas-to particle partitioning. IndPox_1, IndPox_2 and 2-(formylmethyl)benzaldehyde show typical profiles of secondary-like products. These three products were detected in Ind_E1 only, where reaction has progressed further considering higher initial concentrations, confirming that they could indeed be produced as secondary products. 2 3 4 5 6 7 8 9 10 11 12 13 14 15 16 17 18 19 20 21 22 23 24 25 26 27 28 29 30 31 32 33 34 35 36 37 38 39 40 41 42 43 44 45 46 47 48 49 50 51 52 53 54 55 56 57 58 59 60
Time (hour)
00:00:00 02:00:00 04:00:00 06:00:00 08:00:00P
eak a
rea
(arbitrar
y
unit
)
0 10000 20000 30000 40000 50000 60000 Indene / 25 Phthaldialdehyde Indene oxide IndPox_2Figure 1. Typical time profiles of indene and gas phase products during indene
ozonolysis (experiment Ind_E1). Initial concentrations were 756 ppbv and a large
excess (>1000 ppbv) for indene and ozone, respectively. Temperature was 294±1 K.
Finally, it is important to note that no carboxylic acid was detected in the gaseous phase, although they accounted for a large fraction of the identified compounds in the particulate phase (see section 3.3.). As a matter of fact, oven temperature was raised up to 200 °C, which is, for example, not enough for o-toluic acid elution and detection (Tboiling point ~ 260 °C).
3.2. Aerosol growth and yield 2-Methylstyrene ozonolysis
For all experiments, SOA formation began as soon as 2-methylstyrene ozonolysis started. When plotting aerosol mass concentration as a function of 2-methylstyrene reacted (Figure S1), results from the different experiments overlap reasonably well with each other,
2 3 4 5 6 7 8 9 10 11 12 13 14 15 16 17 18 19 20 21 22 23 24 25 26 27 28 29 30 31 32 33 34 35 36 37 38 39 40 41 42 43 44 45 46 47 48 49 50 51 52 53 54 55 56 57 58 59 60
highlighting a fair consistency between experiments. For all experiments, a slight slope increase was observed in the first minutes of the reactions (Figure S1) which could either be due to (i) gas-phase reaction kinetics limiting saturation or (ii) gas-to-particle transfer limiting condensation or (iii) possible wall saturation. Then, aerosol growth is almost linear with 2-methylstyrene consumption and reaches its maximum when 2-2-methylstyrene is consumed and remains constant thereafter (Figure S1). This behavior is similar to the one observed by Ng et al. for α-pinene during ozonolysis as well as other terpenoids bearing one double-bond.18 From this growth pattern, they assume that the first oxidation product formation is
most probably the rate-determining step in SOA formation.
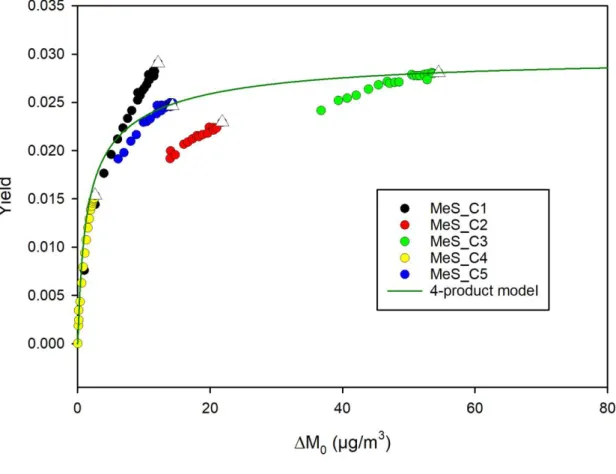
Figure 2. SOA yield curve for 2-methylstyrene ozonolysis. Experimental data are represented with coloured circles and for each experiment, the white triangle represent the final yield. The four-product model fitting is represented by the green curve and the fitting parameters are (C*
1= 1 ; α1 = 2×10⁻² ; C*2= 10 ; α2 = 9×10⁻³ ; C*3= 102 ; α3 = 6×10⁻⁹ ; C*4= 103 ;
α4 = 2×10⁻⁸), where C*i are the saturation concentrations (µg m-3) and αi is the stoichiometric
coefficients. 2 3 4 5 6 7 8 9 10 11 12 13 14 15 16 17 18 19 20 21 22 23 24 25 26 27 28 29 30 31 32 33 34 35 36 37 38 39 40 41 42 43 44 45 46 47 48 49 50 51 52 53 54 55 56 57 58 59 60
SOA yields are determined for the 5 experiments performed in CESAM and range from 1.5 ± 0.2 % to 2.8 ± 0.1 %. They are plotted versus aerosol mass concentration M0 in Figure 2,
where they are fitted using the four-product model. The best correlation coefficient was obtained for saturation concentrations ranging from 1 to 1000 µg m-3. Despite a significant
dispersion of experimental data points, the fit shows acceptable correlation coefficients (R2=0.69). The main products (with highest gas-phase stoichiometric fractions) are those of
lowest volatilities, i.e. hypothetical products with saturation concentrations of 1 and 10 µg m-3.
2-Methylstyrene ozonolysis SOA yield curve is further discussed as regards indene ozonolysis SOA yield curve (section 4.3.).
Indene ozonolysis
Although the introduction order of ozone and indene in the chamber was not always the same for the set of indene ozonolysis experiments, the results are consistent. For all experiments, SOA formation was observed as soon as indene started to react with ozone. As illustrated in Figure S2, in all experiments except Ind_E1, aerosol mass concentration increased almost linearly after a short delay and reached a maximum when indene was consumed. It has to be emphasized here that the experimental data generated in EUPHORE and CESAM facilities, using slightly different experimental procedures overlap quite well and the time-dependent growth curve pattern is similar to that of 2-methyl-styrene. In experiment Ind_E1 only, the growth curve pattern is very different: SOA yield is much larger than for all other experiments, due to much larger precursor initial concentrations and SOA mass continues to grow even after indene is consumed. This pattern is similar to the ones of hydrocarbon precursors bearing more than one double bond (or reactive site) as shown by Ng et al.18 It would suggest that further oxidation of first-generation products may occur and
contribute to SOA growth. Indeed, in this particular experiment, indene and ozone were both introduced at high concentrations (756 ppbv and > 1 ppmv for indene and ozone, respectively) and ozone was introduced slowly (during about 1 hour) in order to decrease indene ozonolysis reaction rate. Ozone was also present in a large excess during the whole
2 3 4 5 6 7 8 9 10 11 12 13 14 15 16 17 18 19 20 21 22 23 24 25 26 27 28 29 30 31 32 33 34 35 36 37 38 39 40 41 42 43 44 45 46 47 48 49 50 51 52 53 54 55 56 57 58 59 60
experiment, and OH radicals, potentially generated from ozonolysis, may participate and further oxidise first generation products and hence contribute significantly to SOA growth. It can even be proposed that the aromatic ring would be attacked at this stage of the reaction. The hypothesis of a further oxidation may be corroborated by the results presented in the previous section where secondary-like products such as IndPox_2 and 2-(formylmethyl)benzaldehyde were detected for Ind_E1 preferentially. Nevertheless, this “secondary” chemistry may also contribute to SOA mass in Ind_E2 and Ind_E3, but to a much lesser extent, as concentrations were lower and ozone was present in a smaller excess. Indeed, SOA yields were higher for Ind_E2 than for experiments performed in CESAM, where ozone was not in excess. For Ind_E3 however, SOA yields were similar to the ones measured in CESAM experiments, due to higher temperature (304 K) in this particular experiment.
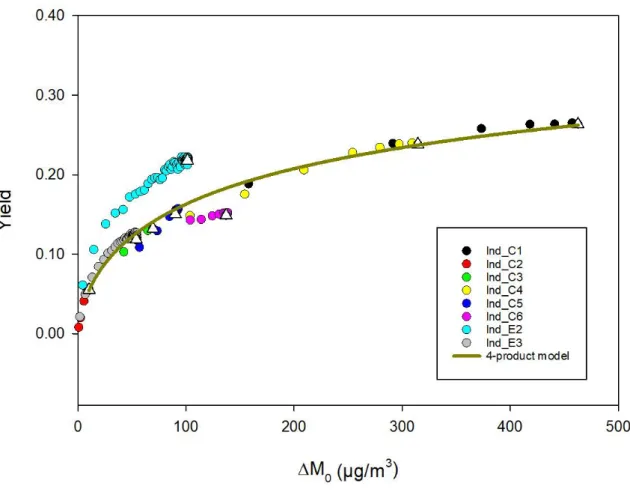
SOA yields were determined for the 9 experiments performed in EUPHORE and CESAM and values range from 8.8 ± 0.8 % to 27.4 ± 0.3 %. It is not expected that the presence of impurities will impact significantly these values since (i) ozonolysis of 2-methylstyrene induces much lower SOA mass yields by an order of magnitude, (ii) toluene or other alkylated monoaromatic compounds are not very reactive with ozone, and (iii) SOA generated by OH-initiated oxidation of these impurities would represent only a minor fraction of the total SOA, considering similar SOA yields for these precursors but much lower initial concentrations (i.e. SOA yields values of about 30% and 36% (with SOA density of 1.4 g cm -3) were reported for OH-initiated oxidation of toluene and m-xylene respectively, in dry and
low NOx conditions by Ng et al.37 Yields were plotted versus aerosol mass concentration M 0
(Figure 3) and again, experimental data points were fitted using the four-product model for all experiments except Ind_E1 due to inconsistent experimental conditions as mentioned above and in Table 2. The corresponding coefficient parameters are listed in Figure 3. The fit shows good correlation coefficients (R2=0.87). The best correlation coefficient was obtained for
saturation concentrations ranging from 1 to 1000 µg m-3. The most abundant product is the
less volatile with a saturation concentration of 1 µg m-3. 2 3 4 5 6 7 8 9 10 11 12 13 14 15 16 17 18 19 20 21 22 23 24 25 26 27 28 29 30 31 32 33 34 35 36 37 38 39 40 41 42 43 44 45 46 47 48 49 50 51 52 53 54 55 56 57 58 59 60
Figure 3. SOA yield curve for indene ozonolysis. Experimental data are represented with coloured circles and for each experiment, the white triangle represent the final yield. The four-product model fitting is represented by the green curve. The fitting parameters are (C*
1=
1 ; α1 = 0.87 ; C*2= 10 ; α2 = 0.058 ; C*3= 102 ; α3 = 0.17 ; C*4= 103 ; α4 = 0.18) where C*i are
the saturation concentrations (µg m-3) and α
i the stoichiometric coefficients.
3.3. Aerosol chemical composition 2-Methylstyrene ozonolysis
SFE-GC-MS analysis allowed to detect more than ten compounds in SOA and a molecular structure was proposed for 6 of them (Table 6) : o-tolualdehyde (M1), 2-methylphenylformate (M2), o-toluic acid (M3), 2-(hydroxymethyl)benzoic acid (M4), 2-methylbenzoic acid (M5) and 2-methylphenol (M6). The molecular structures could be confirmed using standards for o-tolualdehyde and o-toluic acid only. On-line analysis by TD-API-AMS allowed the detection of
2 3 4 5 6 7 8 9 10 11 12 13 14 15 16 17 18 19 20 21 22 23 24 25 26 27 28 29 30 31 32 33 34 35 36 37 38 39 40 41 42 43 44 45 46 47 48 49 50 51 52 53 54 55 56 57 58 59 60
m/z 135 and 121 ions in the negative and the positive ionisation modes, respectively, hence assigned to o-toluic acid and o-tolualdehyde. Two other ions (m/z 135 and 141) were also detected in the positive ionisation mode but no molecular structure could be attributed to these ions. A list of these compounds is presented in Table 6, along with the characteristic fragments ([M+H]+, [M-CH
3]+, [M-OSi(CH3)3]+) used for SFE-GC-MS identification, the
molecular ion m/z ratios used for TD-API-AMS detection and the corresponding standard or surrogate standards selected for quantification.
2 3 4 5 6 7 8 9 10 11 12 13 14 15 16 17 18 19 20 21 22 23 24 25 26 27 28 29 30 31 32 33 34 35 36 37 38 39 40 41 42 43 44 45 46 47 48 49 50 51 52 53 54 55 56 57 58 59 60
20
Table 6. List of the compounds identified in the particulate phase during 2-methylstyrene ozonolysis using off-line SFE-GC-MS and/or on-line TD-API-AMS.
Compound name Molecular
structure Formula MW TMS_MW(1) (g mol-1) SFE-GC-MS(2) TD-API-AMS(2) Quantification standard Concentration (µg m-3) Molar yield (%) CI fragments (m/z) Positive mode (m/z) Negative mode (m/z) o-tolualdehyde (M1) O H C8H8O 120 - M+1=121 M+1=121 o-tolualdehyde 2.7 0.8 (2) 0.06 0.03 (2) 2-methylphenyl formate (M2) O H O C8H8O2 136 - M+1=137 phenyl formate 1.5 0.4 (2) 0.03 0.02(2) o-toluic acid (M3) O H O C8H8O2 136 208 M+1=209 M-15=193 M-89=119 M-1=135 benzoic acid 140 50 (2) 80 16 (3) 2.4 1.4 (2) 3.4 1.1 (3) 2.1 0.7 (4) 2-(hydroxymethyl) benzoic acid (M4) O H O OH C8H8O3 152 296 M-15=281 M-89=207 3-hydroxy benzoic acid 0.40 0.14 (2) 0.006 0.003 (2) 2-formyl benzoic acid (M5) O O H O H C8H6O3 150 222 M+1=223 M-15=207 M-89=133 2-acetyl benzoic acid 0.9 0.3 (2) 0.06 0.03 (2) 2-methylphenol (M6) OH C7H8O 108 180 M-15=165 M-89=91 3-methylphenol 1.6 0.4 (2) 0.04 0.02 (2) 2 3 4 5 6 7 8 9 10 11 12 13 14 15 16 17 18 19 20 21 22 23 24 25 26 27 28 29 30 31 32 33 34 35 36 37 38 39 40 41 42 43 44 45 46 47 48 49 50 51 52 53 54 55 56 57 58 59
21
(1) TMS_MW : Trimethylsilyl derivative molecular weight.(2) Results obtained by SFE-GC-MS from experiment MeS_I1. (3) Results obtained by TD-API-AMS from experiment MeS_I1. (4) Results obtained by TD-API-AMS from experiment MeS_I2. 2 3 4 5 6 7 8 9 10 11 12 13 14 15 16 17 18 19 20 21 22 23 24 25 26 27 28 29 30 31 32 33 34 35 36 37 38 39 40 41 42 43 44 45 46 47 48 49 50 51 52 53 54 55 56 57 58 59
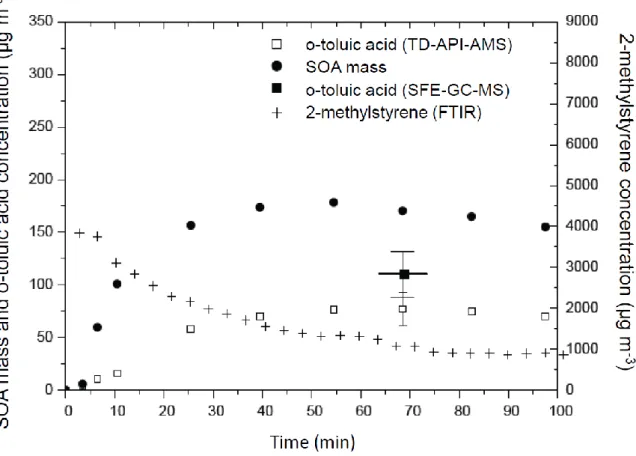
The detailed quantification of the particulate phase was performed for experiment MeS_I1 and o-toluic acid was found to be the main product identified in SOA formed by 2-methylstyrene ozonolysis (Table 6). O-Toluic acid concentrations, determined independently by SFE-GC-MS (110 ± 22 µg m-3) and TD-API-AMS (80 ± 16 µg m-3), are in good agreement
within uncertainties. This monocarboxylic acid represents ~95 % of the identified aerosol fraction and ~3 % of the reacted 2-methylstyrene. All the other compounds were present in SOA at much lower concentrations ranging from 0.40 0.14 µg m-3 for 2-(hydroxymethyl)
benzoic acid to 2.7 0.4 µg m-3 for o-tolualdehyde. Finally, considering that the aerosol mass
concentration measured by SMPS was under-estimated since SOA size distribution was larger than the SMPS monitored mass range, only an upper limit of 54 17 % could be estimated for the identified aerosol fraction. The missing particulate compounds were assumed to be either low volatility compounds such as oligomers, which could not be detected using our analytical techniques; or semi-volatile compounds such as dicarbonyl species produced from aromatic ring cleavage, which are eluted in GC-MS analysis in the same time as BSTFA and thus can also not be detected. Finally, it cannot be excluded that the missing particulate compounds are analysable with these techniques but present at very low concentrations, under the detection limits.
2 3 4 5 6 7 8 9 10 11 12 13 14 15 16 17 18 19 20 21 22 23 24 25 26 27 28 29 30 31 32 33 34 35 36 37 38 39 40 41 42 43 44 45 46 47 48 49 50 51 52 53 54 55 56 57 58 59 60
Figure 4. Time profiles of the quantified reaction products formed during 2-methylstyrene ozonolysis for experiment MeS_I1. Initial concentrations were 900 ppbv and 870 ppbv for 2-methylstyrene and ozone, respectively. Temperature was 298±2 K (see more experimental conditions in Table 2). The concentration of 2-methylstyrene was monitored in the gas phase by FTIR whereas those of o-toluic acid were measured in the particulate phase by TD-API-MS and SFE-GC-TD-API-MS.
The time evolution of o-toluic acid concentrations in particles obtained from TD-API-AMS data is plotted in Figure 4 and shows that this product is present from the beginning of SOA formation and its concentration increases with SOA mass. This suggests that o-toluic acid contributes to particulate matter formation, either being formed in the gaseous phase and rapidly condensed on particles afterwards or being formed in the particulate phase rapidly after the gas-to-particle transfer of its precursor, possibly o-tolualdehyde.
2 3 4 5 6 7 8 9 10 11 12 13 14 15 16 17 18 19 20 21 22 23 24 25 26 27 28 29 30 31 32 33 34 35 36 37 38 39 40 41 42 43 44 45 46 47 48 49 50 51 52 53 54 55 56 57 58 59 60
Indene ozonolysis
SFE-GC-MS analysis performed on filters sampled from experiment Ind_I1 allowed the detection of about 30 compounds, illustrating that the chemical composition of SOA formed via indene ozonolysis was much more complex than the one formed via 2-methylstyrene ozonolysis. Among these compounds, 10 could be identified and are listed in Table 7: phthaldialdehyde (I1), 2-formyl benzoic acid (I2), 3-hydroxy-1(3H)-isobenzofuranone (I3), phthalic acid (I4), 2-hydroxy-2-(2-formylphenyl) acetaldehyde (I5), (2-formylphenyl) acetic acid (I6), (oxo-ethyl) benzoic acid (I8), (hydroxymethyl) benzoic acid (I9), 2-carboxyphenyl acetic acid (I10) and 1H-indene-1,2(3H)dione (I11). It is important to note that two chromatographic peaks were detected for I6 and I8 but they could not be assigned from their mass spectrum to one or the other molecular structure. All the molecular ions corresponding to these compounds were also detected by TD-API-AMS and monitored throughout the experiments performed in ICARE and EUPHORE chambers, either in positive ([M+H]+) or negative ([M-H]-) ionisation mode. Moreover, the detection of phthaldialdehyde
(I1), 2-formyl benzoic acid (I2) and phthalic acid (I4) was positively confirmed in SOA particles generated in EUPHORE experiments, by mass spectrometry using MS2 mode. The
fragment profiles in SOA of the so-assigned ions (i.e. m/z 135 in the positive mode, 149 m/z and 165 m/z in the negative mode) were compared and found to agree with those of their corresponding standards. As mentioned in section 3.1., phthaldialdehyde (I1) and 1H-indene-1,2(3H)dione (I11) were also detected in the gaseous phase in EUPHORE experiments by on-line GC-MS. Three additional species (ions m/z 149+, 121- and 135-) were identified using
TD-API-AMS. Although no standards were available for confirmation, 2-(formylmethyl)benzaldehyde (I7), 2-hydroxybenzaldehyde (I12) and 2-(hydroxymehtyl) benzaldehyde (I13) molecular structures were proposed for m/z 149+, 121- and 135- on the
basis of their MS2 spectra. All the products identified in indene ozonolysis experiments are
thus oxidized, highly polar and bi-functionalized (Table 7).
2 3 4 5 6 7 8 9 10 11 12 13 14 15 16 17 18 19 20 21 22 23 24 25 26 27 28 29 30 31 32 33 34 35 36 37 38 39 40 41 42 43 44 45 46 47 48 49 50 51 52 53 54 55 56 57 58 59 60
25
Table 7. List of compounds identified in the particulate phase during indene ozonolysis using off-line SFE-GC-MS and/or on-line TD-API-AMS.
Compound name Molecular
structure Formula MW TMS_MW(1) (g mol-1) SFE-GC-MS(2) TD-API-AMS(2,3) Quantification standard Concentration (2) (µg m-3) Molar yield (2) (%) CI fragments (m/z) Positive mode (m/z) Negative mode (m/z) phthal- dialdehyde (I1) H H O O C8H6O2 134 - M+1=135 M+1=135 benzaldehyde 50 16 1.7 0.6 2-formyl benzoic acid (I2) OH O O H C8H6O3 150 222 M+1=223 M-15=207 M-89=133 M+1=151 M-1=149 2-acetyl benzoic acid 10.7 4.0 0.3 0.1 3-hydroxy-1(3H)iso benzofuranone (I3) O OH O C8H6O3 150 222 M+1=223 M-15 =207 M-89=133 M+1=151 3-hydroxy-benz-aldehyde 2.0 0.7 0.06 0.03 phthalic acid (I4) OH O O OH C8H6O4 166 310 M+1=311 M-15=295 M-89=207 M-1=165 benzoic acid 2.5 1.0 0.07 0.03 2-hydroxy-2-(2-formylphenyl) acetaldehyde (I5) H O OH H O C9H8O3 164 236 M+1=237 M-15=221 M-89=147 M+1=165 3-hydroxy-benz-aldehyde 0.8 0.3 0.02 0.01 (2-formylphenyl) acetic acid (I6) H O OH O C9H8O3 164 236 M+1=237 M-15=221 M-89=147 M+1=165 M-1=163 2-acetyl benzoic acid 3.2 1.4 (I6 or I8) 0.07 0.04 (I6 or I8) 2 3 4 5 6 7 8 9 10 11 12 13 14 15 16 17 18 19 20 21 22 23 24 25 26 27 28 29 30 31 32 33 34 35 36 37 38 39 40 41 42 43 44 45 46 47 48 49 50 51 52 53 54 55 56 57 58 59
26
2-(formylmethyl) benzaldehyde (I7) H O O H C9H8O2 148 - - M+1=149 MS2 (149): 77, 91, 93, 103, 121, 131 - 2-(2-oxo-ethyl) benzoic acid (I8) OH O H O C9H8O3 164 236 M+1=237 M-15=221 M-89=147 M+1=165 M-1=163 2-acetyl benzoic acid 0.31 0.12 (I6 or I8) 0.009 0.004 (I6 or I8) 2-(hydroxymethyl) benzoic acid (I9) OH O OH C8H8O3 152 296 M+1=297 M-15=281 M-89=207 3-hydroxy-benzoic acid 3.2 0.8 0.07 0.04 2-carboxyphenyl acetic acid (I10) OH O OH O C9H8O4 180 324 M+1 = 325 M-15 = 309 M-89 = 235 M-1=179 benzoic acid 2.0 0.7 0.05 0.02 1H-indene-1,2(3H)dione (I11) O O C9H6O2 146 - M+1=147 M+1=147 sabinaketone 1.2 0.3 0.04 0.01 2-hydroxy benzaldehyde (I12) H O OH C9H8O2 122 - - 121 MS2 (121): 77, 93 - 2-(hydroxymethyl) benzaldehyde (I13) H O OH C9H8O2 136 - - 135 MS2 (135): 77, 91, 107 -(1) TMS_MW: Trimethylsilyl derivative molecular weight.
(2) Results obtained from samples produced in the ICARE chamber (experiment Ind_I1).
(3) Results obtained from samples produced in the EUPHORE chamber (experiments Ind_E1 and Ind_E3). 2 3 4 5 6 7 8 9 10 11 12 13 14 15 16 17 18 19 20 21 22 23 24 25 26 27 28 29 30 31 32 33 34 35 36 37 38 39 40 41 42 43 44 45 46 47 48 49 50 51 52 53 54 55 56 57 58 59
It should be stressed that these results show again a strong consistency between the information obtained from the different chambers on the chemical composition of both the gaseous and the particulate phases.
The detailed quantification of particulate compounds is provided in Table 7 for experiment Ind_I1 by SFE-GC-MS analysis. Phthaldialdehyde (I1) is the most abundant product (50 16
µg m-3) and represents 66 20 % of the identified aerosol mass concentration. Its molar yield
is 1.7 0.6 %, showing that the carbon balance is far from being complete in this study, partly due to the lack of quantification of gaseous compounds. This may be explained by the formation of a wide range of compounds present at very low concentrations. For this experiment, performed in the ICARE chamber, we estimate that the upper limit of the quantified aerosol mass concentration is 25 6 % of the total aerosol mass concentration. This value is lower than the one obtained for SOA formed via 2-methylstyrene ozonolysis. Again, the missing fraction of the aerosol may be partly composed of a wide range of low-concentration species, possibly formed by aromatic ring cleavage or aggregation. During the experiments performed in the EUPHORE chamber, the most abundant ions detected using TD-API-AMS are m/z 135+, m/z 149- and m/z 165-, respectively assigned to phthaldialdehyde (I1), 2-formylbenzoic acid (I2) and phthalic acid (I4). The sum of their concentrations reaches 45% and 96% of the total aerosol mass concentration during Ind_E1 and Ind_E2 experiments, respectively.
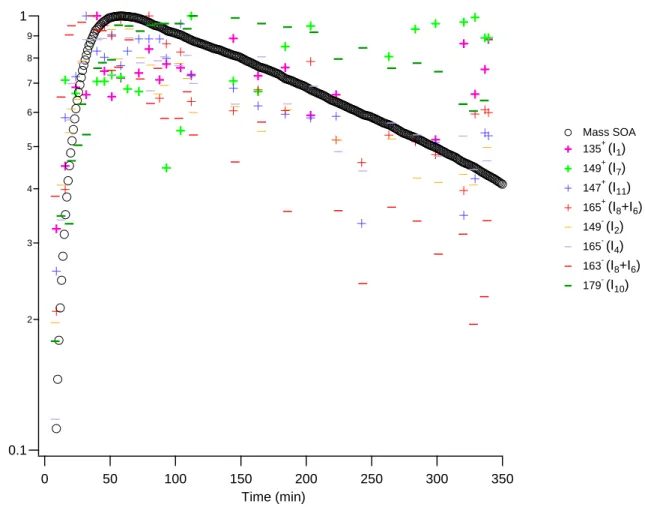
The time profiles of the molecular ions provided by TD-API-AMS along the experiments allow relevant information on the mechanism to be retrieved. Most of the detected ions both in the positive and the negative modes show a maximum signal simultaneously to the total aerosol mass concentration maximum in experiments performed both in the ICARE and the EUPHORE chambers as shown on Figures 5 and S3. This suggests that these compounds may be formed rapidly as primary products or through reactions are not rate-limiting and that they are stable and in equilibrium between the gaseous and particulate phases along the aerosol formation. Ion signals m/z 135+ (I1) and m/z 149+ (I7) seem however to decrease slower than the SOA mass (Figures 5 and S3) illustrating some enrichment of the particulate 2 3 4 5 6 7 8 9 10 11 12 13 14 15 16 17 18 19 20 21 22 23 24 25 26 27 28 29 30 31 32 33 34 35 36 37 38 39 40 41 42 43 44 45 46 47 48 49 50 51 52 53 54 55 56 57 58 59 60
phase in these two dialdehydes. Furthermore, ions m/z 165- (I4) and m/z 179- (I10) show a
somewhat delayed maximum in experiment Ind_E3 (Figure S3) and Ind_E1 (Figure 5) respectively, illustrating a possible secondary origin, either in the gaseous or in the particulate phase or at least a slower formation. The slightly different time evolution patterns between experiments suggests that some compounds may have several isomers with/or different formation pathways with some of them being favored depending on the experimental conditions (temperature, precursor concentration...).
0.1 2 3 4 5 6 7 8 9 1 Norm a lize d t o ma xim u m ion co u n ts o r SO A ma ss 350 300 250 200 150 100 50 0 Time (min) Mass SOA 135+ (I1) 149+ (I7) 147+ (I11) 165+ (I8+I6) 149- (I2) 165- (I4) 163- (I8+I6) 179- (I10)
Figure 5. Normalised (to maximum value) positive and negative ion signals and SOA mass concentration during indene ozonolysis (Ind_E1) obtained by TD-API-AMS. The ions corresponding to I1, I7 and I10 (bold) decrease significantly slower than that of SOA mass concentration. 2 3 4 5 6 7 8 9 10 11 12 13 14 15 16 17 18 19 20 21 22 23 24 25 26 27 28 29 30 31 32 33 34 35 36 37 38 39 40 41 42 43 44 45 46 47 48 49 50 51 52 53 54 55 56 57 58 59 60
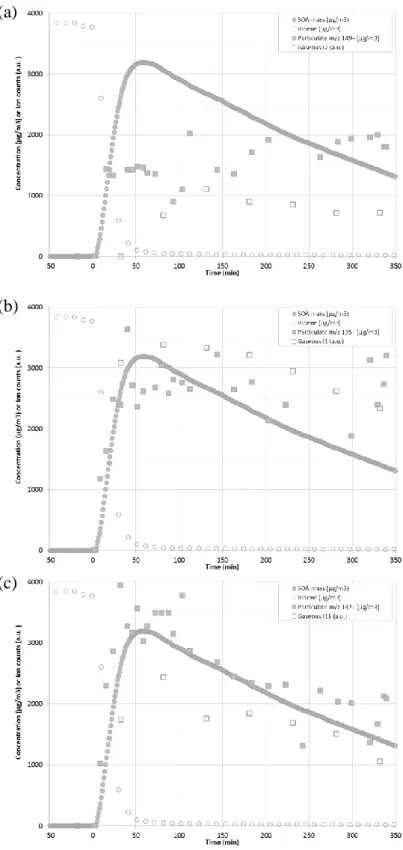
The gas-particle partitioning of some carbonyls was investigated and is presented for Ind_E1 in Figure 6. I1 and I11 concentrations in both gaseous and particulate phases follow a similar time profile, i.e. a rapid formation and a slow decrease, concomitantly with SOA mass concentration. This may evidence an equilibrium between both phases for these two products. For I7 however, its gaseous concentration was very low at the beginning of the reaction and reached a maximum later on. Note that I7 is expected to be a major primary product of indene ozonolysis even if a potential source of I7 (e.g. chamber walls, particle matter, a specific reaction…) seemed to release it along the experiment.
2 3 4 5 6 7 8 9 10 11 12 13 14 15 16 17 18 19 20 21 22 23 24 25 26 27 28 29 30 31 32 33 34 35 36 37 38 39 40 41 42 43 44 45 46 47 48 49 50 51 52 53 54 55 56 57 58 59 60
Figure 6. Gas-particle partitioning of some indene ozonolysis products during Ind_E1 : (a) 2-(formylmethyl) benzaldehyde (I7), (b) phthaldialdehyde (I1) and (c) 1H-indene-1,2(3H)dione (I11).
(a)
(b)
(c)
2 3 4 5 6 7 8 9 10 11 12 13 14 15 16 17 18 19 20 21 22 23 24 25 26 27 28 29 30 31 32 33 34 35 36 37 38 39 40 41 42 43 44 45 46 47 48 49 50 51 52 53 54 55 56 57 58 59 60Figures 5 and 6 highlight that for some ions, signal-to-noise ratios are quite low, leading to difficult interpretation and possibly due to the simultaneous presence of distinct products yielding the same ions (either as molecular ion or fragment). Consequently, the interpretation proposed above needs to be considered with caution.
4. Discussion
4.1.Proposed mechanism for 2-methylstyrene ozonolysis
Figure 7 depicts the proposed routes to explain the formation of the identified products of 2-methylstyrene ozonolysis. The mechanism presented here is inspired from those proposed by Tuazon et al.,35 Winterhalter et al.,38,39 and Jenkin.40 o-Tolualdehyde (M1), is a primary
gas phase reaction product, it is assumed to result from the decomposition of the ozonide (reaction a1) formed from the addition of ozone on the 2-methylstyrene vinylic double bond. Simultaneously, a small vibrationally excited Criegee radical is formed leading to the formation of formic acid as a secondary product of the reaction (reaction a2). Formaldehyde, also detected as a primary product in the gas phase, is formed following a similar process, together with a large Criegee radical (reaction a3). This biradical can either stabilize (by gas phase collisions) or decompose following the ester channel only.16 Indeed, in the case of
2-methylstyrene ozonolysis, the hydroperoxide channel, which consists on the isomerisation of the excited Criegee via an H-atom shift to form an unsaturated hydroperoxide, is not possible, since no hydrogen is available for rearrangement of the Criegee intermediate. This pathway starts with a ring closure to form the dioxirane intermediate (reaction a4) (Winterhalter et al., 2003),39 and further O-O bond dissociation leads to the formation of
another biradical, which may evolve here to yield 2-methylphenylformate M2 (reaction a5) and o-toluic acid M3 (reaction a6). Besides reaction a6, the formation of o-toluic acid can also be explained by a pathway involving the oxidation of o-tolualdehyde either in the gas phase or in the particulate phase. The presence of 2-(hydroxymethyl)benzoic acid (M4) and 2-formylbenzoic acid (M5) cannot be explained directly by ozonolysis reaction pathways and requires an OH-attack on o-toluic acid. Reaction b could take place either in the gaseous or the particulate phase. The observed decrease of o-toluic acid concentration in the particulate
2 3 4 5 6 7 8 9 10 11 12 13 14 15 16 17 18 19 20 21 22 23 24 25 26 27 28 29 30 31 32 33 34 35 36 37 38 39 40 41 42 43 44 45 46 47 48 49 50 51 52 53 54 55 56 57 58 59 60
phase could result from its heterogeneous reaction with OH radicals leading to M4 and M5 formation but it cannot completely be ruled out that this decrease can also result from a particle-to-gas transfer caused by o-toluic acid depletion in the gas-phase. In experiments MeS_I3, 1,3-dioxolane was introduced in the chamber as OH tracer. The tracer concentration decrease was not significantly different from the decrease due to dilution (5x10⁻⁵ s-1), therefore OH concentration was considered to be lower than 106 molecules cm-3.
The formation of methylphenol (M6) can result from the addition of an OH radical on the 2-methylstyrene vinylic double bond (reaction c). Indeed, the decomposition of the so-formed hydroxy-alkoxy radical would lead either to the formation of o-tolualdehyde (M1) via reaction c1, or to the formation of 2-methylphenyl-peroxy radical, whose reaction with another peroxy radical would produce 2-methylphenol (M6), via reaction c2. Finally, the equilibrium a7, which could take place in the particulate phase (Figure 4), could be another possible route for 2-methylphenol (M6) formation.
Further oxidation of aromatic products by OH radical may eventually lead to the formation of a wide range of small unsaturated and dicarbonyl compounds.41 As a matter of fact, they
were observed in SOA from OH-initiated oxidation of toluene although such volatile species have high vapor pressures prohibiting their condensation to the particulate phase.42-44 As an
example, using direct thermal desorption coupled to comprehensive gas chromatography– time of flight mass spectrometry, Hamilton and co-workers estimated, from toluene photo-oxidation mechanism in MCMv3.1, that ring opening compounds represented about 65 % of the products.45 They identified and quantified several tens of species produced by ring
cleavage pathways. All these species were estimated to account for about 10% of the total aerosol mass concentration in the toluene photo-oxidation mechanism. In the present study, although a probably larger fraction of the aerosol mass concentration was quantified, small VOCs produced from the ring cleavage of aromatic derivatives were not detected for the reasons exposed earlier (see section 3.3.).
2 3 4 5 6 7 8 9 10 11 12 13 14 15 16 17 18 19 20 21 22 23 24 25 26 27 28 29 30 31 32 33 34 35 36 37 38 39 40 41 42 43 44 45 46 47 48 49 50 51 52 53 54 55 56 57 58 59 60
O O O O H C H O O O O HO O O H O O O H OH C H OH OH O C O O OH O O H CH2 O O H O O O O H O H O O + O3 + HCHOO O2 O2 HO2 or RO2 OH HCOOH H2O OH + HCHO (a) (c) (a1) (a3) HCOOH (a2) (b) O2 RO2 + RO2 (a4) (a5) (a6) (c1) (a7) M1 M3 M2 M6 M5 M4 (c2)
Figure 7. Proposed mechanism for 2-methylstyrene ozonolysis. The reactions presented with dashed lines are assumed to occur in the particulate phase. The compounds detected in the gaseous and particulate phases are respectively framed with dotted lines and with solid lines.
4.2. Proposed mechanism for indene ozonolysis
Similarly to the reaction of 2-methylstyrene with ozone, reaction pathways are proposed to explain the products formed by indene ozonolysis (Figure 8). In this case, because ozone reacts on an endocyclic C=C double bond, two large Criegee radicals are formed (radicals I and II) via reactions a and b. These radicals can evolve by stabilization or following the ester
2 3 4 5 6 7 8 9 10 11 12 13 14 15 16 17 18 19 20 21 22 23 24 25 26 27 28 29 30 31 32 33 34 35 36 37 38 39 40 41 42 43 44 45 46 47 48 49 50 51 52 53 54 55 56 57 58 59 60
and the hydroperoxyde channels. Indene oxide can possibly result from a minor pathway of indene ozonolysis (reaction c), as already observed previously for other alkenes.46
O O O O H H C OO C O O H O O H OOH O H O O H C O H O H O O O H O H O O O H O OH H O H O O O H O O O H O OH O O H O OH O H O H O O H O H O H O H O OH O H O OH O OH O O OH O O H O OH O O O H O O O H O O O H C O H O O O H OH O OH OH O O H O H O OH C O O OH O O O O OH O O C O OH O OH O O O H H O O + O3 + OH. O2 RO2 RO2 I1 I11 I2 I3 I8 I6 I10 I4 I10 I9 Isom -CO2 RO2 RO2 I5 (b) (a) I II I6 (a1) (a2) 5 (a3) (b2) OH O2 RO2 -CO2 RO2 RO2 (b3) + (b1) (a4) (b3) I7 (b3) (c)
Figure 8. Proposed mechanism for indene ozonolysis. The reactions presented with dashed lines are assumed to occur within the particulate phase. The compounds detected in the gaseous and particulate phases are respectively framed with dotted lines and with solid lines.
2 3 4 5 6 7 8 9 10 11 12 13 14 15 16 17 18 19 20 21 22 23 24 25 26 27 28 29 30 31 32 33 34 35 36 37 38 39 40 41 42 43 44 45 46 47 48 49 50 51 52 53 54 55 56 57 58 59 60
The Criegee radical I can only undergo the hydroperoxide channel (reaction a1), explaining the formation of phthaldialdehyde (I1), whose oxidation in the particulate phase can lead to o-formyl benzoic acid (I2), which can isomerize to 1H-indene-1,2(3H)dione (I3) or be further oxidized to form phthalic acid (I4). Moreover, before I1 formation, the peroxy radical formed via decomposition of the hydroperoxide, can further react through self-reaction leading to 2-hydroxy-2-(2-formylphenyl) acetaldehyde (I5). The Criegee radical II is not able to follow the hydroperoxyde channel since no hydrogen is available to isomerize and form an unsaturated hydroperoxide.
However, both Criegee radicals I and II can undergo the ester channel (reactions a2 and b1) to produce two dioxiranes whose decompositions lead to intermediates. The latter can (i) either directly form (2-formylphenyl) acetic acid (I6) via reaction a3 or lose CO2 to form
2-(hydroxymethyl) benzoic acid (I9) via reaction a4, as suggested by Winterhalter and co-workers and (ii) yield 2-(formylmethyl) benzaldehyde (I7) via reaction b2 and 2-(2-oxo-ethyl) benzoic acid (I8) via reaction b3.38 Further oxidation of I7 and I8 leads respectively to the
formation of (2-formylphenyl) acetic acid (I6) and 2-carboxyphenyl acetic acid (I10).
Finally, the formation of 1H-indene-1,2(3H)dione (I11) can be explained by a reaction of isomerisation of Criegee radical I.
It can be noted here that phtaldialdehyde (I1), produced from Criegee radical I following the hydroperoxide channel, is the most abundant of the identified products in the SOA (see Table 7).
Finally, the mechanism proposed here for indene ozonolysis is rather similar to the one proposed by Riva and co-workers in their study of acenaphthylene ozonolysis.47 Hence, for
each monomeric gaseous or particulate products identified in their study (except ozonide) the corresponding product (with only one aromatic ring) was identified in the present study. This strongly underlines the consistency between this two ozonolysis processes as logically expected from the similarity of the alkene chemical structures.
2 3 4 5 6 7 8 9 10 11 12 13 14 15 16 17 18 19 20 21 22 23 24 25 26 27 28 29 30 31 32 33 34 35 36 37 38 39 40 41 42 43 44 45 46 47 48 49 50 51 52 53 54 55 56 57 58 59 60
4.3. Comparison of SOA formation between 2-methylstyrene and indene ozonolysis
In this section, we investigate the influence of the precursor chemical structure on SOA formation. As a reminder, the major difference between the two hydrocarbon molecular structures is the nature of the reactive C=C double bond, involved in a cycle or not for indene and 2-methylstyrene, respectively. The present work is, to the best of our knowledge, the first study for mono-aromatic alkenes. Only a few studies devoted on the influence of the nature of the C=C double bond on SOA formation were reported in the literature, and these studies were focused more specifically on monoterpenes or cycloalkenes.16,17
The results presented above reveal large differences between 2-methylstyrene and indene ozonolysis in SOA formation processes and SOA chemical composition. It clearly appears from SOA mass yields (Figures 2 and 3) that indene is a much better SOA precursor than methylstyrene. The yields are about 5 to 10 times higher for indene ozonolysis than for 2-methylstyrene ozonolysis, for similar consumed concentrations of precursor. Although it is not directly comparable, it is interesting to note that the same trends were observed previously. Bonn et al. compared SOA yields from α-pinene (endo-cyclic double bond) and β-pinene (exo-cyclic double bond) and reported that α-pinene ozonolysis lead to about three times higher SOA volume than β-pinene ozonolysis, under dry conditions and with initial hydrocarbon concentrations of about 500 ppbv.16 Keywood et al. performed a whole
comparative study for SOA formation yields of ten cycloalkenes.17 In particular, they found
that SOA mass yields obtained from the ozonolysis of methylenecyclohexane (exo-cyclic C=C double bond) were close to the ones measured for the ozonolysis of cyclohexene (endo-cyclic C=C double bond but one less carbon atom) and about twice lower than those obtained for the ozonolysis of cycloheptene (endo-cyclic C=C double bond). It should thus be highlighted that the difference in SOA mass yields between 2-methylstyrene and indene is much greater than those observed previously for non-aromatic cycloalkenes. One can assume that considering indene versus 2-methylstyrene molecular structures, there is a combination of two key features for SOA formation from ozonolysis, i.e. C=C double bond involved / not involved in a cycle and possibility / impossibility for the hydroperoxide channel, resulting in an even more favored / disfavored SOA formation. This is corroborated by recent
2 3 4 5 6 7 8 9 10 11 12 13 14 15 16 17 18 19 20 21 22 23 24 25 26 27 28 29 30 31 32 33 34 35 36 37 38 39 40 41 42 43 44 45 46 47 48 49 50 51 52 53 54 55 56 57 58 59 60