HAL Id: hal-01893578
https://hal.archives-ouvertes.fr/hal-01893578
Submitted on 22 Jan 2021HAL is a multi-disciplinary open access archive for the deposit and dissemination of sci-entific research documents, whether they are pub-lished or not. The documents may come from teaching and research institutions in France or abroad, or from public or private research centers.
L’archive ouverte pluridisciplinaire HAL, est destinée au dépôt et à la diffusion de documents scientifiques de niveau recherche, publiés ou non, émanant des établissements d’enseignement et de recherche français ou étrangers, des laboratoires publics ou privés.
Olivier Jourdan, Alexander Kokhanovsky, John Burrows
To cite this version:
Olivier Jourdan, Alexander Kokhanovsky, John Burrows. Calibration of SCIAMACHY Using AATSR Top-of-Atmosphere Reflectance Over a Hurricane. IEEE Geoscience and Remote Sens-ing Letters, IEEE - Institute of Electrical and Electronics Engineers, 2007, 4 (1), pp.8 - 12. �10.1109/lgrs.2006.881726�. �hal-01893578�
using AATSR top-of-atmosphere reflectance over a hurricane
O. Jourdan (1,2), A. A. Kokhanovsky(1), J. P. Burrows(1) (1) Institute of Environmental Physics, University of Bremen, D-28334 Bremen, Germany
(2) Now at, Laboratoire de Météorologie Physique (LaMP), Université Blaise Pascal, Clermont-Ferrand, France
Abstract
This letter investigates the synergy between SCIAMACHY (Scanning Imaging Absorption Spectrometer for Atmospheric ChartographY) and AATSR (Advanced Along Track Scanning Radiometer) onboard the ENVISAT platform for reflectance calibration purpose. This calibration study was mainly performed over a portion of a hurricane corresponding to fully cloudy SCIAMACHY and AATSR pixels. Results show that SCIAMACHY underestimates the top of atmosphere (TOA) reflectance by up to 23% (at 870nm) as compared to AATSR for a nadir viewing geometry. Specifically, considering AATSR calibration as accurate, which is confirmed by comparison with MERIS (Smith, 2005), the SCIAMACHY top-of-atmosphere reflectances should be multiplied by 1.21, 1.19, 1.23, and 1.10 for wavelengths at 550nm, 670nm, 870nm, and 1600nm, respectively, ahead of satellite retrieval schemes based on the measurements of TOA reflectance.
1. Introduction : Overview of SCIAMACHY calibration issue
The SCAnning Imaging Absorption spectroMeter for Atmospheric ChartographY (SCIAMACHY) is a moderate resolution imaging spectrometer (Bovensmann et al., 1999) onboard ENVISAT. It is designed to measure the scattered and reflected spectral radiance in nadir and limb geometry, the spectral radiance transmitted through the atmosphere (solar and lunar occultation geometry) and the extraterrestrial solar irradiance and the lunar radiance. It was launched on orbit on March 1st, 2002. Measurements are
expected to continue for at least another four years (till 2010). Data are recorded at moderate spectral resolution (0.2-1.5nm) in a spectral range of 240-1750 nm divided in 6 channels as well as in two smaller spectral regions corresponding to 1940-2040nm and 2265-2380nm. In the nadir mode, the spatial resolution is between 30x30 km2 and
30x240 km2. Accordingly, SCIAMACHY’s main objective is focused on the accurate
measurements of trace gases in the terrestrial atmosphere. As most SCIAMACHY retrieval algorithms rely on studies of the depths of gaseous absorption bands of backscattered solar light (Borell et al., 2004), the accurate calibration of the instrument is not of primary importance. However, for the retrieval of the atmospheric optical thickness (OT) from space, an accurate calibration is essential. Indeed, for optically thin atmospheric layers, radiative transfer calculations show that the optical thickness is directly proportional to the top-of-atmosphere (TOA) reflectance. Therefore, calibration errors of, for example 25%, will produce in turn the same range of error for OT (for optically thin layers). The uncertainties in the forward model can increase the error even further or make the retrievals impossible (e.g., the aerosol TOA reflectance can become a negative number after removal of a well-defined molecular scattering contribution).
Numerous studies have been performed related to SCIAMACHY calibration, both reanalyzing ground data collected before launch of ENVISAT (Noël, 2005) and also using the comparison with the MEdium Resolution Imaging Spectrometer (MERIS) TOA reflectances (Acarreta and Stammes, 2005; Kokhanovsky et al., 2006a; von Hoyningen-Huene et al., 2006).
MERIS is a 68.5 field-of-view pushbroom imaging spectrometer that measures
the solar radiation reflected by the Earth, at a ground spatial resolution of 300m, in 15 spectral bands, programmable in width and position, in the visible and near infra-red. MERIS allows global coverage of the Earth in 3 days. The reduced resolution mode (RRM) of MERIS has a spatial resolution of 1040m across track and 1160m along track. Measurements are performed in nadir geometry in 15 narrow channels with an average spectral width of 10nm (Bezy et al., 2000; von Hoyningen-Huene et al., 2006)1.
Moreover, Delwart et al. (2004) showed that the calibration error of MERIS was below 4%.
The analysis performed by several groups confirmed that TOA reflectances measured by SCIAMACHY are too low as compared to MERIS measurements. Previous works emphasized that SCIAMACHY calibration errors vary from 10 to 25% depending on the channel and the ground reflectance conditions (see among others, Kerridge et al., 2002; Latter et al., 2003; Acaretta and Stammes, 2005; Noël, 2005; von Hoyningen-Huene et al., 2006). Although there are physical grounds behind the possible changes of the error with the wavelength (e.g., due to the spectral reflectance of films and coatings on the optics of an instrument), the calibration factors should not depend on the surface
1 More specifically, the channels are centered on the following wavelengths : 412.5nm(10nm),
442.5nm(10nm), 490nm(10nm), 510nm(10nm), 560nm(10nm), 620nm(10nm), 665nm(10nm),
681.3nm(7.5nm), 708.8nm(10nm), 753.8nm(7.5nm), 760.6nm (3.8nm), 778.8nm(15nm), 865nm (20nm), 885nm(10nm), 900nm (10nm) where the width of the correspondent channel is given in brackets.
reflection. However, comparisons between SCIAMACHY and MERIS measurements showed that significant differences of reflectances were encountered between these two instruments depending on the surface type. The biases were always found to be larger for underlying water surfaces. In particular, Acarreta and Stammes (2005) found that the difference with MERIS was only of 15% over land but 25% over ocean for the 885nm wavelength. We believe that such an estimation of the calibration error is more reliable over an ocean surface because the surface contribution is less important at 885nm for ocean compared to that of the land. It also should be pointed out that the bi-directional properties of the surface and its horizontal inhomogeneity may influence the main assumption of a vicarious calibration:
( )
R
R r dr (1)for sensors having significantly different spatial resolutions. In Eq. (1), R is the reflectance measured by a sensor having a coarse spatial resolution (
2
~ 2000km in the case of SCIAMACHY) and R r
is the reflectance measured by an instrument with a high spatial resolution (e.g., ~ 1km as in the case of MERIS) at the 2point characterized by the two dimensional radius-vector r. Furthermore, the violation of Eq. (1) can be also due to discrepancies in observation angles of instruments under comparison. Under condition that Eq. (1) holds, results of Acarreta and Stammes (2005) assert that the calibration factor indeed depends on the ground scene, being systematically smaller for bright surfaces (in the 442-885nm wavelength range). On the other hand, as we mentioned above, due to the linearity of detectors, the bias between MERIS and SCIAMACHY calibration factors shouldn’t depend significantly of the scene studied. It points out that the relationship presented in Eq. (1) does not hold for all cases.
Therefore, it is more adequate to perform a calibration study over a homogeneous surface or to use wavelengths where the surface contribution is low.
In order to address further the SCIAMACHY calibration issue, we have performed the vicarious calibration of SCIAMACHY over a hurricane with an underlying ocean surface, using yet another optical instrument on ENVISAT, namely the Advanced Along Track Scanning Radiometer (AATSR). This is considered in the next section.
2. Vicarious calibration of SCIAMACHY using AATSR TOA reflectance
AATSR, along with MERIS and SCIAMACHY, is part of the atmospheric payload onboard ENVISAT. AATSR employs a dual view where each scene is viewed at nadir and at a forward angle of 55°. Its field of view covers a 512km width curved swath centered at nadir and the ground pixel size is 1x1km2 at the center of the nadir scan. The
spectral information of the sensor is divided in three thermal infrared channels centered at 3.7µm, 11µm and 12 µm and four visible/near infrared channels (20-nm width except for a channel 60 nm wide centered at 1.6 µm) centered at 0.55 µm, 0.67µm, 0.87 µm and 1.6 µm. According to SCIAMACHY spectral resolution, these four channels can directly be exploited for TOA reflectances comparison between SCIAMACHY and AATSR. Additionally, the calibration error of AATSR is small and comparable with that of MERIS. The differences in MERIS-AATSR TOA reflectances are close to +3% for wavelengths at 0.55 µm, and 0.87 µm, and below 1% at 0.665 µm (Smith, 2005).
Considering the calibration issues stated earlier, we chose to make a comparison of AATSR-SCIAMACHY reflectances over a scene with an underlying ocean surface that mainly encompasses optical thick cloud fields. In particular, this case study was
conducted over Hurricane Isabel (orbit 08094 of ENVISAT, 17.09.2003, 14:50UTC) with a center located at (72W, 30N) (Fig.1). One can refer to our previous work (Kokhanovsky et al., 2006b) for further details on the selected scene. SCIAMACHY Level 1 productsversion 5 wereused in this work.
The AATSR-SCIAMACHY reflectances intercomparison methodology follows the same procedure as the one proposed by Acarreta and Stammes (2005). First, the four visible/near infrared AATSR channels (0.55µm, 0.67µm, 0.87 µm and 1.6 µm), which are within SCIAMACHY spectral range, were selected. Then, in order to compare L1 AATSR nadir products with L1 SCIAMACHY products, spectrally averaged nadir reflectances are calculated for SCIAMACHY at each AATSR visible/near infrared spectral channels by integrating over AATSR filter response function. The shape of the AATSR slit function was chosen as a rectangular one. We believe that the choice of such a shape will not introduce significant errors compared to the real AATSR filter response function as Acarreta and Stammes (2005) found that the effect of the MERIS slit function was negligible on the change of the calibration factors. Additionally, the spectral dependence of the reflection function of cloudy scenes is negligible due to the large size of scatterers. The final step consisted in collocating 1x1km2 AATSR pixels within each
30x60km2 SCIAMACHY pixels on the basis of their longitude and latitude coordinates.
Additionally, in this study, only SCIAMACHY pixels corresponding to a cloud fraction greater than 99% were selected. This pixel selection was based on a threshold technique of the SCIAMACHY and AATSR TOA reflectances at 0.87µm. An AATSR pixel within a given SCIAMACHY pixel has been considered as completely cloudy if the reflection function at 0.87µm of both instruments exceeded the threshold value of 0.2
(Kokhanovsky and von Hoyningen-Huene, 2004). In turn, the number of AATSR cloudy pixels within the SCIAMACHY pixel gives an estimation of the cloud cover of the SCIAMACHY pixel. The pixels fulfilling these criteria were used to investigate the possibility to establish linear relationships between SCIAMACHY and AATSR reflectances and therefore perform a calibration study.
We believe that a scene containing a hurricane structure is a good choice for the vicarious calibration of SCIAMACHY, not only because the levels of backscattered light intensity on SCIAMACHY detectors are quite large and variable, but also due to the relative homogeneity of the spectral TOA reflection function (RF). Additionally, the RF of the thick clouds under study is only slightly dependant on the observation angles and wavelengths. This reduces the possible influence of the observation geometry and the spectral instrument sensitivity function on the calibration coefficient. The possible effects of the surface inhomogeneity and the lower troposphere also significantly diminish for this case.
The results of the AATSR-SCIAMACHY reflectances intercomparison are presented in terms of linear regression plots displayed for four wavelengths in Figs. 2-5. It follows from the analysis of Figs. 2-5, that AATSR reflectances (Raatsr) and
SCIAMACHY reflectances (Rscia) are almost perfectly correlated with a correlation
coefficient larger than 98%. The least square fit error is close to 0.01 for each wavelength and the offset has a maximum value of 0.004 indicating that overall the fit is acceptable. However, Rsciaare lower by 21% at 550nm, 19% at 670nm, 23% at 870nm, and 10% at 1600nm as compared toRaatsr. This is close to earlier MERIS-based findings reported above. Moreover, the calibration coefficient C R aatsr/Rscia at 870nm is equal to 1.23
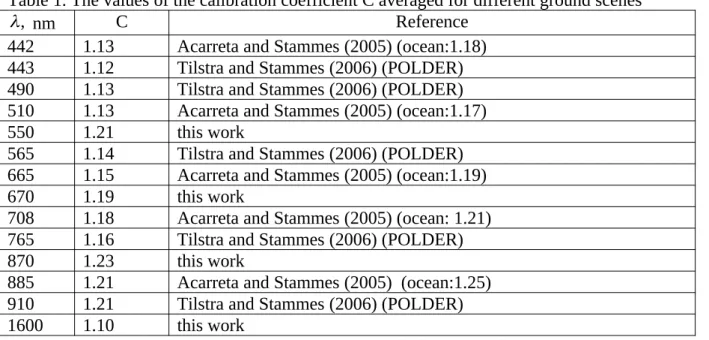
which is in close agreement with the value C 1.25reported by Acarreta and Stammes (2005) at 885nm for MERIS measurements over ocean. Results of the vicarious calibration using AATSR compared to the one reported by Acarreta and Stammes (2005) are presented in Table 1. It ensues from this table that MERIS and AATSR give comparable calibration coefficients with respect to SCIAMACHY. We chose not to report the offset in our table because it represents a low reflectance value and can be neglected. This is confirmed by other independent calibration studies (Acarreta and Stammes, 2005; von Hoyningen-Huene et al., 2006). Results for calibration coefficients obtained using the comparison of SCIAMACHY measurements with those of POLDER instrument (see http://smsc.cnes.fr/POLDER/ for the description of the instrument) have been presented by Tilstra and Stammes (2006). They are also given in Table 1. The calibration coefficients found are consistent with previous findings reported by Acarreta and Stammes (2005) obtained using MERIS.
It follows that C generally increases with the wavelength except the case at 1600nm, where the calibration error is at minimum (C=1.1). The similar trend is seen in the analysis of ground SCIAMACHY calibration data as reported by Noël (2005)2 (doted
points on Fig. 6). This behavior was also found by von Hoyningen-Huene et al. (2006), who determined, using MERIS observations, values of C equal to 1.10, 1.12, 1.21 for SCIAMACHY channels 3 (394-620nm), 4(604-805), and 5(785-1050), respectively.
Figure 6 displays the spectral dependence of SCIAMACHY calibration factors obtained from measurements carried out at ground before launch of ENVISAT (open circles) and derived from MERIS (full black squares), AATSR (open triangles), and
2 Refer to the following web page for further details :
POLDER (stars) data. The calibration coefficients represented by open circles in Fig.6 (except highly oscillating results at the edge of SCIAMACHY channels) will be used in the next version of SCIAMACHY Processor (the version 6.0, S. Noël, private communication). In this way, after this re-calibration is achieved, MERIS and SCIAMACHY will have very similar reflectances at 442 and 510nm. The reflectance of SCIAMACHY for other wavelengths will also come closer to the results obtained by other instruments. However, except at 1600nm, the SCIAMACHY reflectances will remain on average smaller than those of MERIS and AATSR.
In a previous work, Kerridge et al. (2002) compared SCIAMACHY and AATSR reflectances for several heterogeneous ground scenes. In total, five scenes were analyzed and both SCIAMACHY and AATSR reflectances were averaged over larger scenes of 480*512km2. They found calibration coefficients equal to 1.13 (at 550nm), 1.10 (at
670nm), and 1.19 (at 870nm). The coefficient found at 870nm is in agreement with the one reported by us and also to that obtained using MERIS (see Table 1). The coefficients at smaller wavelengths are smaller than the ones we found but remain closer to those corresponding to average coefficients obtained from MERIS observations. This could be explained by the fact that coefficients reported by Kerridge et al. (2002) and also by Acarreta and Stammes (2005) correspond to highly heterogeneous scenes (e.g., water, vegetation, clouds). Our results characterize a somehow more homogeneous scene encompassing a hurricane. However our results still remain comparable with MERIS observations over water surfaces. Yet another possible reason of differences could come from the fact that previous AATSR-SCIAMACHY calibration studies were limited to scenes with lower reflectivity compared to the case studied in this paper.
Latter et al. (2003) found that the calibration coefficients are 1.15 (at 550nm), 1.05 (at 670nm), 1.24(at 870nm), and 1.13 (at 1600nm). They have also used AATSR for SCIAMACHY calibration based on the analysis of three complete orbits. However, instead of averaging AATSR pixels to the SCIAMACHY 30*60km2 scenes, much larger
ground scenes were selected.
3. Conclusions
We confirm that the current version of SCIAMACHY Processor (5.0) underestimates the TOA reflectance. The comparison of SCIAMACHY with AATSR measurements over a hurricane points out an underestimation of TOA reflectances by SCIAMACHY of 21%, 19%, 23%, and 10% at 550, 670, 870, and 1600nm, respectively, which is generally consistent with findings of Acarreta and Stammes (2005) using MERIS. Kerridge et al. (2002) used a similar approach as described in this paper and found calibration differences for SCIAMACHY around 13% (550nm), 10%(670nm), and 19%(870nm) as compared to AATSR with a small variability depending on the scene studied. Latter et al. (2003) reported the values of 15% (550nm), 5%(670nm), 24%(870nm), and 13%(1600nm) comparing AATSR and SCIAMACHY collocated measurements. The discrepancies of calibration constants reported by different authors could be due to the differences in the ground scenes and versions of processors used. Although there is a discrepancy with respect to the derived value of the SCIAMACHY calibration constants by different remote sensing groups, the underestimation of SCIAMACHY TOA reflectances can be considered as a well established fact now. Therefore, we conclude that it is of importance to introduce the next version of
SCIAMACHY processor as soon as possible in order to enable aerosol and cloud retrievals from SCIAMACHY measurements.
Clearly, because ENVISAT is planned to be in operation at least till 2010, more calibration efforts for SCIAMACHY will be needed in future (e.g., using Moon as a light source for calibration). This new re-calibration may remove small – scale oscillations present in the latest version of the calibration curve given in Fig.6.
Acknowledgements
This work has been supported by Alexander von Humboldt Foundation and DFG Project BU-688-2. Authors are grateful to B. Latter, R. Neil, S. Noël, D. L. Smith, P. Stammes, and W. von Hoyningen-Huene for a number of discussions related to the calibration issues of AATSR, MERIS, and SCIAMACHY.
References
Acarreta, J. R., and P. Stammes, 2005: Calibration comparison between SCIAMACHY and MERIS onboard ENVISAT, IEEE Geosci. Rem. Sens. Letters, 2, 31 - 35.
Bezy, J. L., S. Delwart, and M. Rast, 2000: MERIS - a new generation of ocean-colour sensor onboard ENVISAT, ESA Bulletin, 103, 48-56.
Borrell, P., P. M. Borrell, J. P. Burrows, and U. Platt, (Eds.), 2004: Sounding the Troposphere from Space. A New Era for Atmospheric Chemistry, Berlin: Springer.
Bovensmann, H., J. P. Burrows, M. Buchwitz, J. Frerick, S. Noël, V. V. Rozanov, K. V. Chance, and A. P. H. Goede, 1999: SCIAMACHY: Mission objectives and measurement modes, J. Atmos. Sci., 56, 127-150.
Delwart, S., L. Bourg, and J. P. Hout, 2004: MERIS 1st year: early calibration results, Proc. SPIE, 5234, 379-390.
Kerridge, B., R. Siddans, J. Reburn, B. Latter, and V. Jay., 2002: Intercomparison of MIPAS and SCIAMACHY L1 and L2 products with GOME and AATSR, Proc.
ENVISAT Validation Workshop, Frascati, Italy, December 9-13.
Kokhanovsky, A. A., and W. von Hoyningen-Huene et al., 2004: Optical properties of a hurricane, Atmos. Res., 69, 165-183.
Kokhanovsky, A. A. , W. von Hoyningen-Huene, V. V. Rozanov, et al., 2006a: The semianalytical cloud retrieval algorithm for SCIAMACHY. II. The application to MERIS and SCIAMACHY data, Atmos. Chem. Phys. Discussions, 6, 1813-1840.
Kokhanovsky, A. A., O. Jourdan, and J. P. Burrows, 2006b: The cloud phase discrimination from a satellite, IEEE Trans. Geosci. Rem. Sens., Letters, 3, 103-106.
Latter, B., R. Siddans, B. J. Kerridge., 2003: Intercomparison of reflectances observed by SCIAMACHY, GOME, AATSR, ATSR-2, Geophys. Res. Abstracts, 5, 30-1-2003.
Noël, S., 2005: Determination of correction factors for SCIAMACHY radiances and irradiances, University of Bermen, Germany, Technical Report, IFE-SCIA-SN-20050203_IrrRadCorrection. The report is available at the following website:
http://www.iup.physik.uni-bremen.de/sciamachy/SCIA_CAL/irrad_corr.pdf.
Smith, D. L., 2005: Intercalibration of AATSR and MERIS reflectances, Proc. of the MERIS(A)ATSR Workshop 2005, Frascati, Italy, 26-30 September (ESA SP-597, December 2005).
Tilsra, G., P. Stammes, 2006: Level 1-1 calibration study: SCIAMACHY versus POLDER, Proceedings of Atmospheric Science Conference, Frascati: May 8-12, 2006. von Hoyningen-Huene, W., A. A. Kokhanovsky, M. W. Wuttke, et al., 2006: Validation of SCIAMACHY top-of-atmosphere reflectance for aerosol remote sensing using MERIS L1 data, Atmos. Chem. Phys. Discussions, 6, 673-699.
Table 1. The values of the calibration coefficient C averaged for different ground scenes ,
nm C Reference
442 1.13 Acarreta and Stammes (2005) (ocean:1.18)
443 1.12 Tilstra and Stammes (2006) (POLDER)
490 1.13 Tilstra and Stammes (2006) (POLDER)
510 1.13 Acarreta and Stammes (2005) (ocean:1.17)
550 1.21 this work
565 1.14 Tilstra and Stammes (2006) (POLDER)
665 1.15 Acarreta and Stammes (2005) (ocean:1.19)
670 1.19 this work
708 1.18 Acarreta and Stammes (2005) (ocean: 1.21)
765 1.16 Tilstra and Stammes (2006) (POLDER)
870 1.23 this work
885 1.21 Acarreta and Stammes (2005) (ocean:1.25)
910 1.21 Tilstra and Stammes (2006) (POLDER)
Figure captions
Fig. 1 Browse image of Hurricane Isabel as seen by AATSR.
Fig.2 Correlation between AATSR and SCIAMACHY reflectances at 550nm.
Fig.3 The same as in Fig.2 except at 670nm.
Fig.4 The same as in Fig.3 except at 870nm.
Fig.5 The same as in Fig.2 except at 1600nm.
Fig.6 Spectral dependence of the calibration factor measured at ground (Noel, 2005) and also using AATSR, MERIS and POLDER. Bars show the estimated MERIS calibration error of 4% (Delwart et al., 2004). The difference in calibrations of MERIS and AATSR are smaller than 3% with the overestimation by AATSR (Smith, 2005).
0.0 0.2 0.4 0.6 0.8 1.0 0.0 0.2 0.4 0.6 0.8 1.0 A A T S R R ef le ct an ce ( 55 0n m ) SCIAMACHY Reflectance (550nm)
Raatsr=1.21Rscia-3.6E-4 Correlation coeff = 0.990
0.0 0.2 0.4 0.6 0.8 1.0 0.0 0.2 0.4 0.6 0.8 1.0 A A T S R R ef le ct an ce ( 67 0n m ) SCIAMACHY Reflectance (670nm) Raatsr=1.19Rscia+0.0025 Correlation coeff = 0.991 Fig.3
0.0 0.2 0.4 0.6 0.8 1.0 0.0 0.2 0.4 0.6 0.8 1.0 A A T S R R ef le ct an ce ( 87 0n m ) SCIAMACHY Reflectance (870nm) Raatsr=1.23Rscia+0.0042 Correlation coeff = 0.984 Fig.4
0.0 0.2 0.4 0.6 0.0 0.2 0.4 0.6 A A T S R R ef le ct an ce ( 16 00 nm ) SCIAMACHY Reflectance (1600nm) Raatsr=1.10Rscia-0.0028 Correlation coeff = 0.984 Fig.5
0 500 1000 1500 2000 2500 1.00 1.05 1.10 1.15 1.20 1.25 1.30 C al ib ra tio n fa ct or Wavelength, nm ground MERIS AATSR POLDER Fig.6