HAL Id: hal-00300955
https://hal.archives-ouvertes.fr/hal-00300955
Submitted on 18 Jan 2006HAL is a multi-disciplinary open access
archive for the deposit and dissemination of sci-entific research documents, whether they are pub-lished or not. The documents may come from teaching and research institutions in France or abroad, or from public or private research centers.
L’archive ouverte pluridisciplinaire HAL, est destinée au dépôt et à la diffusion de documents scientifiques de niveau recherche, publiés ou non, émanant des établissements d’enseignement et de recherche français ou étrangers, des laboratoires publics ou privés.
Validation of SCIAMACHY top-of-atmosphere
reflectance for aerosol remote sensing using MERIS L1
data
W. von Hoyningen-Huene, A. A. Kokhanovsky, M. W. Wuttke, M. Buchwitz,
S. Noël, K. Gerilowski, J. P. Burrows, B. Latter, R. Siddans, B. J. Kerridge
To cite this version:
W. von Hoyningen-Huene, A. A. Kokhanovsky, M. W. Wuttke, M. Buchwitz, S. Noël, et al.. Validation of SCIAMACHY top-of-atmosphere reflectance for aerosol remote sensing using MERIS L1 data. Atmospheric Chemistry and Physics Discussions, European Geosciences Union, 2006, 6 (1), pp.673-699. �hal-00300955�
ACPD
6, 673–699, 2006 SCIAMACHY aerosol remote sensing W. von Hoyningen-Huene et al. Title Page Abstract Introduction Conclusions References Tables Figures J I J I Back Close Full Screen / EscPrint Version Interactive Discussion
EGU Atmos. Chem. Phys. Discuss., 6, 673–699, 2006
www.atmos-chem-phys.org/acpd/6/673/ SRef-ID: 1680-7375/acpd/2006-6-673 European Geosciences Union
Atmospheric Chemistry and Physics Discussions
Validation of SCIAMACHY
top-of-atmosphere reflectance for aerosol
remote sensing using MERIS L1 data
W. von Hoyningen-Huene1, A. A. Kokhanovsky1, M. W. Wuttke1, M. Buchwitz1, S. No ¨el1, K. Gerilowski1, J. P. Burrows1, B. Latter2, R. Siddans2, and
B. J. Kerridge2
1
Institute of Environmental Physics/Remote Sensing, University of Bremen, Germany
2
Space Science and Technology Department, Rutherford Appleton Laboratories, Chilton, UK Received: 2 April 2004 – Accepted: 7 February 2005 – Published: 18 January 2006
Correspondence to: W. von Hoyningen-Huene ([email protected]) © 2006 Author(s). This work is licensed under a Creative Commons License.
ACPD
6, 673–699, 2006 SCIAMACHY aerosol remote sensing W. von Hoyningen-Huene et al. Title Page Abstract Introduction Conclusions References Tables Figures J I J I Back Close Full Screen / EscPrint Version Interactive Discussion
EGU Abstract
Aerosol remote sensing is very much dependent on the quite accurate knowledge of the top-of-atmosphere (TOA) reflectance retrieved by a particular instrument. The sta-tus of the calibration of such an instrument thus is reflected in the quality of the aerosol retrieval. Currently the SCIAMACHY (SCanning Imaging Absorption spectroMeter for 5
Atmospheric CHartographY) instrument gives too low values of the TOA reflectance, compared e.g. to data from MERIS (Medium Resolution Imaging Spectrometer), both operating on ENVISAT (ENVIronmental SATellite), but the calibration of the operational L1 product of SCIAMACHY is not yet finished.
From an inter-comparison of MERIS and SCIAMACHY TOA reflectance, for collo-10
cated scenes correction factors are derived to improve the current SCIAMACHY L1 data for the purpose of aerosol remote sensing. The corrected reflectance has been used for a first remote sensing of the aerosol optical thickness by the BAER (Bremen AErosol Retrieval) approach using SCIAMACHY data.
1. Introduction
15
In recent time several approaches for the retrieval of the aerosol optical thickness (AOT) over land and ocean from nadir scanning satellite radiometers have been developed. For MODIS over land the cross-correlation approach, c.f. Kaufman et al. (1997) is used. For SeaWiFS (Sea viewing Wide Field Sensor) and MERIS (Medium Resolution Imaging Spectrometer, c.f.MERIS SAG,1995;Bezy et al.,2000) the BAER approach 20
(Bremen AErosol Retrieval), c.f.von Hoyningen-Huene et al. (2003) has been tested successfully, using 8 visible and NIR channels of the instruments. SCIAMACHY and MERIS are operated by ESA onboard of ENVISAT. Since SCIAMACHY, c.f. Bovens-mann et al. (1999) is providing high spectral resolution and a much extended spectral range, comparable spectral information as used in the BAER approach is available in 25
ACPD
6, 673–699, 2006 SCIAMACHY aerosol remote sensing W. von Hoyningen-Huene et al. Title Page Abstract Introduction Conclusions References Tables Figures J I J I Back Close Full Screen / EscPrint Version Interactive Discussion
EGU SCIAMACHY data too. However the formal use of the BAER approach leads to
physi-cally not meaningful negative AOT, if one uses SCIAMACHY top-of-atmosphere (TOA) reflectance directly. This is due to the fact, that the measured TOA reflectance, using data of the present processor version (4.02b) within the required spectral bands can be below the value for the Rayleigh path reflectance, which should be never the case. 5
These findings are also reported byDe Graaf and Stammes(2003).
Therefore the application of any retrieval procedure for the determination of aerosol parameters, as AOT or absorbing aerosol index (AAI) in a quite accurate, physically correct range requires the improvement of the values of the TOA reflectance for the SCIAMACHY bands, used for the aerosol retrieval.
10
Since the BAER approach has been applied successfully with MERIS L1 data, these MERIS data will be used for the derivation of correction factors to improve the SCIA-MACHY TOA reflectance for the purpose of aerosol remote sensing. Applying these corrections a first attempt is made to retrieve AOT for 0.442 µm from SCIAMACHY data.
15
2. SCIAMACHY data preparation and reflectance correction
For the purpose of correcting the TOA reflectance, obtained with SCIAMACHY L1b data, coinciding SCIAMACHY and MERIS scenes are used. Since both instruments are on board of ENVISAT and scanning in nearly the same swath, a comparison of the TOA reflectance for the bands 3, 4 and 5 of SCIAMACHY could improve the TOA 20
reflectance for the purpose of the retrieval of the AOT by the BAER approach. Therefore, for both instruments the TOA reflectance from the L1 data are derived. The TOA radiance L(λ) from the L1 data is normalized to the solar illumination con-ditions for each wavelength λ to generate the TOA-reflectance ρTOA(λ):
ρTOA(λ)=π L(λ)
E0(λ) · M(z0), (1)
ACPD
6, 673–699, 2006 SCIAMACHY aerosol remote sensing W. von Hoyningen-Huene et al. Title Page Abstract Introduction Conclusions References Tables Figures J I J I Back Close Full Screen / EscPrint Version Interactive Discussion
EGU where M(z0) is the airmass factor for the solar zenith distance z0, E0(λ) is the
ex-traterrestrial irradiance and L(λ) is the measured TOA-radiance. The function E0(λ) is provided for MERIS and SCIAMACHY from the L1 data sets. The airmass factors are determined for the given solar zenith distance z0. Since in high latitudes for large solar zenith distances (z0>60◦) atmospheric curvature gets of increased relevance, therefore 5
M(z0) is determined byKasten and Young(1989) and not by 1/ cos(z0).
Since both instruments (SCIAMACHY and MERIS) differ in their spectral and spatial observation parameters, the data must be made comparable. In particular, they must be transferred to comparable spectral bands, band widths and spatial scales. Also we should observe the same uniform target (preferably, for clear sky conditions).
10
For the comparability of the spectral bands the spectrum of the TOA reflectance of the SCIAMACHY measurement for the spectral regions and band widths of channels of the MERIS instrument has been extracted and integrated over the band width.
Both pixels are selected for the same latitude and longitude, given by the geo-location information of the observation.
15
Due to the different spatial scales of the TOA reflectance, the data from all MERIS pixels within the 30×60 km pixel area (determined by the edge coordinates of a SCIA-MACHY pixel) of SCIASCIA-MACHY have been averaged within the area.
The comparison of such different spatial scales also requires to exclude large in-homogeneities, such as clouds and inhomogeneous surface properties within the re-20
gion of a SCIAMACHY pixel. Therefore, for this comparison homogeneous water sur-faces are used. The value of the standard deviation of ρMERISTOA within one SCIAMACHY pixel should be lower than 10%. In the most selected case it is even lower than 5%. The exclusion of inhomogeneous pixels removes the majority of pixels from the inter-comparison, however it reduces the standard deviation and fits the data for one SCIA-25
MACHY band on a linear relation. All other pixels show much higher inhomogeneities in terms of much larger standard deviations of the TOA reflectance of the MERIS pixels within one SCIAMACHY pixel. Such pixels with high standard deviations have been not used for the comparison. Figure1shows the TOA reflectance for the wavelength band
ACPD
6, 673–699, 2006 SCIAMACHY aerosol remote sensing W. von Hoyningen-Huene et al. Title Page Abstract Introduction Conclusions References Tables Figures J I J I Back Close Full Screen / EscPrint Version Interactive Discussion
EGU of 0.865 µm for both instruments. The coinciding area of observations and the selected
homogeneous pixels over water surfaces are marked within the MERIS scene.
The selected spectral regions, coinciding with MERIS channels are demonstrated in Fig.2and in Table1. For the comparison only such spectral channels are used, where the spectrum of the TOA reflectance is smooth enough and not disturbed by strong 5
gas absorption. Thus the MERIS channels 11 (O2A-band) and 15 (H2O-band) are not used for comparisons. The used MERIS channels are indicated in Table1.
While MERIS has fixed channels with a defined center wavelength and a fixed band width, SCIAMACHY scans a high resolution spectrum with a pixel resolution of about 0.2 nm within one band region. The bands 3 (0.424–0.565 µm), 4 (0.613–0.775 µm) 10
and 5 (0.798–0.946 µm) are covered by MERIS channels.
The channel 1 of MERIS (see Fig.2) cannot be used, because of the gap between SCIAMACHY band 2 and band 3. For the determination of a correction factor for band 3 the MERIS channels 2, 3, 4 and 5 could be used.
For the correction factor of SCIAMACHY band 4 only the MERIS channels 7 and 15
12 are used until now, because they are part of the present BAER approach. Since MERIS provides more spectral information for control and confirmation of the derived correction factor for band 4, the channels 6, 8, 9 and 10 could be added for the com-parison. For the comparison with MERIS channel 12 we had to avoid disturbances by the O2-A-band, integrating the corresponding SCIAMACHY data.
20
For SCIAMACHY band 5 until now only 1 channel of the BAER approach could be used for comparisons. However, also here the MERIS channels 13 and 14 could be added. Especially in the cases of band 5 we avoided to include disturbed spectral regions within the comparisons. Here are several regions affected by stronger nar-rowband gas absorption and Fraunhofer lines, thus we reduced the selected spectral 25
channel for the purpose of a later aerosol remote sensing.
Examples for SCIAMACHY TOA reflectance spectra from cloudless scenes over the Baltic Sea, which are used within this study, are presented in Fig.3.
ACPD
6, 673–699, 2006 SCIAMACHY aerosol remote sensing W. von Hoyningen-Huene et al. Title Page Abstract Introduction Conclusions References Tables Figures J I J I Back Close Full Screen / EscPrint Version Interactive Discussion
EGU used: (a) simple ratio and (b) linear fitting of data. The latter enables also the
consid-eration of a certain offset.
The ratios of the TOA reflectance of both instruments are determined by
C= ρMERIS(λ)
ρSCIA(λ) . (2)
For the different channels of MERIS within one SCIAMACHY band, e.g. band 3, in 5
the most cases the derived values of C are quite stable. Thus we determined for band 3 an average correction factor by fitting a linear function through the corresponding data for one band. The same is made for the other SCIAMACHY bands.
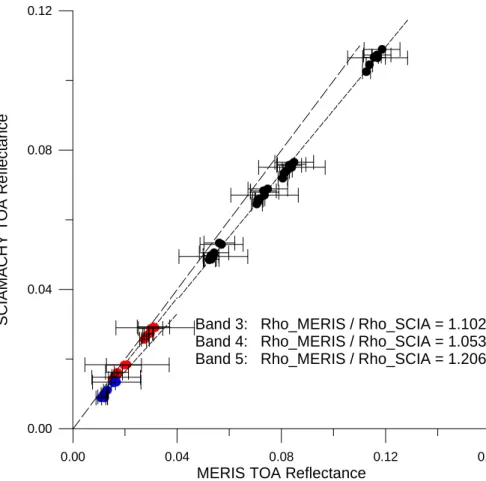
The obtained relationships between the both reflectance for the coinciding pixels is shown in Fig.4. The slopes are used to derive average correction factors for the SCIA-10
MACHY bands, e.g. band 3 (0.424–0.565 µm), band 4 (0.613–0.775 µm) and band 5 (0.798–946 µm).
The correction of the TOA reflectance to the level of MERIS, which is used within the BAER approach for the retrieval of AOT is achieved by:
ρMERIS(λ)= C1· ρSCIA(λ)+ C0. (3)
15
The correction factors obtained are presented in Table2.
These factors are very similar with findings of De Graaf and Stammes (2003) on a broader database. Also comparison with AATSR (Advanced Along Track Scanning Radiometer), provided by Kerridge (private communication, 2004)1, give very similar results.
20
However the correction factors seem to have also a certain spectral variability within the single bands. The obtained correction factors for the comparison with the single MERIS channels gives their spectral behavior, presented in Fig.5.
The minimum of the required correction is in band 4 at about 0.65 µm, the largest correction is in band 5 depending on processor version. The standard deviations of 25
1
ACPD
6, 673–699, 2006 SCIAMACHY aerosol remote sensing W. von Hoyningen-Huene et al. Title Page Abstract Introduction Conclusions References Tables Figures J I J I Back Close Full Screen / EscPrint Version Interactive Discussion
EGU the results are increasing with the wavelength, because of decreasing TOA reflectance
signals.
Presently attempts are undertaken to improve the radiometric calibration by an ex-tensive reanalysis of the on ground calibration measurements of SCIAMACHY. A new procedure has been developed to recalculate some of the radiometric key data from 5
existing end-to-end measurements of the OPTEC 5 period in 1999/2000. The calcula-tions were primarily based on a subset of NASA integrating sphere measurements, per-formed for SCIAMACHY’s radiance and irradiance. The derived new SCIAMACHY key data show a significant difference to the on-ground ambient measured and calculated Bi-directional Reflectance Distribution Function (BRDF) keydata of SCIAMACHY’s El-10
evation Scan Mirror Diffuser (ESM diffuser). Together with a re-determined nadir and limb sensitivity of the instrument, this leads to correction factors for both solar irradi-ance and reflectirradi-ance, going into the same directions, like the correction factors derived from the comparison with MERIS TOA reflectance. First tests with in-flight measure-ments show a significant improvement of the quality of the level-1 data products when 15
using these new key data. This preliminary result of this attempt is shown as black curve in Fig.5.
After these investigations the derived correction factors will be applied for the SCIA-MACHY bands 3, 4 and 5 to improve the TOA reflectance for the purpose of the applica-tion of the BAER approach, resulting in the retrieved AOT from cloud free SCIAMACHY 20
data.
3. Short description of the BAER approach
The BAER approach has been developed for the aerosol remote sensing over land surface using SeaWiFS or MERIS L1 data, c.f.von Hoyningen-Huene et al.(2003). The BAER approach separates the aerosol reflectance by subtraction of the contributions 25
of Rayleigh scattering and the surface reflectance for each pixel. For this purpose the approach makes use of the solution of the radiative transfer equation for the TOA
ACPD
6, 673–699, 2006 SCIAMACHY aerosol remote sensing W. von Hoyningen-Huene et al. Title Page Abstract Introduction Conclusions References Tables Figures J I J I Back Close Full Screen / EscPrint Version Interactive Discussion
EGU reflectance, as described byKaufman et al.(1997) and derives the aerosol reflectance:
ρAer(λ)= ρTOA(λ) − ρRay(λ, z0, zS, pSurf(z)) −T (λ, MS) · T (λ, M0) · ASurf(λ, z0, zS)
1 − ASurf(λ, z0, zS) · ρHem(λ, z0) . (4)
Here ρAer(λ) and ρTOA(λ) are the required aerosol reflectance and the TOA re-flectance, respectively. T (λ, M) is the total atmospheric transmission, containing di-rect and diffuse transmission for illumination and viewing geometry, composed from 5
T (λ, M)=TRay(λ, M)·TAer
Guess(λ, M), which are the total transmittances including Rayleigh scattering and aerosol extinction. The latter requires a rough estimation of an AOT, which is performed at 0.443 µm using the assumption of a “black” surface. MO and
MS are the air mass factors for the sun zenith distance zo and the observer zenith distance zS. ρRay(λ, zO, zS, pSurf(z)) is the path reflectance of the Rayleigh scattering. 10
ASurf(λ, zO, zS) is the surface albedo and ρHem(λ, zO) is the hemispheric atmospheric reflectance. The influence of the hemispheric reflectance is less important over low reflecting surfaces (ocean and green vegetation in the blue region of the spectrum). A description of the used parameterizations for the total transmittances and the hemi-spheric reflectance is given in the Appendix.
15
The BAER approach comprises the following main steps to determine the aerosol reflectance as the basis for the application of look-up-tables (LUT), which relate AOT and aerosol reflectance.
The main steps for the determination of the aerosol reflectance are:
(a) The determination of the spectral TOA reflectance for the selected bands (for 20
SCIAMACHY, in this step the correction factors are used).
(b) The subtraction of the Rayleigh path reflectance for the geometry conditions of illumination and observation within the pixel.
ACPD
6, 673–699, 2006 SCIAMACHY aerosol remote sensing W. von Hoyningen-Huene et al. Title Page Abstract Introduction Conclusions References Tables Figures J I J I Back Close Full Screen / EscPrint Version Interactive Discussion
EGU by mixing of different basic spectra to an apparent surface reflectance over land by
equations 5, 7 and 9, respectively over ocean equations 6, 8 and 9.
Over land spectra of a “green vegetation” and “bare soil” type are mixed following Eq. (7), tuned by the NDVI (normalized differential vegetation index),
NDVI= ρ ∗
(0.870 µm)−ρ∗(0.665 µm)
ρ∗(0.870 µm)+ ρ∗(0.665 µm); (5)
5
over ocean “clean ocean water” and “coastal water” type spectra are mixed using the NDPI (normalized differential pigment index),
NDPI= ρ ∗
(0.443 µm)−ρ∗(0.560 µm)
ρ∗(0.490 µm) : (6)
over land with CVeg = f (NDVI), the vegetation fraction,
ρSurf(λ)= F · [CVeg· ρVeg(λ)+ (1 − CVeg) · ρSoil(λ)] (7) 10
and over ocean with CClear= f (NDPI), the clear water fraction,
ρSurf(λ)= F · [CClear· ρClear(λ)+ (1 − CClear) · ρCoastal(λ)]. (8) The basic surface type spectra ρVeg(λ), ρSoil(λ), ρClear(λ) and ρCoastal(λ) for “green vegetation”, “bare soil”, “clean ocean water” and “coastal water” are given by von Hoyningen-Huene et al. (2003). F is a scaling factor for the level of the surface re-15
flectance determined at 0.665 µm:
F = ρTOA− ρRay− ρAer
CVeg· ρVeg(λ)+ (1 − CVeg) · ρSoil(λ) (9)
over land or the corresponding expression for the ocean.
(d) Smoothing the spectral AOT, using an Angstr ¨om power law, by the iterative mod-ification of the apparent surface reflectance:
20
ACPD
6, 673–699, 2006 SCIAMACHY aerosol remote sensing W. von Hoyningen-Huene et al. Title Page Abstract Introduction Conclusions References Tables Figures J I J I Back Close Full Screen / EscPrint Version Interactive Discussion EGU with ∆i(λ)= δA(λ) − ¯δA(λ) δA(λ) . (11) ¯
δA(λ)=β·λ−α is obtained from the fit of an Angtr ¨om power law through the retrieved spectral AOT δA(λ) of the different channels. A sufficient smoothness of the spectrum of the AOT is reached at a minimal RMSD
5 RMSD= 1 N s X N (δA(λ) − ¯δA(λ))2. (12)
The aerosol reflectance ρAer(λ) is then used to derive the AOT applying LUT: δA(λ)=
f (ρAer(λ)). The LUT is obtained by radiative transfer modelling (RTM). In this case for the LUT aerosol parameters, mainly aerosol phase functions with increased lateral scattering, obtained in the LACE-98 experiment (Ansmann et al.,2001;von
Hoyningen-10
Huene et al.,2003) are used. These parameters have shown to be very robust in a lot of other applications as for the determination of the AOT close to ground-based data, c.f.Kokhanovsky et al.(2004),Lee et al.(2004),von Hoyningen-Huene et al.(2004).
4. First results with the BAER approach using SCIAMACHY L1b data
For a first test of the possibility to retrieve AOT with SCIAMACHY, the BAER approach 15
in the same way is used, like it is developed for the application with MERIS or SeaWiFS data, von Hoyningen-Huene et al.(2003,2004), but using the correction factors from the analysis above.
Specific problems, connected with the larger pixel scale of SCIAMACHY (30×60 km2) compared with that of MERIS RR (reduced resolution) (1.1×1.1 km2), are 20
ACPD
6, 673–699, 2006 SCIAMACHY aerosol remote sensing W. von Hoyningen-Huene et al. Title Page Abstract Introduction Conclusions References Tables Figures J I J I Back Close Full Screen / EscPrint Version Interactive Discussion
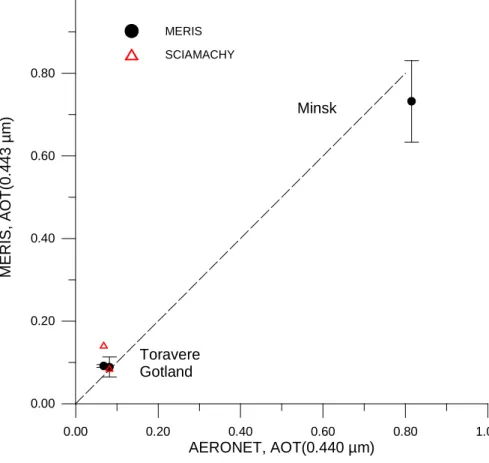
EGU The result for the channel 2 (0.443 µm) is compared (a) with ground-based
AERONET measurements, c.f. Holben et al. (1998), presented in Fig. 6and (b) with the retrievals, made with MERIS data, presented in Fig.7.
With the correction factors for SCIAMACHY, the AOT in a physically meaningful range can be obtained. For cloud free sections even comparable AOT with two AERONET 5
instruments in the scene could be obtained. However, if one compare the retrieved values within the whole scene, c.f. Fig. 7, one must recognize, that they deviate in particular significantly from the results obtained by MERIS.
The reasons might by very different: (a) insufficient corrections of biasses within the scan line, caused by mirror and polarization corrections applied during the L1c 10
data processing, (b) insufficient cloud screening for the SCIAMACHY pixels, (c) differ-ent mixing of the land surface and ocean surface properties, to be adequate for the spatial scale of SCIAMACHY pixels, (d) use of an inadequate digital elevation model (GTOPO30) for the scale of SCIAMACHY pixels. Therefore in the present status of the adaptation of the aerosol remote sensing to the SCIAMACHY data a comparison 15
must be restricted to simple cases, e.g. no mountain regions with significant surface elevations, scenes with no or very few clouds.
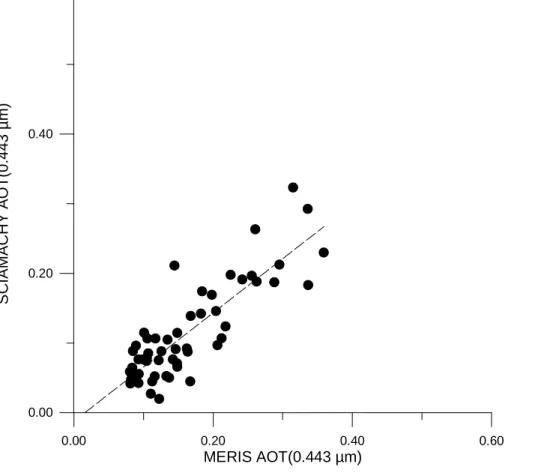
For the comparability of the results we integrated the MERIS results over the size of the SCIAMACHY pixels. The standard deviation and the fully cloudy MERIS pixels are used to reject pixels as cloud contaminated. Further, we excluded all pixels, with 20
surface elevations >250 m. Thus the most pixels over Sweden, which had strong pos-itive deviations in AOT, have been removed. The result for the channel at 0.443 µm is presented in8. This selection reduces the number of comparable pixels. However, the remaining part is very comparable with the results of MERIS. The fit between both re-sults gives AOTSCIA=0.778·AOTMERIS−0.01235. This result shows that principally the 25
AOT can be derived by BAER using SCIAMACHY measurements and the instrument is sensitive enough to observe aerosol properties, if an adequate calibration is available. The present approach with SCIAMACHY data underestimates for cloud free scenes the AOT, compared with the results of MERIS. For a better comparability and the
ap-ACPD
6, 673–699, 2006 SCIAMACHY aerosol remote sensing W. von Hoyningen-Huene et al. Title Page Abstract Introduction Conclusions References Tables Figures J I J I Back Close Full Screen / EscPrint Version Interactive Discussion
EGU plication also for elevated terrains there is a need to adapt the approach to the specific
scale of the SCIAMACHY observations.
5. Conclusions
This study showed, that principally SCIAMACHY measurements are sensitive enough for a remote sensing of aerosol properties, if one applies correction factors to the TOA 5
reflectance. Since the remote sensing of the AOT as well also of the AAI is very sensitive to the exact level of TOA reflectance, the present L1c calibration (processor version v4.02b) is not sufficient to this task and needs to be improved.
Correction factors could be derived from comparisons of coinciding SCIAMACHY and MERIS scenes.
10
Performing this study, we realized, that the selection of useful coinciding data of both instruments, MERIS and SCIAMACHY, is sometimes difficult, because of problems with the availability of both information for the suitable observation situation (limb-nadir matching, cloud disturbances, missing data, different processing levels etc.)
The different processing levels until version 4.02b, do not improve the reflectance 15
level at all in the required way. They give improvements for the consideration of polar-ization effects and reduce the bias within one scan line, however not the general level of the reflectance. However, the bias within the scan line (from W to E) seems to be not fully compensated. Concluding from this first results of AOT retrievals, a remaining bias within the scan line can be observed, giving higher AOT at the left side and lower 20
at the right side of the scan line.
The finding for the correction factors are consistent with findings of De Graaf and Stammes (2003) andAcarreta and Stammes (2005), providing similar investigations over bright desert surface, using MERIS and GOME. The same is found by Kerridge (private communication, 2004)1 comparing SCIAMACHY reflectance with AATSR. 25
ACPD
6, 673–699, 2006 SCIAMACHY aerosol remote sensing W. von Hoyningen-Huene et al. Title Page Abstract Introduction Conclusions References Tables Figures J I J I Back Close Full Screen / EscPrint Version Interactive Discussion
EGU Kokhanovsky et al. (2004)2came from investigations of cloud retrieval techniques and
their comparison with MERIS results to very comparable results with this study. And, finally, the recalculation of the calibration key data, using the on ground measurements of the SCIAMACHY instrument during the OPTEC-5 campaign give very similar results for the considered spectral region. This implements an urgent need to find consolidated 5
results for an improve of the radiometric calibration of the SCIAMACHY instrument and its implementation to the L1 processing.
Promising are also the tests of the new radiometric key data of the spectralon cal-ibration, provided byAcarreta and Stammes (2005) reducing the deviations between MERIS and SCIAMACHY to few percent. Considering the given accuracy of the MERIS 10
reflectance,Delwart et al.(2004), the new radiometric key data eliminate significant ra-diometric differences between both instruments.
The application of the correction factors obtained within this study enabled us to improve the SCIAMACHY TOA reflectance to a level, that no more the TOA reflectance was below the value of the Rayleigh path reflectance and an aerosol remote sensing 15
by the BAER approach could be tested. Thus, under ideal conditions the AOT in a physically meaningful range could be obtained, comparable also with ground-based AERONET measurements.
A very important step within the application of an aerosol remote sensing algorithm for SCIAMACHY data is a rigorous cloud screening, which is still open for this scale. 20
The approach for the aerosol remote sensing is still not adapted to the spatial scale of SCIAMACHY. Especially the digital elevation model and the mixing rules for the estimation of the spectral surface properties need to be adapted to the larger spatial scale of SCIAMACHY (30×60 km2).
2
Kokhanovsky, A. A., von Hoyningen-Huene, W., Rozanov, V. V., No ¨el, S., Gerilowski, K., Bovensmann, H., Bramstedt, K., Buchwitz, M., and Burrows, J. P.: The semianalytical cloud retrieval algorithm for SCIAMACHY. II. The application to MERIS and SCIAMACHY, Atmos. Chem. Phys. Discuss., submitted, 2004.
ACPD
6, 673–699, 2006 SCIAMACHY aerosol remote sensing W. von Hoyningen-Huene et al. Title Page Abstract Introduction Conclusions References Tables Figures J I J I Back Close Full Screen / EscPrint Version Interactive Discussion
EGU Appendix
Total transmission and hemispheric reflectance
In Eq. (4) total atmospheric transmissions and hemispheric reflectance are used, containing the effect of multiple scattering. The total transmittance and hemispheric reflectance are determined using the SCIATRAN radiative transfer model (RTM), 5
Rozanov et al. (2001) and the results are applied in a parameterized form for a fast processing within the retrieval procedure. Here we separate the total atmospheric transmission into their fractions for Rayleigh and aerosol scattering:
T (λ, M(z))= TRay(λ, M(z)) · TAer(λ, M(z)), (13) with the total transmission for the Rayleigh and aerosol scattering, respectively
10
TRay(λ, M(z))= exp (−βRay· δRay(λ) · M(z))
TAer(λ, M(z))= exp (−βAer· δAer(λ) · M(z)), (14)
where M(z) is the airmass factor for the zenith distance z, δX(λ) – the optical thick-ness for Rayleigh or aerosol scattering and βX (X ≡Ray, Aer) a weighting factor for the combined effect of multiple and single scattering of molecules and aerosols, depending 15
on M(z). For the aerosol an asymmetry parameter g=0.7 is assumed. The weighting factors βX are obtained as polynomials of M(z).
βRay= 5 X i=1 bRayi · M(z)−(i−1)) (15) βAer= 5 X i=1 bAeri · M(z)−(i−1)) (16)
ACPD
6, 673–699, 2006 SCIAMACHY aerosol remote sensing W. von Hoyningen-Huene et al. Title Page Abstract Introduction Conclusions References Tables Figures J I J I Back Close Full Screen / EscPrint Version Interactive Discussion
EGU The coefficients of the polynomials are given in Table 3. For the hemispheric
re-flectance the following parametrization is obtained:
ρHem(λ, zO)= 4 X i=1
ai· δi(λ) (17)
For the cases of aerosol remote sensing over Europe the error of the parametrization is below 5% compared with the results of the RTM.
5
Acknowledgements. The authors like to express their gratitude to the operators of the
AERONET sites in Gotland, Minsk and Toravere, B. Hakansson, A. Chaikovsky, P. Goloub and O. K ¨arner. This work has been supported by the German BMBF grant 50EE0012 within the SCIAVAL program.
References
10
Acarreta, J. R. and Stammes, P.: Calibration comparison between SCIAMACHY and MERIS onboard of ENVISAT, IEEE GRSL, 2, 31–35, 2005. 684,685
Ansmann, A., Wandinger, U., Wiedensohler, A., and Leiterer, U.: Lindenberg Aerosol Char-acterization Experiment 1998 (LACE 98): Overview, J. Geophys. Res. 107(D21), 8129, doi:10.1029/2000JD000233, 2002. 682
15
Bezy, J.-L., Delwart, S., and Rast, M.: MERIS – A new generation of ocean colour sensor onboard ENVISAT, ESA Bulletin, 103, 48–56, 2000. 674
Bovensmann, H., Burrows, J. P., Buchwitz, M., Frerick, J., No ¨el, S., Rozanov, V. V., Chance, K. V., and Goede, A. H. P.: SCIAMACHY: Mission objectives and measurement methods, J. Atmos. Sci., 56, 127–150, 1999. 674
20
De Graaf, M. and Stammes, P.: Verification of SCIAMACHY’s Absorbing Aerosol Index product, Proc. of ENVISAT Validation Workshop, ESRIN, Frascati, 9–13 Dec. 2003, ESA SP-531, 2003. 675,678,684
Delwart, S., Bourg, L., and Huot, J. P.: MERIS 1st year: Early calibration results, Proc. SPIE Sensors, systems and next generation satellites VII, vol. 5234, 379–390, 2004. 685
ACPD
6, 673–699, 2006 SCIAMACHY aerosol remote sensing W. von Hoyningen-Huene et al. Title Page Abstract Introduction Conclusions References Tables Figures J I J I Back Close Full Screen / EscPrint Version Interactive Discussion
EGU
Holben, B. N., Eck, T. F., Slutsker, K., Tanr ´e, D., Buis, J. P., Setzer, A., Vermote, E. Reagan, J. A., Kaufman, Y. J., Nakajima, T., Lavenu, F., Jankowiak, I., and Smirnow, A.: AERONET-a federated instrument network and data archive for aerosol characterization, Remote Sens. Environ., 66, 1–16, 1998. 683
Kasten, F. and Young, A. T.: Revised optical airmass tables and approximation formula, Appl. 5
Opt., 28, 4735–4738, 1989. 676
Kaufman, Y. J., Tanr ´e, D., Gordon, H. R., Nakajima, T., Lenoble, J., Frouin, R., Grassl, H., Herman, B. M., King, M. D., and Teillet, P. M.: Passive remote sensing of tropospheric aerosol and atmospheric correction for the aerosol effect, J. Geophys. Res., 102, 16 815–16 830, 1997. 674,680
10
Kokhanovsky, A. A., von Hoyningen-Huene, W., Bovensmann, H., and Burrows, J. P.: The determination of the atmospheric optical thickness over Western Europe using SeaWiFS imagery, IEEE Transac. Geosci. Remote Sensing, 42, 824–832, 2004. 682
Lee, K. H., Kim, Y. J., and von Hoyningen-Huene, W.: Estimation ofnregional aerosol optical thickness from satellite observations during the 2001 ACE-Asia IOP, J. Geophys. Res., 109, 15
doi:10.1029/2003JD004126, 2004. 682
MERIS Scientific Advisory Group: MERIS: The Medium Resolution Imaging Spectrometer, ESA Technical Report SP-1184, ESA, Noordwijk, 1995. 674
Rozanov, V. V., Buchwitz, M., and Burrows, J. P.: SCIATRAN – A new radiative transfer model for geophysical applications in the 240–2400 nm spectral region: The pseudo-spherical ver-20
sion, Adv. Space Res., 29, 1831–1835, 2001. 686
von Hoyningen-Huene, W., Freitag, M., and Burrows, J. P.: Retrieval of aerosol optical thick-ness over land surfaces from top-of-atmospher radiance, J. Geophys. Res., 108, 4260, doi:10.1029/2001JD002018, 2003. 674,679,681,682
von Hoyningen-Huene, W., Kokhanovsky, A. A., Freitag, M., and Burrows, J. P.: Aerosol re-25
trieval over land surfaces from multispectral nadir looking satellite measurements, in: Re-mote Sensing of Clouds and the Atmosphere VIII, edited by: Sch ¨afer, K. P., Cameron, A., Carleer, M. R., and Picard, R. H., Proc. of SPIE (SPIE, Bellingham, WA 2004), vol. 5235, 366–374, 2004. 682
ACPD
6, 673–699, 2006 SCIAMACHY aerosol remote sensing W. von Hoyningen-Huene et al. Title Page Abstract Introduction Conclusions References Tables Figures J I J I Back Close Full Screen / EscPrint Version Interactive Discussion
EGU
Table 1. SCIAMACHY bands and MERIS channels with their channel characteristics and the
used integration range for the SCIAMACHY spectrum.
SCIAMACHY MERIS Center Band SCIAMACHY Remarks band channel wavelength width integration
µm µm range, µm 3 1 0.4125 10 0.424–0.428 incomparable λ 3 2 0.4425 10 0.435–0.445 used 3 3 0.4900 10 0.485–0.495 used 3 4 0.5100 10 0.505–0.515 used 3 5 0.5600 10 0.550–0.560 used 4 6 0.6200 10 – 4 7 0.6650 10 0.660–0.670 used 4 8 0.6813 7.5 – 4 9 0.7088 10 – 4 10 0.7538 7.5 0.754–0.758 used without 4 11 0.7606 3.8 – O2A-Band 4 12 0.7783 15 0.772–0.776 used without O2A-Band 5 13 0.8650 20 0.868–0.875 used, avoid disturbances
5 14 0.8850 10 –
5 15 0.9000 10 – H2O vapor
1)
in this particular case MERIS reflectance of channel 12 is compared with the SCIAMACHY range 0.754–758 µm.
ACPD
6, 673–699, 2006 SCIAMACHY aerosol remote sensing W. von Hoyningen-Huene et al. Title Page Abstract Introduction Conclusions References Tables Figures J I J I Back Close Full Screen / EscPrint Version Interactive Discussion
EGU
Table 2. Derived average correction factors for the SCIAMACHY TOA reflectance for band 3, 4
and 5.
SCIAMACHY Correction Offset Correlation factor coefficient
C1 C0
band 3 1.0991 +0.000009 0.9982 band 4 1.1215 −0.000013 0.9955 band 5 1.2109 +0.000140 0.9613
ACPD
6, 673–699, 2006 SCIAMACHY aerosol remote sensing W. von Hoyningen-Huene et al. Title Page Abstract Introduction Conclusions References Tables Figures J I J I Back Close Full Screen / EscPrint Version Interactive Discussion
EGU
Table 3. Polynomial coefficients for the determination of the total transmissions and
hemi-spheric reflectance
Rayleigh Aerosol ρHem b1 −0.44408 +0.01176
b2 +4.49481 +1.01682 a1 +0.33185 b3 −9.71368 −2.32949 a2 −0.19653
b4 +9.49795 +2.11831 a3 +0.08935 b5 −3.42016 −0.71737 a4 −0.01675
ACPD
6, 673–699, 2006 SCIAMACHY aerosol remote sensing W. von Hoyningen-Huene et al. Title Page Abstract Introduction Conclusions References Tables Figures J I J I Back Close Full Screen / EscPrint Version Interactive Discussion EGU 0 200 400 600 800 1000 0 0 0 0 0 0 0 Pixel 0.0 0.2 0.4 0.6 0.8 1.0 MERIS Rho_TOA (0.865 µm) 0.0 2.5 5.0 7.5 10.0 12.5 15.0 27.5 30.0 32.5 35.0 37.5 Pixel Scan Lines 0.0 0.2 0.4 0.6 0.8 SCIAMACHY Rho_TOA (0.865 µm) S t. P e tersb u rg S to ck ho lm T ora ve re G otlan d M ins k H e lsin ki
Fig. 1. Coinciding MERIS (left) and SCIAMACHY (right) scenes of the 3 August 2002, used for
the comparisons. The scenes present the TOA reflectance for the spectral band 0.865 µm. The SCIAMACHY scene and the selected pixels over water of the Baltic Sea without any cloud dis-turbance are marked by rectangles. The center of the SCIAMACHY scene is located at 58.85◦N and 22.03◦E. The AERONET sites Gotland, Minsk and Toravere are marked as triangles.
ACPD
6, 673–699, 2006 SCIAMACHY aerosol remote sensing W. von Hoyningen-Huene et al. Title Page Abstract Introduction Conclusions References Tables Figures J I J I Back Close Full Screen / EscPrint Version Interactive Discussion EGU 0.40 0.60 0.80 1.00 Wavelength / µm / 0.00 0.01 0.10 1.00 TO A r e fl e c ta nc e MERIS 3 4 5 SCIAMACHY 1 2 3 4 5 6 7 8 9 10 12 13 14 1511 SCIA 20020811 10:26:01 Orbit 2238
Fig. 2. Example of a SCIAMACHY TOA-reflectance spectrum for the bands 3, 4 and 5 and the position of the comparable MERIS channels. The MERIS channels used within the BAER approach are indicate in grey. The available channels of MERIS are indicated in white. The integration regions for the comparisons are shown in red.
ACPD
6, 673–699, 2006 SCIAMACHY aerosol remote sensing W. von Hoyningen-Huene et al. Title Page Abstract Introduction Conclusions References Tables Figures J I J I Back Close Full Screen / EscPrint Version Interactive Discussion EGU 0.40 0.60 0.80 1.00 Wavelength / µm / 0.00 0.01 0.10 TO A Re fe lc ta n c e SCIAMACHY 20020803
Fig. 3. Examples of SCIAMACHY spectra of the TOA-reflectance for the selected cloud free
ACPD
6, 673–699, 2006 SCIAMACHY aerosol remote sensing W. von Hoyningen-Huene et al. Title Page Abstract Introduction Conclusions References Tables Figures J I J I Back Close Full Screen / EscPrint Version Interactive Discussion
EGU
0.00 0.04 0.08 0.12 0.16
MERIS TOA Reflectance 0.00 0.04 0.08 0.12 SC IA MAC H Y TOA R e fl ect ance SCIAMACHY - MERIS Band 3, Band 4, Band 5
Band 3: Rho_MERIS / Rho_SCIA = 1.1023 Band 4: Rho_MERIS / Rho_SCIA = 1.0536 Band 5: Rho_MERIS / Rho_SCIA = 1.2066
Fig. 4. Comparison of TOA reflectance of SCIAMACHY band 3 and band 4 with the MERIS
channels 2, 3, 4, 5, 7, 12. The error bars give the standard deviation of the TOA reflectance of the MERIS pixels within one SCIAMACHY pixel.
ACPD
6, 673–699, 2006 SCIAMACHY aerosol remote sensing W. von Hoyningen-Huene et al. Title Page Abstract Introduction Conclusions References Tables Figures J I J I Back Close Full Screen / EscPrint Version Interactive Discussion EGU 400.00 600.00 800.00 1000.00 Wavelength / nm / 0.90 1.00 1.10 1.20 1.30 C o rr e c ti o n F a c to r Coorection Factors
SCIAMACHY Preliminary Recalibration
SCIAv3.51 - MERIS (linear fit for the SCIA band) SCIAv3.51 - MERIS (Ratio)
SCIA - AATSR (RAL)
SCIAv4.02b - MERIS (linear fit) SCIAv4.02b - MERIS
Fig. 5. Spectral behavior of the correction factors within the range of SCIAMACHY band 3,
4 and 5. For comparison of correction factors from different approaches the preliminary re-calibration of SCIAMACHY and a comparison with AATSR reflectance is combined.
ACPD
6, 673–699, 2006 SCIAMACHY aerosol remote sensing W. von Hoyningen-Huene et al. Title Page Abstract Introduction Conclusions References Tables Figures J I J I Back Close Full Screen / EscPrint Version Interactive Discussion EGU 0.00 0.20 0.40 0.60 0.80 1.00 AERONET, AOT(0.440 µm) 0.00 0.20 0.40 0.60 0.80 1.00 M E R IS , A O T (0 .4 4 3 µ m ) Minsk Toravere Gotland MERIS SCIAMACHY
Fig. 6. Comparison of AOT for 0.443 µm channel, retrieved from MERIS (black dots) and
SCIAMACHY (red triangles) with ground based measurements by the AERONET instruments in Gotland, Toravere and Minsk.
ACPD
6, 673–699, 2006 SCIAMACHY aerosol remote sensing W. von Hoyningen-Huene et al. Title Page Abstract Introduction Conclusions References Tables Figures J I J I Back Close Full Screen / EscPrint Version Interactive Discussion EGU 0 200 400 600 800 1000 0 250 500 750 1000 1250 1500 Pixel Scan Line 0.0 0.2 0.4 0.6 0.8 1.0 AOT(443 nm) 0 4 8 12 13 18 23 Pixel Scan Line 0.0 4.0 8.0 12.0 26 31 36 Pixel Scan Line 0 4 8 12 40 45 50 Pixel Scan Line M E R IS S C IA M A C H Y
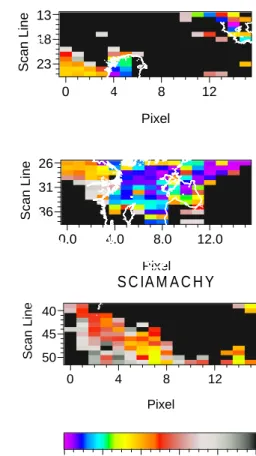
Fig. 7. The aerosol optical thickness for 0.443 µm channel, retrieved from MERIS (left) and
SCIAMACHY (right). The color scale is the same for both cases. AOT>1 (disturbed by clouds) is coded in black.
ACPD
6, 673–699, 2006 SCIAMACHY aerosol remote sensing W. von Hoyningen-Huene et al. Title Page Abstract Introduction Conclusions References Tables Figures J I J I Back Close Full Screen / EscPrint Version Interactive Discussion EGU 0.00 0.20 0.40 0.60 MERIS AOT(0.443 µm) 0.00 0.20 0.40 0.60 S C IA M A C H Y A O T (0 .4 4 3 µ m )
Fig. 8. The aerosol optical thickness for 0.443 µm channel, retrieved from MERIS and