HAL Id: hal-01678378
https://hal.archives-ouvertes.fr/hal-01678378
Submitted on 9 May 2018
HAL is a multi-disciplinary open access
archive for the deposit and dissemination of
sci-entific research documents, whether they are
pub-lished or not. The documents may come from
teaching and research institutions in France or
abroad, or from public or private research centers.
L’archive ouverte pluridisciplinaire HAL, est
destinée au dépôt et à la diffusion de documents
scientifiques de niveau recherche, publiés ou non,
émanant des établissements d’enseignement et de
recherche français ou étrangers, des laboratoires
publics ou privés.
of angular momentum on the radial density profiles of
disc galaxies
N. Peschken, E. Athanassoula, S. A. Rodionov
To cite this version:
N. Peschken, E. Athanassoula, S. A. Rodionov. Forming disc galaxies in major mergers - III. The
effect of angular momentum on the radial density profiles of disc galaxies. Monthly Notices of the
Royal Astronomical Society, Oxford University Press (OUP): Policy P - Oxford Open Option A, 2017,
468 (1), pp.994-1004. �10.1093/mnras/stx481�. �hal-01678378�
Forming disc galaxies in major mergers: III. The effect of
angular momentum on the radial density profiles of disc
galaxies
N. Peschken
1,2?, E. Athanassoula
1, S. A. Rodionov
11Laboratoire d’Astrophysique de Marseille, 38, rue Fr´ed´eric Joliot-Curie 13388 Marseille cedex 13 FRANCE 2Nicolaus Copernicus Astronomical Center, Polish Academy of Sciences, ul. Bartycka 18, 00-716 Warsaw, Poland
6 March 2017
ABSTRACT
We study the effect of angular momentum on the surface density profiles of disc galax-ies, using high resolution simulations of major mergers whose remnants have down-bending radial density profiles (type II). As described in the previous papers of this series, in this scenario, most of the disc mass is acquired after the collision via ac-cretion from a hot gaseous halo. We find that the inner and outer disc scalelengths, as well as the break radius, correlate with the total angular momentum of the initial merging system, and are larger for high angular momentum systems. We follow the angular momentum redistribution in our simulated galaxies, and find that, like the mass, the disc angular momentum is acquired via accretion, i.e. to the detriment of the gaseous halo. Furthermore, high angular momentum systems give more angular momentum to their discs, which affects directly their radial density profile. Adding simulations of isolated galaxies to our sample, we find that the correlations are valid also for disc galaxies evolved in isolation. We show that the outer part of the disc at the end of the simulation is populated mainly by inside-out stellar migration, and that in galaxies with higher angular momentum, stars travel radially further out. This, however, does not mean that outer disc stars (in type II discs) were mostly born in the inner disc. Indeed, generally the break radius increases over time, and not taking this into account leads to overestimating the number of stars born in the inner disc. Key words: galaxies: spiral – galaxies: structure – galaxies: kinematics and dynamics
1 INTRODUCTION
The early pioneering work ofFreeman(1970) showed clearly
that the radial surface density profile of disc galaxies is well
fitted by an exponential. Later work (Van der Kruit 1979,
and later e.g.Pohlen et al. 2002;Erwin, Beckman & Pohlen
2005;Guti´errez et al. 2011) revealed the presence of a break in the profile of most galactic discs, as well as the fact that both the inner and the outer parts are well described by exponentials.
The break can be of two kinds, depending on the scale-lengths of the two exponentials. If the slope of the outer part of the disc, hereafter called outer disc, is steeper than the slope of the inner part (inner disc), i.e. if the inner disc scale-length is greater than the outer disc one, the profile is called
downbending, or type II (Pohlen & Trujillo 2006). This is the
most common profile for disc galaxies (e.g.Pohlen &
Tru-jillo 2006;Azzollini, Trujillo & Beckman 2008;Laine et al.
? Contact e-mail:[email protected]
2014). In the opposite case, the outer disc is shallower than
the inner disc, and the profile is called upbending, or type III. The single exponential case, where no break is observed, is called type I.
Several mechanisms producing those different types of discs have been proposed so far. While it has been argued that a single exponential is the canonical profile for a disc (Gunn 1982;Lin & Pringle 1987;Yoshii & Sommer-Larsen 1989; Ferguson & Clarke 2001; Elmegreen & Struck 2013,
2016; Herpich, Tremaine & Rix 2016;Struck & Elmegreen
2017), many formation scenarii have been proposed for
the downbending discs, sometimes related to each other. They are thought to be created by bars via the Outer
Lindblad Resonance (Debattista et al. 2006; Pohlen &
Trujillo 2006;Mu˜noz-Mateos et al. 2013;Kim et al. 2014),
by star formation thresholds (Schaye 2004; Pohlen &
Trujillo 2006; Elmegreen & Hunter 2006), or connected with morphological components such as rings or spirals (Laine et al. 2014). Stellar migration is also found to be important in the creation of type II profiles, being able to
redistribute stars from the inner disc to the outer disc, and
can be coupled with a star formation threshold (Roˇskar et
al. 2008). On the other hand, type III profiles (upbending discs) remain poorly understood. They are sometimes associated with a spheroidal component such as a stellar halo, or with the superposition of a thin and a thick disc, and could be the result of minor mergers, or be linked to a
strong bar (Erwin et al. 2005;Younger et al. 2007;Bakos &
Trujillo 2012;Comer´on et al. 2012;Herpich et al. 2015b). Although the majority of the present-day spirals is thought to have experienced at least one major merger in their
his-tory (e.g.Hammer et al. 2009), so far most of the simulated
galaxies used to investigate the formation of these different disc types have been evolved in isolation. Recently, however,
we presented in Athanassoula et al.(2016, hereafter A16)
three fiducial examples from a large sample of high resolu-tion simularesolu-tions of a major merger between two disc galaxies with a hot gaseous halo each, and showed that the remnants are good models of spirals. In this paper, we aim to study the role of angular momentum in shaping type II profiles, obtained from our large sample of major merger simulations. The outline is as follows. In section 2, we briefly sum-marise the necessary parts of A16, and describe the fitting procedure for the radial density profiles. We compute the initial angular momentum and link it to the scalelengths in section 3. In section 4, we follow the angular momentum re-distribution to explain how the initial angular momentum can affect the final disc properties. We discuss our results in section 5, and conclude in section 6.
2 TECHNICAL ASPECTS
2.1 Description of the simulations
In this section, we will briefly summarise the simulations characteristics, which have been obtained and described in some detail in A16. Our simulations start from two spheri-cal protogalaxies consisting only of dark matter (DM) and hot gas, which we set on a given orbit. We use a total of 5.5 million particles (2 million for the baryons, 3.5 million for the DM), with softenings of 25 pc for the gas and 50 pc for
the DM. Each particle’s mass is 5×10⁴ M for the gas and
stars, and 2×10⁵M
for the dark matter. By the time of the
merging, a disc has formed in each of the progenitors, which is destroyed by the merging, its stars ending up mainly in a classical bulge. Gas continues to fall from the halo, and new discs, both thin and thick, are gradually formed in the remnant. Well-defined spiral arms soon develop in the thin disc, as well as a bar and a boxy/peanut bulge. Each simu-lation ends after 10 Gyr evolution, showing a remnant with a classical bulge-to-total ratio which is consistent with that of real spiral galaxies.
Our simulations are made using the N-body/SPH code GADGET3, including gas and its physics. The description
of this code can be found inSpringel & Hernquist(2002) and
Springel (2005). Stars and dark matter are modeled by N-body particles, and gas by SPH particles, with fully adaptive smoothing lengths. Gravity is computed with a hierarchy tree algorithm, and the code uses subgrid physics for the
feedback, star formation and cooling, described in Springel
& Hernquist(2003).
For a description of the technical aspects of the
sim-ulations we refer the reader toRodionov, Athanassoula &
Peschken(2017, hereafter R17). To avoid an excessive cen-tral concentration in our simulated galaxies, which would lead to unrealistic circular velocity curves and would delay the formation of the bar, we added AGN feedback (R17).
This is based on a density threshold ρAGN and a
tempera-ture TAGN, while the physics underlying it is described in
detail in A16.
The simulations have a variety of different orbits for the two merging protogalaxies. These orbits are characterised by their ellipticity, and the initial distance between the two progenitors. Each orbit leads to a different merging time, which is difficult to define precisely, but can be approximated by deriving the time beyond which the distance between the two centers of density stays below 1 kpc (see A16).
The two protogalactic haloes start with an initial spin, characterised by a spin value f representing the fraction of particles rotating with a positive sense of rotation. Thus for f = 1, all the particles rotate in the direct sense, while for f = 0.5 there is no net rotation.
The simulations used in this paper have rather early merg-ing times, i.e. between 1.2 and 2.2 Gyr after the start of the simulation. About two thirds of our simulations have spin axes perpendicular to the orbital plane, but for the other simulations we tilt one or both protogalaxies by a chosen angle, to see the effect of the spin axis orientation. In most simulations the spin value f is the same for both protogalax-ies, but in some simulations we introduced a different spin in each protogalaxy. We ran simulations of mergers with mass ratios between the two protogalaxies of 1, 1/2, 1/3, 1/4 and 1/8.
A central AGN is present in the remnant galaxy of the majority of our simulations, as described in A16 and R17, but we include 21 simulations without AGN to cover a larger part of the available parameter space. Nevertheless, the pres-ence of our AGN affects mainly the central part of the disc (R17), and thus should not have an impact on the analysis presented in this paper.
We will first consider a subsample of 132 simulations which all have the same total mass, i.e. the same number of particles (5.5 million), and call it sample A. We also ran 67 simulations with various masses, each different from the mass of the simulations in sample A. This is done by keeping the same mass for single particles, but changing the num-ber of particles. We add this group of 67 simulations (called sample B) to sample A to obtain a new sample of 199 sim-ulations, sample A+B, which we will use in the discussion
(section5.2).
2.2 Fitting the radial density profiles
To derive the stellar radial density profile, we use
axisym-metric concentric cylindrical annuli, and choose zlim=1 kpc
as maximum height to keep only the thin disc profile. As shown in A16, the disc at the end of our three fiducial sim-ulations is composed of an inner and a downbending outer disc (type II), separated by a break. This is also the case for the 199 simulations of the sample used in this paper (sample A+B), therefore we fit the disc part of our profiles with two exponential functions. We use a “piecewise” fit, which means
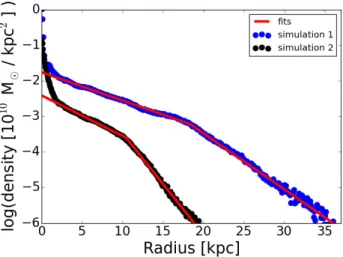
Figure 1. Projected surface stellar density radial profiles for two simulations, together with the corresponding fits for the disc part. For clarity, the second simulation (in black) has been shifted down by 1 logarithmic unit. Simulation 1 has a higher initial spin pa-rameter λ than simulation 2.
that we fit the inner and the outer disc separately with an exponential: Σin(R) = Σi exp( −R hi ), R < Rbreak (1) Σout(R) = Σo exp( −R ho ), R > Rbreak (2)
where Σi, Σo are normalization factors, hi and ho are the
inner and outer disc scalelengths, and Rbreakthe break
ra-dius. The latter is derived by taking the intersection between the inner and the outer disc fits. The interval to fit for each part of the disc is selected manually, and we exclude, after visual inspection, every simulation for which the fit is not
reliable. Two examples of fits are shown in Fig.1. Another
way to make this fit would be to use a double exponential function (or “broken-exponential”) for the whole disc, which has been shown to give very similar results (differences in the scalelengths < 5 per cent, Erwin et al. 2008). We chose the present approach because of its simplicity.
The scalelengths and the break radius change with
time, as shown both by observations (Perez 2004; Azzolini
et al. 2008), and simulations (Roˇskar et al. 2008;
Athanas-soula, Peschken & Rodionov, in prep, hereafter Paper IV), and to be able to compare consistently the scalelengths derived for the different simulations, we need to compare all galaxies at the same evolutionary time, i.e. at the same time after the merging. We thus take a fixed evolution time of 7.8 Gyr after the merging for every simulation. Given that the merging times have values between 1.2 and 2.2 Gyr, the times at which we now study the disc are therefore between 9 and 10 Gyr, depending on the sim-ulation. We will hereafter refer to this time as the final state. We here aim to investigate the role of angular momentum in the formation of the new disc formed after the merging, in the secular evolution period of the galaxy. Nevertheless, some of the stars formed before or during the merging were
spread all over the galaxy by the merging, and can pollute our density profiles. These stars represent between 10 and 30 per cent of the total stellar mass in the thin disc. Most of them are located in the bulge region (about 65 per cent), but they can also form a stellar halo or a thick disc, which will add particles to the thin disc, changing the value of the scalelengths by up to 20 per cent. These stars are not related to the disc formation and its dependance on the angular momentum, and we thus chose to remove them, selecting only the stars formed after the merging to derive our density profiles and the corresponding scalelengths.
3 THE ROLE OF ANGULAR MOMENTUM
3.1 Definition of the global, dimensionless spin
parameter
Here, we use the dimensionless spin parameter λ (Peebles
1969):
λ = L|E|
1/2
GM5/2, (3)
where L, E and M are respectively the total angular mo-mentum, energy and mass of the system including its dark matter, gas and stars, computed with respect to the center of mass of the system, and G is the gravitational constant. The total energy is computed adding the kinetic energy, the gravitational potential energy and the gas internal energy. The total angular momentum L is a conserved quantity, but the total energy varies with time because of processes such as the cooling of the gas and the stellar feedback. We therefore have to specify the time at which we will calculate λ, and make sure it is calculated consistently for all simulations. To avoid the technical difficulties inherent in using the merging time, we use t=1 Gyr before the merging, which we call the initial state.
3.2 Angular momentum and scalelengths
How does the disc structure relate to the global spin param-eter λ? From the definition of angular momentum, we expect that for two galaxies of the same total mass, the galaxy with the highest angular momentum will be more extended, as it
has been shown in previous studies (e.g.Dalcanton, Spergel
& Summers 1997 and Kim & Lee 2013). We checked this result in our simulations by plotting the size of our galactic discs at the final state as a function of λ, for the simulations of sample A. As an estimate of the disc size, we take R95, the cylindrical radius containing 95 per cent of the total stellar
mass. We can see on Fig.2that the size of the final galaxy
increases linearly with λ, with a high correlation coefficient. We thus find the disc to be globally larger for high λ galaxies, as expected. However, since the disc is constituted of an inner and an outer part, which part of the disc is affected most? We expect at least one of the two discs (inner or outer) to be larger at higher λ. To have a first insight of the effect of the spin parameter λ on the parameters of the
radial density profiles, we plot in Fig.1 the profiles at the
final state (as defined in section 2.2) for two simulations
of sample A with different λ values. We can see that the scalelengths of the simulation with a higher λ (in blue) are
Figure 2. Cylindrical radius containing 95 per cent of the stellar mass at the final state, as a function of the spin parameter λ computed at the initial state, for the simulations of sample A. The corresponding linear fit is plotted in black, with the equation and correlation coefficient given in the top left corner.
larger, and its break is located further out. The next step is to see whether this preliminary result is valid for all the simulations in sample A, as described below.
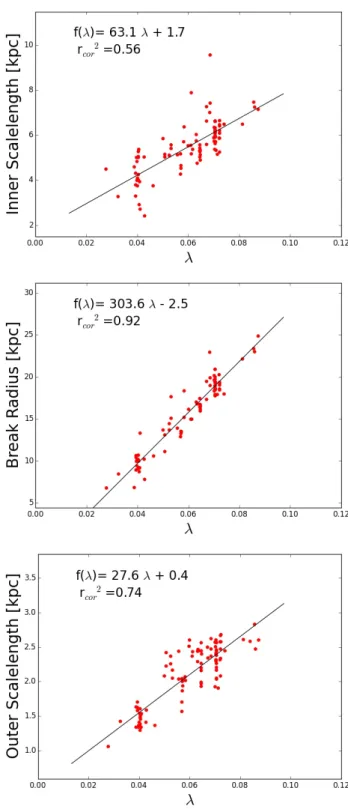
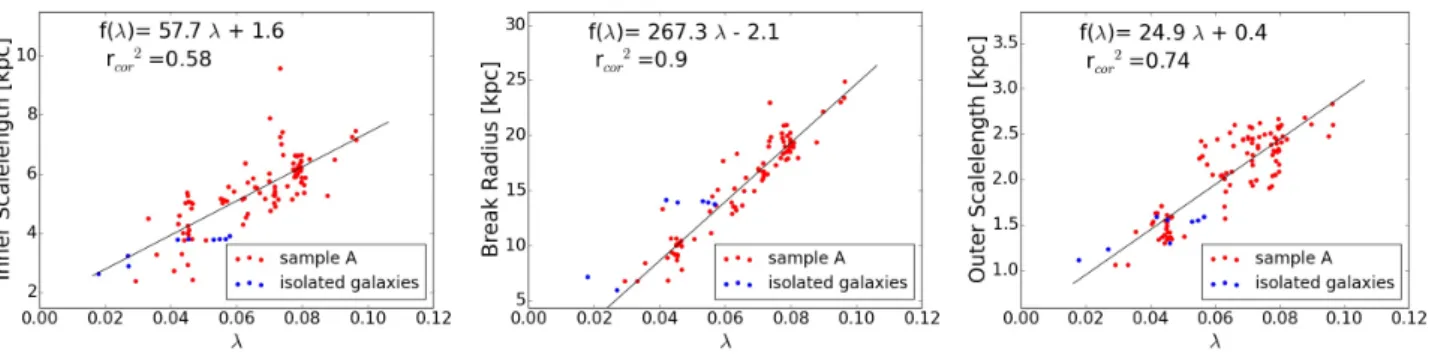
We examine the discs of the remnants at the final state, and plot the three parameters derived from the fits of the ra-dial density profiles (inner, outer disc scalelength and break radius) as a function of the initial λ for each simulation in
sample A (Fig.3). As described in section2.2, we excluded
all the simulations for which there was some uncertainty in the fit of the corresponding parameter, which explains why the number of points is different for each plot. We thus have a total of 97 values for the inner disc scalelength (hereafter inner scalelength), 99 for the outer disc scalelength (outer scalelength) and 84 for the break radius (for which the fits of both the inner and the outer disc have to be reliable).
We see that the inner scalelength, the outer scalelength and the break radius all increase linearly with λ, so that larger angular momentum systems produce discs with larger inner, outer scalelengths and break radii. This confirms the
results of Herpich et al. (2015a) for the inner scalelength
and the break radius for cases with isolated galaxies with
no mergers (see discussion in section 5.1), and adds a
fur-ther argument showing that the remnant of a major merger possesses all the characteristics of a disc galaxy.
The correlations of the fits in Fig.3are tight, especially
for the break radius. The scalelengths show a larger spread, presumably because their values can be more strongly influenced by the presence of morphological components such as bars, spirals or rings than the break radius. It is important to note that all the simulations we have so far considered (sample A) have identical total masses (gas + stars + DM) and similar total stellar masses at their final state, so that the spread of scalelengths cannot be simply due to a mass dependence. Thus the spread should be due to the different parameters of the initial conditions in the various simulations, such as the halo spin value, and, in particular, to the different orbits of the two progenitors.
Figure 3. From top to bottom we plot respectively the inner scalelengths, the break radii and the outer scalelengths derived from the fits at the final state, each as a function of the spin pa-rameter λ taken at the initial state, for the simulations in sample A. The corresponding linear fits are plotted in black, with the equation and correlation coefficient given in the top left corner of each plot.
Figure 4. Correlations of the inner scalelength, the break radius and the outer scalelength, with the total baryonic angular momentum of the final disc, for sample A.
4 UNDERSTANDING OUR CORRELATIONS
The dimensionless spin parameter λ is computed 1 Gyr be-fore the merging, and is dominated by the halo (hot gas and DM), because the discs of the protogalaxies are of short ex-tent and of low mass, as the merging occurs early in our sample of simulations. Therefore, λ does not seem to be di-rectly related to the final disc of the remnant and to its properties such as the scalelengths. To understand how it can yet influence the final disc, we will first look at the an-gular momentum in the final disc.
4.1 Angular momentum in the baryonic disc
We define the baryonic disc as the 2 kpc thick pill-box
(|z| < 1 kpc, consistently with section 2.2) of maximum
radius Rmax = 1.5 Rbreak, and exclude the inner 3 kpc to
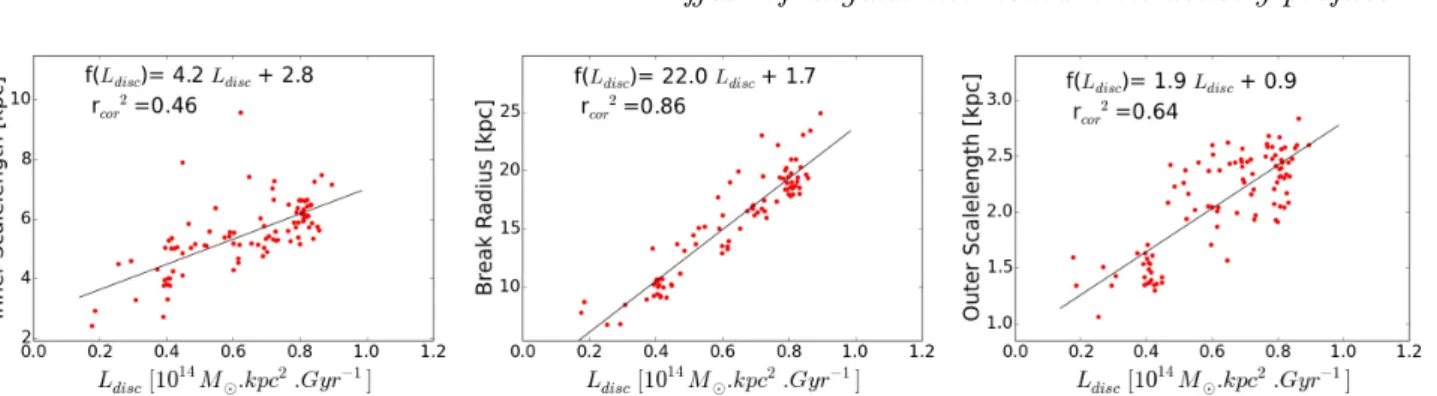
remove the bulge part. We then compute the total angular momentum of the baryonic matter (gaseous + stellar parti-cles) in this volume at the final state, and plot it against the scalelengths and the break radius for all the simulations of
sample A in Fig.4. We find clear correlations, showing that
the properties of the disc are directly linked to its angular momentum.
We now need to relate this disc angular momentum to the initial halo-dominated spin parameter λ. We showed in A16 that the gas from the gaseous halo accretes onto the disc and thus rebuilds it after the merger, by fuelling star formation in the disc throughout the whole simulation. We suggest here that gas accretion from the halo is the main mechanism gradually transferring angular momentum from the gaseous halo to the disc, and investigate this in the fol-lowing subsections.
4.2 Angular momentum redistribution
To be able to study the exchanges of angular momentum between the disc and the gaseous halo, we first made sure that the angular momentum exchanges between the baryonic and the dark matter haloes are relatively small and thus can be neglected in the context of our very simple qualitative explanation. Indeed, we found such exchanges to be of the order of few per cent.
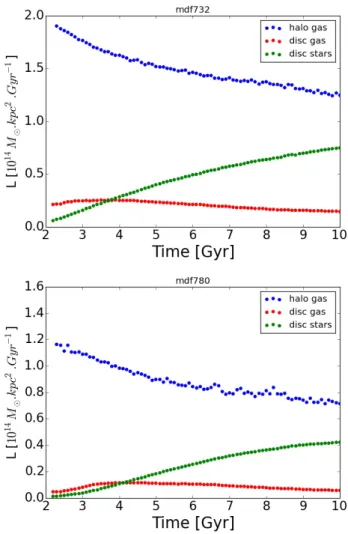
To illustrate the angular momentum exchanges in our sim-ulations, we will focus on two fiducial simulations of sample A, mdf 732 and mdf 780, presented in A16, which have quite
different λ values, mdf 732 having a considerably higher λ than mdf 780. Note, however, that we made the same analy-sis with other simulations as well, and found similar results.
We define the disc as in section4.1, and the halo as
every-thing else. The baryonic halo is mainly constituted of gas, but a few stars are expected to be found as well. Neverthe-less, we find the total angular momentum L of these stars to be a thousand times lower than the halo gas, and we thus neglect them.
We first plot in Fig. 5 the evolution over time of the
total mass of the halo gas, the disc gas and the stars in the disc, separately. As expected (A16), the gaseous halo looses
mass while the stellar disc gains it. In Fig.6we further plot
the angular momentum as a function of time for these three components, and we can see that the halo gas is gradually loosing angular momentum over time, while the angular mo-mentum of the stellar disc is increasing. The gas in the disc is loosing mass and angular momentum due to star formation in the disc. These plot thus show how the gas in the halo is accreted onto the disc, where it forms stars (see A16). Therefore, the stellar disc is gaining angular momentum by gas accretion and star formation.
Note that this simple angular momentum redistribution picture implicitly assumes that our system is relatively isolated. Otherwise, it will be able to exchange matter and/or angular momentum with other galaxies, so that the total mass and angular momentum of our system need not be conserved quantities.
Thus, the disc grows from material taken from the gaseous halo, which directly gives a fraction of its angular momen-tum to the disc. To find how this fraction varies for different
simulations, we plot (Fig.7) the final baryonic disc
angu-lar momentum (as defined in section4.1) versus the initial
total baryonic angular momentum of the system (which in practice we calculate at the merging time). We find a clear correlation, which shows that gaseous haloes with more an-gular momentum create on average discs with more anan-gular momentum.
To conclude, the initial properties of the halo – and in particular its angular momentum – affect the final disc structure via gas accretion, which constitutes a plausible reason for the disc properties (scalelengths and break radius) to be linked to the initial spin parameter λ.
Figure 5. Total mass of the gaseous halo, the gaseous disc and the stellar disc as a function of time for two simulations, mdf732 (high λ, upper pannel) and mdf780 (low λ, lower pannel).
5 DISCUSSION
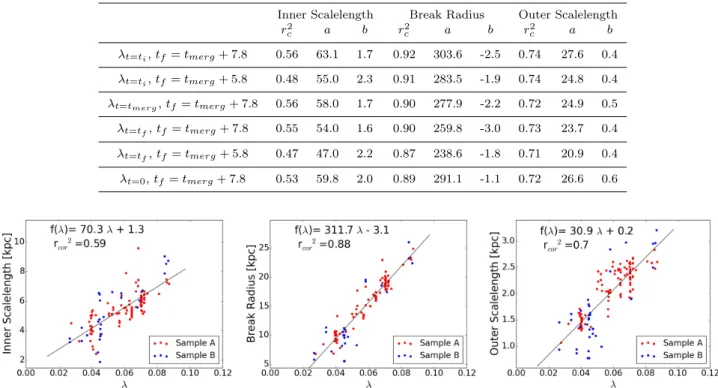
5.1 Robustness of the correlations
To test the robustness of our results with respect to the time defined as final state, we fitted the radial density profiles also 5.8 Gyr after the merging, instead of 7.8 Gyr. The values of
the correlation coefficients are reported in Table1(2nd row).
As expected due to the growth of the disc, the individual values of the scalelengths and the break radii are different, but we still find increasing linear trends with λ. Therefore, the time chosen as final state does not seem to be important for this study, provided it is consistent for all simulations and provided it is sufficiently long after the merging for the disc to have settled. Under these conditions, the increasing trend with λ should be valid regardless of the disc evolution time. We can thus keep 7.8 Gyr after the merging as the final state without being concerned about the effect of our choice.
We also changed the time at which we calculate λ (the initial state) and used the merging time. We found very little difference in the results, and the correlation coefficients are
similar (Table 1, 3rd row). We repeated this analysis,
cal-culating λ at various times covering the range between the
Figure 6. Total angular momentum of the gaseous halo, the gaseous disc and the stellar disc as a function of time for two simulations, mdf732 (high λ, upper pannel) and mdf780 (low λ, low pannel).
Figure 7. Final baryonic disc angular momentum, as a function of the total baryonic angular momentum of the system computed at the merging time, for simulations in sample A.
Figure 8. Same plots as in Fig.3, but adding simulations of isolated galaxies (in blue).
Figure 9. Same plots as in Fig. 3, but showing the effect of spin orientation on our correlations, with the angle between the two protogalaxies axes.
start of the simulation and the merging, and conclude that the time chosen does not change the results significantly. We can also use λ at the final state instead of the initial state, to link λ and the disc structure both taken at the same time. We found again the same increasing trends, with the
correlation coefficients reported in Table 1(4th row). This
points out the existence of a correlation between the initial and final λ, which we confirmed by plotting one against the other, and argues that for an analysis of this type, one can take the value of angular momentum at any time, as long as it is consistent for all simulations.
We also used λ at t=0 Gyr for all simulations (sample A), and again find correlations for the scalelengths and the break radius, although the correlation coefficients are
slightly lower (Table1, last row).
To see if the results obtained for our merger simulations are also valid for isolated galaxies, we included 12 simulations which take only one of the protogalaxies used in the merger simulations, and see how it evolves in isolation. This protogalaxy contains the same number of particles as the simulations of sample A, to keep the same total mass. To be able to compare the merger to the isolated simulations, we define the initial state as the start of the new disc formation for both, i.e. at the end of the merging for the former, and at t=0 for the latter. We take 7 Gyr after the initial state as the final state. We find that the isolated galaxies fit
well with the merger simulations (see Fig.8), which argues
that the increasing linear trends of the two scalelengths and the break radius with the angular momentum seem to be the same if the disc is formed in isolation or from a major merger. Our results should therefore also be valid for
isolated galaxies.
Herpich et al.(2015a) did a similar analysis to ours, looking at the dependence of the scalelengths and the break radii with the angular momentum, but using a sample of 9 simulations of galaxies evolved in isolation. They computed the spin parameter λ of the halo at the start of the simulation, and also found that the inner scalelength and the break radius increase with λ. However, they observed a decreasing trend of the outer scalelength with λ, while we have an increasing one. We explain this difference by the fact that they included upbending discs in their analysis, whose outer scalelengths are naturally much higher than for downbending discs, while we only have downbending discs in our sample. Upbending profiles will be discussed in detail in a future paper (Paper IV). As a consequence,
Herpich et al.(2015a) find an increasing trend with λ for the ratio of the inner scalelength to the outer scalelength, while we do not, our values showing no correlation with λ.
We mentioned in section2.1that in some simulations, the
spin axis of one or both protogalaxies is tilted by a given an-gle; this concerns 34 simulations in sample A. This angle can be around the X or the Y axis, Z being the axis perpendicu-lar to the orbital plane. We wanted to see if these simulations behave differently in our results than the simulations where both protogalactic spin axes are parallel, and perpendicular
to the orbital plane. In Fig.9we plotted again our
correla-tions between the scalelengths and λ, but showing the effect of spin orientation. We can see that the simulations where the spin axes are not parallel (angle 6= 0) fit reasonably well
Table 1. Parameters of the linear fits for different plots of λ versus the inner scalelength, break radius and outer scalelength. ti, tf and
tmergare respectively the times of the initial state, the final state and the merging, and r2cis the correlation coefficient for the linear fit
with equation: f (λ) = aλ + b.
Inner Scalelength Break Radius Outer Scalelength r2 c a b r2c a b r2c a b λt=ti, tf= tmerg+ 7.8 0.56 63.1 1.7 0.92 303.6 -2.5 0.74 27.6 0.4 λt=ti, tf= tmerg+ 5.8 0.48 55.0 2.3 0.91 283.5 -1.9 0.74 24.8 0.4 λt=tmerg, tf = tmerg+ 7.8 0.56 58.0 1.7 0.90 277.9 -2.2 0.72 24.9 0.5 λt=tf, tf= tmerg+ 7.8 0.55 54.0 1.6 0.90 259.8 -3.0 0.73 23.7 0.4 λt=tf, tf= tmerg+ 5.8 0.47 47.0 2.2 0.87 238.6 -1.8 0.71 20.9 0.4 λt=0, tf = tmerg+ 7.8 0.53 59.8 2.0 0.89 291.1 -1.1 0.72 26.6 0.6
Figure 10. Same plots as in Fig.3, but adding a sample of 67 simulations (sample B) with total masses different from those of the simulations in sample A.
with the others. We can thus conclude that our results seem to be valid regardless of the spin axis orientation.
We also looked at the effect of the presence of a central AGN on our correlations, and found that the simulations without AGN also fit well with the ones having an AGN. This confirms that our AGN only affects the central part of the galaxy (R17).
The effect of the initial density distribution of gas and DM have also been tested since our sample contains simu-lations with different distribution parameters, such as the initial characteristic radii of the halo (see A16) or the pres-ence of a central core for DM. Although the corresponding parameter space is very large, our relatively few trials ar-gue that such parameters do not seem to have an effect on the correlations we found. Various other parameters, such as the merging orbit, the baryonic to total mass ratio, and the softening of the gas and DM, were also shown to have no significant impact on our results.
5.2 Introducing simulations with different total
masses
Here we will analyse the effect of changing the total mass
in the simulations, using sample B (see section 2.1). The
problem when analysing simulations of different masses is that the evolution time-scale is also different. In our analysis we took a fixed evolution time after the merging (7.8 Gyr) to compare the properties of the disc, which introduces a small
inconsistency when we compare simulations with different total masses.
Nevertheless, we expect the time-scales to be similar if the total masses are not too different, which is the case of the simulations in our subsample of 67 galaxies (sample B) since they have total masses between 0.5 and 2 times the total mass of simulations in sample A. We include them in
our correlations (Fig. 10) and find again high correlation
coefficients; the sample B fits well with sample A. Further-more, we added simulations of galaxies evolved in isolation
as in section5.1, but with half the number of particles, i.e.
with a mass twice lower than the simulations of sample A. We found that these simulations match well in the correla-tions, which again suggests that our results are valid also for galaxies formed in isolation. Moreover, we included the sim-ulations of sample B in the correlation of the final baryonic disc angular momentum as a function of the initial baryonic
angular momentum (as in Fig.7), and found again a very
good match.
Since the simulations of sample B follow similar trends as sample A despite their total masses being different, in the following subsections we will include them in our analysis, using the A+B sample.
5.3 Migration and angular momentum
The formation of outer discs in downbending profile galaxies is still debated, but one of the main possible scenario relies on the presence of outwards stellar migration to build the
Figure 11. Radial density profile for a snapshot at t=10 Gyr (in blue), and distribution at time of birth of the stars ending up in the outer disc (in green). The fit of the profile at t=10 Gyr is plotted in red, and the corresponding break radius is indicated with a black vertical line.
outer dic (Roˇskar et al. 2008). We thus investigate where
the stars in the outer disc of our remnant galaxies come from, by calculating the radius at which they were born. The stellar discs of the two protogalaxies are separate before the collision and thus the birth radius with respect to the remnant galaxy cannot be defined. We therefore use in our analysis only the stars born after the merging, as in section
2.2.
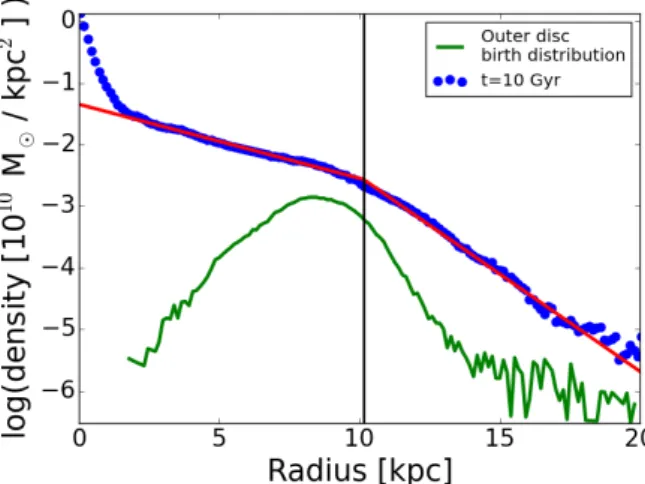
We define at any given time the stars of the outer disc as all the stellar particles located beyond the break. We plot
in Fig.11the distribution of the radii at birth of the stars
which by t=10 Gyr end up in the outer disc, for simula-tion mdf 730 from sample A, which was chosen because of its smooth profile, allowing us to make our points on migra-tion clearer. Since every star is born at a different time, this distribution does not represent a real stellar distribution at any time of the simulation, but it helps visualise the fraction of stars born at a given radius throughout the whole simu-lation. We can see that most stars of the outer disc (78 ± 18 per cent for sample A+B) were born at a radius less than the break radius found at t=10 Gyr. This means that these stars have migrated radially outwards to form the outer disc, establishing the presence of inside-out stellar migration in
the disc. This is in agreement with the results ofRoˇskar et
al.(2008) presenting simulations with a downbending disc
profile induced by a star formation threshold and outward
migration, and with observations e.g. inRadburn-Smith et
al.(2012) andZheng et al.(2015), and thus adds a further
argument to those presented in A16 that the remnant of a major merger is a disc galaxy and behaves in all aspects as such.
Having established that there is inside-out stellar migra-tion in our discs, we explore the effect of angular momen-tum on this phenomenon. To characterise the migration, we calculate the distances travelled by these stars migrating to-wards the outer disc, throughout the whole simulation. To derive the migration distances for a given simulation, we first compute the radial distance travelled by each star ending up
Figure 12. Mean inside-out migration distance of the stars end-ing up in the outer disc, as a function of the initial spin parameter λ, for sample A+B.
in the outer disc between its time of birth and the final state
(as defined in section2.2):
Dmig= Rf inal− Rbirth, (4)
where Rf inal and Rbirthare the radii at the final state and
at birth for each star. We remove again the stars born be-fore the merging since migration only starts after the
colli-sion, or, more precisely, after the disc formation begins (tbd,
A16). Since we are only interested in the outward migration towards the outer disc, we also remove the stars migrating inwards, which represent only about 5 per cent of the outer disc population. We then take the mean over all the remain-ing stars to get a sremain-ingle value for each simulation, which we plot versus λ. We repeat this for all the simulations in
sample A+B and plot the result in Fig.12. We see a clear
increasing trend of the migration distances with λ, allowing us to conclude that higher initial angular momentum sys-tems lead to discs with higher migration distances towards the outer disc. In fact, we find the same result if we consider inside-out migration in the whole disc, and do not restrict ourselves to outer disc stars. The stars travel globally further out in high angular momentum systems, and this is partic-ularly important in the outer disc, where 94 (±5) per cent of the stars have undergone inside-out migration (compared to 46±5 per cent for the whole disc).
The angular momentum thus seems to play an impor-tant role in the radial outward migration, by redistributing the stellar content in the outer disc efficiently (with large travelling distances) or not.
This result is consistent with outer discs in high λ simu-lations having larger scalelengths: if stars travel further out, their final distribution will be more extended, resulting in a larger outer disc.
5.4 Migration and birth radius
In section5.3, we showed that most particles ending up in
calcu-lated at t=10 Gyr. However, the stars whose birth
distribu-tion has been plotted in Fig.11were born at all times after
the merging. As will be shown for our simulations in Paper
IV (see alsoPerez 2004and Azzollini et al. 2008 for
obser-vations), the break radius generally increases with time, so
that stars which are born inside the 10 Gyr break in Fig.11
could in fact be born beyond the break taken at their time of birth. Therefore, we cannot claim that about 80 per cent of the outer disc’s stars that were born at a radius which cor-responds to the inner disc at 10 Gyr were actually born in the inner disc, since their birth radius could be in the outer disc at their birth time. Although this does not change the fact that most of these stars clearly migrated outwards, it could question the claim that they travelled from the inner disc to the outer disc.
To solve this, we took the same stars (i.e. the ones in the outer disc at 10 Gyr), and computed the fraction which was born in the inner disc defined with respect to the break at their time of birth. This fraction however depends strongly on the value taken for the break radius, since the break is
of-ten located near the end of structures such as spirals (Laine
et al. 2014; Paper IV), which are high star formation areas
(A16 for simulations and e.g.Silva-Villa & Larsen 2012for
observations). Besides, the break radius can be difficult to measure precisely at early times (a few Gyr after the merg-ing). We thus defined errorbars for the estimated break po-sition at each time step for every simulation, and excluded all the particles born closer to the break radius than these errorbars. To make sure our 10 Gyr outer disc definition is also reliable, we defined the particles of the outer disc as the ones located beyond the external errorbar of the break radius.
To exclude the effect of radial displacements due to
ra-dial oscillations of stars in their orbit, we chose to use RG
– the guiding radius of each star – instead of their regular
radius to derive their position with respect to the break. RG
is the radius of the circular orbit associated to the angular momentum of a given star, and can be derived by solving the equation:
RG=
Lz
vcirc(RG)
, (5)
where Lz is the vertical component of the angular
momen-tum of the star, and vcircis the circular velocity at the
guid-ing radius.
The fractions of outer disc stars that are born in the inner disc derived with this method cover a wide range of values depending on the simulations, from 10 to 80 per cent. Nevertheless, we find globally lower fractions than the ones
from section5.3, as well as the ones fromRoˇskar et al.(2008,
∼ 85 per cent), which can be explained by the fact that the break radius tends to increase with time (see paper IV), so that some stars were born inside the 10 Gyr break but outside their birth time break, and thus should be considered as being born in the outer disc. Note that these low fractions can not be explained by our choice to take the guiding radius instead of the regular radius, or to exclude the stars within the errorbars of the break radius: we performed the same analysis using the radius instead of the guiding radius, and also keeping the particles inside the errorbars, and found similar results in both cases.
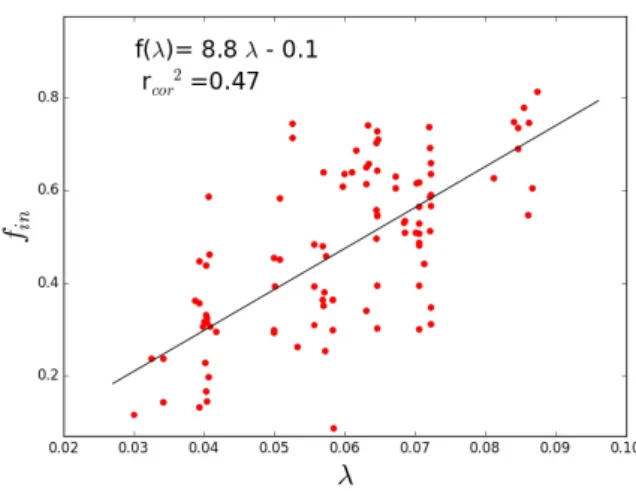
Figure 13. Fraction of outer disc stars which were born in the inner disc, as a function of the spin parameter λ, for sample A+B. For each star, the inner disc is defined here with respect to the break radius derived at its time of birth, as explained in section
5.4.
To understand the spread of values derived for the fraction of stars born in the inner disc, we tried to plot these fractions again versus the spin parameter λ (taken for all the components, 1 Gyr before the merging) in Fig.
13. Although having a large scatter (probably because of
the sensitivity of the values to the break location and its errorbars, and the difficulty to define them precisely at early times), this plot shows again an increasing trend of the fractions with λ. Therefore, galaxies with high angular momentum will have an outer disc which is populated by a majority of stars coming from the inner disc, whereas in low angular momentum galaxies, stars in the outer disc will mostly be born in the outer disc. It is important to
note that the trend found in Fig.13involves the fraction of
stars, i.e. relative and not absolute numbers. It thus does not imply that low angular momentum galaxies form more stars in their outer parts, since the number of stars in the outer disc is different in every simulation.
We thus have simulations which have outer discs formed mostly by radial migration, but with a significant amount of stars in the outer parts which were born in the outer disc. We conclude that not taking into account the fact that the break radius changes with time, can lead to overestimat-ing the fraction of stars born in the inner disc in the con-text of radial migration. Therefore, the picture of outer disc stars mostly coming from the inner disc has to be used with caution, since it depends on the angular momentum of the galaxy. Only galaxies with high spin parameter λ (λ>0.08 in our simulations) seem to be able to have about 80 per cent of their outer disc stars born in the inner disc. In galaxies with average or yet lower angular momentum (λ<0.06 in our simulations) this fraction drops below 50 per cent, dis-claiming the inner disc as the main origin of the outer disc stars.
6 SUMMARY AND CONCLUSION
For this series of papers we ran a sample of high resolution simulations of which three fiducial cases were described in A16, where more general information on the runs was also given. It was shown there that after a merging, a new disc forms in the remnant from gas accreting from the halo. In this paper, we used subsamples derived as
described in section 2.1. We derived the stellar radial
density profiles of the remnants at the end of all the simulations, and found downbending (type II) profiles. We then derived the corresponding inner and outer disc scalelengths, as well as the break radius. We used the spin parameter λ computed 1 Gyr before the merging to have a definition of the angular momentum consistent for all our simulations. Plotting for our sample the values derived from the radial density profiles fits as a function of λ, we found that the inner, the outer scalelength and the break radius increase with λ. Therefore, both the inner and the outer discs are larger for higher angular momentum systems. To explain how the initial orbit- and halo-dominated spin parameter λ of the merging system can affect the properties of the final remnant disc (mostly composed of stars born after the merging), we looked at the angular momentum re-distribution in our simulations. The scalelengths and break radius correlate with the baryonic angular momentum of the disc, suggesting a link between the latter and the initial an-gular momentum. To understand how the anan-gular momen-tum of the disc was acquired, we investigated the transfers of the baryonic matter and angular momentum between the halo and the disc, after making sure that the total baryonic angular momentum is conserved. In the framework of disc galaxy formation from a major merger of two progenitors with extended gas-rich haloes (A16), it is easy to understand that the gaseous halo gives angular momentum to the disc by accreting its gas onto it. We showed this in two fiducial simulations with different λ values, with the halo gas grad-ually loosing a fraction of its mass and angular momentum to the stellar disc, by gas accretion and star formation. We further found that haloes with higher initial total angular momentum (or λ) will create final discs with higher angular momentum, and larger scalelengths and break radius.
Naturally this scenario is only valid for an isolated system with no interactions with the environment. Thus our results, as well as those of other dynamical (and thus nec-essarily idealised) simulations, can not be straightforwadly extended to a cosmological context, since interactions with environment could interfere with the angular momentum exchanges between the gaseous halo and the baryonic disc. The correlations of the scalelengths and the break radius with λ are robust and do not change with the time at which we fit the radial density profiles, or the time used to com-pute λ. Furthermore, simulations of isolated galaxies follow the same trends, so that our results should be valid for discs formed both in isolation and in major mergers. In some sim-ulations, the spin axes of the protogalaxies are tilted, and we showed that the spin axis orientations of the two merging protogalaxies do not seem to play a role in this analysis.
We also included in the correlations a sample of 67 merger simulations with total masses lower or higher than
the simulations from the main sample. Although the evo-lution time-scale of these simulations is also different, we found that these simulations (which have total masses rea-sonably close to our main sample) fit well with the others in the correlations, and thus added them to the sample.
We analysed the outer disc origin, and found that the stars ending up in the outer disc were mostly born at smaller radii (∼95 per cent), suggesting inside-out migration as the main formation driver for the outer disc, in good agreement
with previous work on galaxies formed in isolation (Roˇskar
et al. 2008). To see the effect of the angular momentum on this migration, we computed the distance radially travelled by the stars towards the outer disc, and plotted it against the spin parameter λ for the simulations of our sample. We found a clear correlation, galaxies with higher angular momentum having larger inside-out migration distances.
We also showed that to study the origin of the outer disc, it is necessary to take into account the fact that the break location changes with time, so as to avoid overestimations of the fraction of stars born in the inner disc. While ∼80 per cent of the outer disc stars were born inside the break derived at t=10 Gyr, this fraction can take lower values (under 50 per cent) using the time dependent break, which sets doubt on the picture of the outer disc formed mainly from the inner disc. This fraction depends on the angular momentum, and is higher in high angular momentum galaxiess. Thus, in some low angular momentum systems, this fraction can drop to values even lower than 20 per cent.
We can thus conclude that the angular momentum is a key parameter in the creation of disc structures, as it affects radial migration, and can explain the large range of values observed for the inner and outer scalelengths in disc galaxies of a given mass.
ACKNOWLEDGEMENTS
We thank Jean-Charles Lambert for computer assistance, and the referee for useful suggestions. This work was sup-ported in part by the Polish National Science Centre un-der grant 2013/10/A/ST9/00023, and was granted access to the French HPC resources of [TGCC/CINES/IDRIS] un-der the allocations 2014-[x2014047098], 2015-[x2015047098] and 2016-[x2016047665], made by GENCI, as well as the
HPC resources of Aix-Marseille Universit´e financed by the
project Equip@Meso (ANR-10-EQPX-29-01) of the program « Investissements d’Avenir » supervised by the Agence Na-tionale de la Recherche.
REFERENCES
Athanassoula E., Rodionov S., Peschken N., Lambert J.C., 2016, ApJ, 821, 90 (A16)
Azzollini R., Trujillo I., Beckman J. E., 2008, ApJ, 684, 1026 Bakos J., Trujillo I., 2012, preprint (arXiv:1204.3082) Comer´on S. et al., 2012, ApJ, 759, 98
Dalcanton J. J., Spergel D.N., Summers F. J., 1997, ApJ, 482, 659
Debattista V. P., Mayer L., Carollo C. M., Moore B., Wadsley J., Quinn T. R., 2006, ApJ, 645, 209
Elmegreen B. G., Hunter D. A., 2006, ApJ, 636, 712 Elmegreen B. G., Struck C., 2013 ApJ, 775, L35 Elmegreen B. G., Struck C., 2016, ApJ, 830, 115
Erwin P., Beckman J. E., Pohlen M., 2005, ApJ, 626, L81 Erwin P., Pohlen M., Beckman J. E., 2008, AJ, 135, 20
Fathi K., Gatchell M., Hatziminaoglou E., Epinat B., 2012, MN-RAS, 423, L112
Ferguson A. M. N., Clarke C. J., 2001, MNRAS, 325, 781 Freeman K. C., 1970, ApJ, 160, 811
Gunn J. E., 1982, in Astrophysical Cosomology Proceedings, 233 Guti´errez L., Erwin P., Aladro R., Beckman J. E., 2011, ApJ,
142, 145
Hammer F., Flores H., Puech M., Yang Y. B., Athanassoula E., Rodrigues M., Delgado R., 2009, 507, 1313
Herpich J. et al., 2015a, MNRAS, 448, 99
Herpich J., Stinson G. S., Rix H. W., Martig M., Dutton A. A., 2015b, preprint (arXiv:1511.04442)
Herpich J., Tremaine S., Rix H. W., 2016, preprint (arXiv:1612.03171)
Kim J., Lee J., 2013, MNRAS, 432, 1701 Kim T. et al. 2014, ApJ, 782, 64 Laine J. et al. 2014, MNRAS, 441, 1992
Lin D. N. C., Pringle J. E., 1987, ApJL, 320, L87
Mu˜noz-Mateos J.C., Boissier, S., Gil de Paz, A., et al. 2011, ApJ, 731, 10
Mu˜noz-Mateos J.C. et al., 2013, ApJ, 771, 59 Peebles P.J.E., 1969, ApJ, 155, 393
Perez I., 2004, A&A, 427, L17
Pohlen M., Dettmar R. J., L¨utticke R., Aronica G., 2002 A&A, 392, 807
Pohlen M., Trujillo I., 2006, A&A, 454, 759 Radburn-Smith D. J. et al., 2012, 753, 138
Rodionov S. A., Athanassoula E., Peschken N., 2017, preprint arXiv:1701.02685 (R17)
Roˇskar R., Debattista V. P., Stinson G. S., Quinn T. R., Kauf-mann T., Wadsley J., 2008, ApJ, 675, L65
Schaye J., 2004, ApJ, 609, 667 Sheth K. et al., 2010, PASP, 122, 1397
Silva-Villa E., Larsen S. S., 2012, A&A, 537, A145 Springel V., 2005, MNRAS, 364, 1105
Springel V., Hernquist L., 2002, MNRAS, 333, 649 Springel V., Hernquist L., 2003, MNRAS, 339, 289 Struck C., Elmegreen B. G. 2017, MNRAS, 464, 1482 van der Kruit P.C., 1979, A&AS, 38, 15
Yoshii Y., Sommer-Larsen J., 1989, MNRAS, 236, 779
Younger J. D., Cox T. J., Seth A. C., Hernquist L., 2007, ApJ, 670, 269