HAL Id: hal-00316328
https://hal.archives-ouvertes.fr/hal-00316328
Submitted on 1 Jan 1997
HAL is a multi-disciplinary open access
archive for the deposit and dissemination of sci-entific research documents, whether they are pub-lished or not. The documents may come from teaching and research institutions in France or abroad, or from public or private research centers.
L’archive ouverte pluridisciplinaire HAL, est destinée au dépôt et à la diffusion de documents scientifiques de niveau recherche, publiés ou non, émanant des établissements d’enseignement et de recherche français ou étrangers, des laboratoires publics ou privés.
Substorm onset identification using neural networks and
Pi2 pulsations
P. R. Sutcliffe
To cite this version:
P. R. Sutcliffe. Substorm onset identification using neural networks and Pi2 pulsations. Annales Geophysicae, European Geosciences Union, 1997, 15 (10), pp.1257-1264. �hal-00316328�
Substorm onset identi®cation using neural networks
and Pi2 pulsations
P. R. Sutclie
Hermanus Magnetic Observatory, P.O. Box 32, Hermanus 7200, South Africa Received: 15 January 1997 / Revised: 11 April 1997 / Accepted: 15 April 1997
Abstract. The pattern recognition capabilities of arti®-cial neural networks (ANNs) have for the ®rst time been used to identify Pi2 pulsations in magnetometer data, which in turn serve as indicators of substorm onsets and intensi®cations. The pulsation spectrum was used as input to the ANN and the network was trained to give an output of +1 for Pi2 signatures and )1 for non-Pi2 signatures. In order to evaluate the degree of success of the neural-network procedure for identifying Pi2 pulsa-tions, the ANN was used to scan a number of data sets and the results compared with visual identi®cation of Pi2 signatures. The ANN performed extremely well with a success rate of approximately 90% for Pi2 identi®ca-tion and a timing accuracy generally within 1 min compared to visual identi®cation. A number of potential applications of the neural-network Pi2 scanning proce-dure are discussed.
1 Introduction
Over the past number of years arti®cial intelligence (AI) methods have been increasingly recognised as powerful analysis tools in solar-terrestrial physics. They have enabled or facilitated the identi®cation of relationships and patterns in a variety of data sets (McPherron, 1993; Joselyn et al., 1993). Arti®cial neural networks (ANNs) are a branch of AI methods which are proving particularly successful in solar-terrestrial time-series prediction (Koons and Gorney, 1991; Lundstedt, 1992; Gorney et al., 1993; Lundstedt and Wintoft, 1994; Wu and Lundstedt, 1996). In this paper the pattern recog-nition capabilities of ANNs have for the ®rst time been used to identify Pi2 pulsations, and consequently substorm onsets, in magnetometer data.
Pi2 pulsations are impulsive damped ULF, i.e. frequency band 6±25 mHz, oscillations of the geomag-netic ®eld which occur at the time of magnetospheric
substorm onsets and intensi®cations. Two decades ago, Saito et al. (1976) pointed out that Pi2 pulsations recorded at low latitudes, where amplitudes typically lie in the range 0.25±2.5 nT, are one of the clearest indicators of substorm onsets. They also pointed out the shortcomings of some of the other methods of identifying substorms. For example, auroral electrojet (AE) indices suer due to the inadequate spatial coverage of observing stations. DMSP satellite obser-vations suer from inadequate temporal coverage due to the satellite orbital period around the earth. The mid-latitude positive bay signature of substorms has a gradual onset, i.e. does not provide accurate timing, and is not observed in association with weak substorms. In their de®nition of a magnetospheric substorm, Rostoker et al. (1980) required that at least one Pi2 pulsation burst occur and stated that, if well de®ned, it accurately (1 min) identi®es the substorm onset. Furthermore, Pi2s occur with each substorm intensi®-cation. More recently Yeoman et al. (1994) made a comparison of mid-latitude Pi2 pulsations and geosta-tionary orbit particle injections and con®rmed that Pi2s serve as eective indicators of the onset of the substorm expansive phase. As a result of the utility of Pi2s for the identi®cation of substorm onsets, many researchers visually scan low-latitude magnetometer data for the occurrence of Pi2 pulsations in the course of their substorm research. The ®rst preliminary attempts to automate this scanning process using digital data were only recently made. Nose et al. (1995) used wavelet analysis for the detection of Pi2 pulsations for moni-toring substorm onsets. Sutclie (1995) attempted three methods for the automated detection of Pi2 pulsations; these were data adaptive ®ltering, maximum entropy prediction error ®ltering, and neural networks. These initial attempts indicated that neural networks had the greatest potential for success.
This paper builds on those initial successes. In particular, it has been found that speci®c pre-processing of the data makes the results more robust and signif-icantly improves the detection success rate. We are not
aware of any other automated means of detecting substorm onsets with a comparable degree of success. 2 Neural-network training and veri®cation
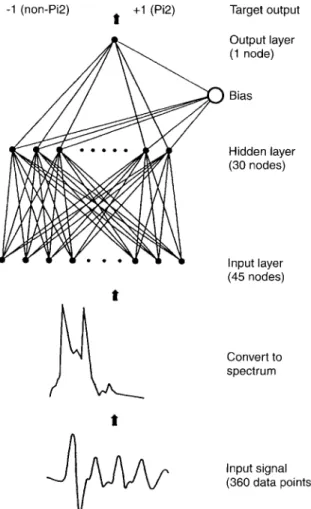
The ANN which we used for Pi2 pattern recognition was of the type known as a multilayer perceptron (Haykin, 1994). Our feed-forward fully connected ANN with one hidden layer was trained using the back-propagation algorithm, which remains the most widely used supervised training method. During this iterative process the ANN was trained to map a set of input values to a single target value. The network architecture and this process are illustrated schematically in Fig. 1. The central goal in ANN training is not to memorize the training data, but rather to model the underlying generator of the data (Bishop, 1996). An important factor in achieving this goal is that the amount of training be sucient, but that the network not be over-trained. A recommended method to ensure that an ANN is not over-trained is to stop training when the error measured using an independent validation set starts to increase. Consequently, an independent set of input values was used to determine when the ANN was suciently trained; training was ceased when the rms
error between the computed and target output values reached a stable minimum. We found limited pre-processing of the data (Bishop, 1996) to be important and to have a signi®cant eect on the quality of the results.
The input data for the ANN were obtained by selecting ULF pulsation events from the induction magnetometer data digitally recorded at the Hermanus Magnetic Observatory (HMO) with 1-s sampling. Event lengths ranging from 5 to 10 min were tried; however, experimentation indicated that a 6-min event length appeared to give the best overall results. The selected events were classi®ed into two groups, namely Pi2 signatures and non-Pi2 signatures. The event start times of Pi2 signatures were selected to be approximately 0.5 min prior to the onset of the Pi2 pulsations. Some of the selected Pi2 pulsations decayed within the 6-min event window, while others extended beyond it. Non-Pi2 events were intervals of either Pc3 pulsation activity, which typically have higher frequencies and smaller amplitudes than Pi2s, or insigni®cant pulsation activity. Examples of these various types of events are shown in Fig. 2.
Initially we used these event time-series as the input values for training the ANN. The number of nodes in the input layer in this case was thus 360. Increasing the sampling interval by up to eight times, in order to reduce the number of input nodes, had little eect on the results. After much experimentation we found that more robust results were obtained by ®rst computing the Fourier spectrum for each event. The ®rst 45 points of the amplitude spectrum (i.e. low-frequency end) were then used as the input values to the ANN with 45 input nodes. The amplitude spectra of the time-series in Fig. 2 are shown in Fig. 3. The ANN was trained to give target output values of +1 for Pi2 events and )1 for non-Pi2 events. The set of input values contained equal numbers of Pi2 and non-Pi2 events.
An important condition for good generalisation of an ANN is that the training examples form a suciently large and representative sample of the population of all cases. In initial tests we found relatively small dierences in the results for ANNs trained using 50 and 100 examples, indicating these to be suciently large sam-ples. In forming the samples of training examples we tried to ensure that Pi2s with a variety of shapes, frequencies and amplitudes were selected. For purposes of demonstration, we trained ANNs for each of three independent sets of input values; the ®rst set consisted of only four events (ANN-S4), which is obviously not a representative sample, set two of ten events (ANN-S10), and set three of 100 events (ANN-S100), which we believe to be a representative sample.
3 Neural-network scanning
Each of the three trained ANNs were utilised to scan digital induction magnetometer data for the occurrence of Pi2 pulsations. In order to do this, data windows commencing 1 min apart and equal in length to that of
Fig. 1. Schematic representation of the data pre-processing and neural-network architecture used to identify Pi2 pulsations
the events used for training, that is 6 min, were sequentially taken from the interval of data to be scanned. The data for each window were pre-processed in a manner similar to that of the training data, that is, computation of Fourier amplitude spectrum, and then presented to the ANN. For each data window thus presented to the ANN a single output value in the range )1 to +1 was obtained. The expected result of this process is that if the data window contains no evidence of a Pi2 pulsation, the output value will lie close to )1. However, if the data window contains evidence of a Pi2 pulsation, the expected output is a value close to +1. In the lower part of Fig. 4 the induction magnetometer data for an interval spanning a number of Pi2 pulsations are plotted. Also plotted are the output values of the ANN for each data window; each output value is plotted at the time equal to the start time of the corresponding data window. The output values in the centre part of Fig. 4 are those where the input values to the ANN were the actual time-series data, while the output values in the upper part are those where the amplitude spectrum was used as input. The results in Fig. 4, and many others like it, showed that converting the input data to a Fourier spectrum prior to presen-tation to the ANN gave more decisive and consistent results than those using the time-series directly.
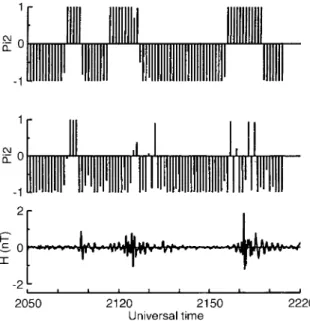
In Fig. 5a the H-component data for a 24-h interval, i.e. 29 January 1988, are plotted. Also plotted are the output values for the ANNs trained using the three independent sets of training data. The output values in Fig. 5b are those for the ANN trained using the set of four events, those in Fig. 5c using the set of ten events, and those in Fig. 5d using the set of 100 events. In all cases conversion to Fourier spectrum was made at the pre-processing stage. The two large, clear Pi2 signatures with onsets at 2054 and 2133 UT were identi®ed by all
Fig. 2. Examples of the types of events used to train the ANN; Pi2 signature (upper) and non-Pi2 signatures, i.e. Pc3 pulsation (centre) and insigni®cant activity (lower)
Fig. 3. Amplitude spectra of the time-series in Fig. 2; Pi2 signature (solid line), Pc3 pulsation (short dashed line), and insigni®cant activity (long dashed line)
Fig. 4. Examples of the output from the ANN when a section of data containing Pi2 signatures (lower) is scanned. The outputs at centre and upper are those obtained when the time-series itself and the amplitude spectrum of the time-series, respectively, are used
Fig. 5. a Example of a 24-h interval of induction magnetometer data. The sequences of output values for the ANNs trained usingb 4 events, c 10 events, and d 100 events are also shown for comparison
three ANNs; these were the only Pi2s identi®ed by ANN-S4. Since ANN-S4 was trained using an extremely limited set of patterns, we might expect that it would only be able to recognise clearly de®ned and isolated Pi2s. These two Pi2s occurred within an hour of the time at which Pi2s occur with maximum frequency at Hermanus (Sutclie, 1975), that is, the time when Pi2s are also most clearly and easily observed. ANN-S10 and ANN-S100 also clearly identi®ed Pi2s with onsets at 0958 and 1550 UT; these are dayside Pi2 pulsations. Generally, Pi2s are regarded as nightside phenomena; however, Sutclie and Yumoto (1989, 1991) demon-strated that at low latitudes they are regularly observed during the daytime, although often hidden by other pulsation types. Inspection of the AE indices revealed that, on the basis of AE magnitude, these were the onsets of the two largest substorms observed on 29 January 1988. ANN-S100 identi®ed a number of other Pi2s, but with less certainty, that is, with a lesser number of positive values and with these values less than +1. Inspection of the Hermanus pulsation data revealed what appeared to be small Pi2s at 1445 and 1512 UT. We also inspected the magnetometer data from Kakio-ka, which was in the nightside hemisphere at these times, and found clear Pi2 signatures. Inspection of the Hermanus and Kakioka pulsation data at 0550 and 1620 UT revealed slight enhancements in pulsation activity, but it was not possible to say with certainty whether or not these were Pi2s. On the basis of these and other similar examples, we implemented a cut-o criterion in the computer program which scans for Pi2s. If a sequence of four or more positive spikes exceeding 0.4 in value occur then the occurrence of a Pi2 is signalled. In all subsequent scans for Pi2s we used this criterion with the ANN-S100 network. Thus on 29 January 1988 the occurrence of Pi2s are reported at 0958, 1446, 1512, 1550, 2054 and 2133 UT when the Hermanus data are used.
4 Results
In order to evaluate the degree of success of the neural-network procedure for identifying Pi2 pulsations the ANN-S100 was used to scan three data sets. The ®rst two of these sets each consisted of intervals of ten consecutive days of magnetometer data selected so as to exclude the occurrence of any major magnetic storm activity. Storm periods were excluded in order to guarantee intervals of isolated substorms rather than the complex superposition of substorm activity which occurs during large storms. The ®rst data set consisted of the Hermanus induction magnetometer data for the period 1988 day numbers 24 to 33. This interval fell within the 6-month period from which the events used for training the ANN were selected. The second data set consisted of Hermanus induction magnetometer data for the period 1987 day numbers 185 to 194, which fell outside the period from which the training events were selected. The third data set consisted of isolated days of
magnetometer data when conditions were such that the ANN might be expected to fail.
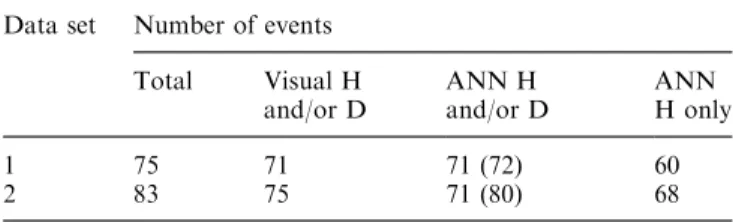
Each data set was ®rst inspected visually and the onset times of all Pi2 pulsation events noted to the nearest minute. Since Pi2 pulsations at low latitudes are generally more clearly de®ned in the H component than in D, the H component was primarily used for this purpose. However, in those cases where the D compo-nent was more clearly de®ned, the D-compocompo-nent onset times were used. The H- and D-component data for each set were then scanned separately using the ANN-S100. The number of events identi®ed by these various means for the ®rst two data sets are compared in Table 1, where the non-parenthesised values are those which satisfy the cut-o criterion mentioned previously. The results in the table show that the ANN performed well in the identi®cation of Pi2 events, with a combined success rate for the two data sets of 90% if both H and D are scanned. If only the H component is scanned, then the combined success rate is reduced to 81%.
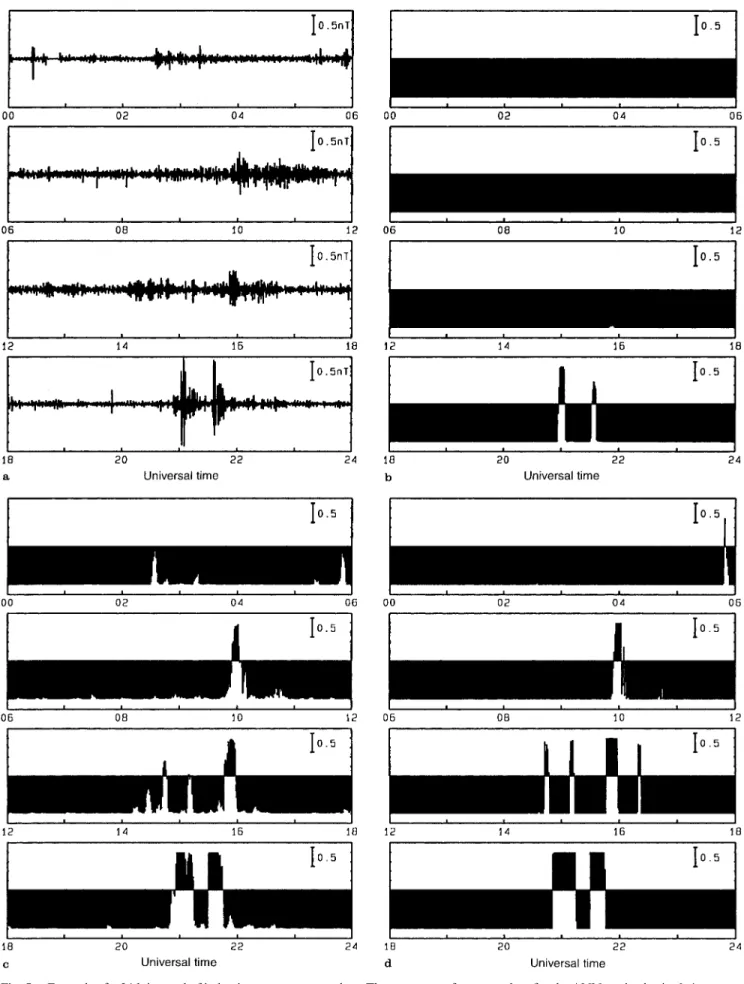
We now brie¯y consider the reasons for some of the apparent failures. In the ®rst data set a total of 75 Pi2 events were identi®ed. Four of the events identi®ed by the ANN were not identi®ed visually, thus it was necessary to investigate whether or not the ANN was selecting some non-Pi2 events. Each of these reported events occurred during mid-afternoon at Hermanus, which closely corresponds to local midnight at Kakioka in Japan. Consequently, the Kakioka magnetometer data were inspected and in each case a Pi2 pulsation was clearly visible at the times corresponding to the ANN events at Hermanus. Inspection of the AE indices at the reported times revealed signi®cant electrojet intensi®ca-tions con®rming that they were associated with sub-storm onsets or enhancements. Thus it is concluded that the ANN was able to identify Pi2s which were missed by visual scanning. The reason for these Pi2s not being visible to the eye is that they were masked by superposed continuous pulsation activity. Sutclie and Yumoto (1989) found this to be the reason why many daytime Pi2s are not easily visible. An example is shown in Fig. 6 where the lower trace clearly shows a train of three successive Pi2s at Kakioka. The centre trace shows the corresponding data for Hermanus, where the Pi2s are masked by superposed Pc3 pulsation activity, which is typical of the dayside hemisphere. The upper trace shows the output of ANN-S100 scanning in which two of the Pi2s at 1453 and 1502 UT are clearly identi®ed. In the second data set eight of the Pi2 events identi®ed by
Table 1. Comparisons of the total numbers of Pi2 events with the numbers identi®ed visually and by the ANN for each of the data sets
Data set Number of events Total Visual H
and/or D ANN Hand/or D ANNH only
1 75 71 71 (72) 60
the ANN were not identi®ed visually; all occurred during local daytime. Five of these events were con-®rmed to be Pi2s by inspection of Kakioka data. However, three appeared to be non-Pi2 events; the reason for their selection by the ANN was due to enhancements in the amplitude of pre-existing Pc4 pulsation activity being interpreted as Pi2 signatures.
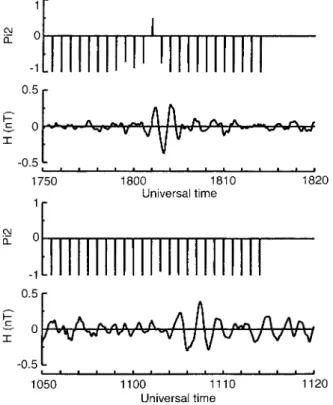
Table 1 indicates that a number of Pi2 signatures were identi®ed by visual observation but not by the ANN; there were four such cases in the ®rst data set. Inspection of the data revealed that in all cases the pulsations were of small amplitude. Two examples are illustrated in Fig. 7. In the lower example the Pi2 at 1104 UT was not detected at all by the ANN. In the upper example the Pi2 at 1801 UT was detected by the ANN, but not reported because it did not pass the selection criteria discussed previously. Inspection of the AE indices at the times of these Pi2s revealed that they were associated with extremely weak substorms, prob-ably with a signi®cantly contracted auroral oval. In the second data set there were twelve events which were identi®ed visually but not by the ANN. Plots of the ANN output revealed that nine of these were in fact detected by the ANN, but rejected due to the selection criteria. If all events detected by the ANN are taken into account, as indicated by the numbers in parentheses in Table 1, then the combined success rate of the ANN is increased to 96%. An advantage of the ANN method of Pi2 identi®cation is that if desired, the network can be trained to be more sensitive by including more small-amplitude examples in the training data set.
The ANN utilises the amplitude spectrum of pulsa-tion events as input. Therefore, we might expect the
presence of non-Pi2 oscillations with frequencies lying in the Pi2 band to result in apparently positive identi®ca-tion of non-Pi2 events. In order to test this inference, the third data set was constituted of isolated days on which pulsation activity in the Pi2 frequency band occurred. Two types of activity were investigated, namely Pc4 pulsations and broad-band activity during geomagnetic storms. On two days, namely 1989 days 3 and 4, there was almost continuous Pc4 pulsation activity during local daytime at Hermanus. Scanning these two days with the ANN-S100 identi®ed 41 events as Pi2s. Visual inspection of the pulsation data revealed a few of these events to be enhancements in amplitude of pre-existing Pc4 pulsations. Some of these enhancements were correlated with simultaneous Pi2 signatures at Kakioka in the nightside hemisphere; these were regarded to be Pi2s. However, eleven of these amplitude enhancements were not correlated with clear Pi2 signatures; these can be regarded as falsely reported Pi2s. All of these false reports were for events which occurred between 09 and 16 LT. We thus conclude that the ANN will occasion-ally falsely identify enhancements in the amplitude of Pc4s, which are typically daytime pulsations, as being Pi2 pulsations. If the ANN is used only for scanning data from the night-time hemisphere, this problem will be avoided. During large geomagnetic storms induction magnetometers record broad-band oscillations for much of the storm's duration. The ANN-S100 was used to scan two days of data where the K indices were all 5 or greater. For many hours the output of the neural
Fig. 6. Example where the ANN was able to identify Pi2 signatures which were not visually discernible due to the presence of Pc3 pulsations. The upper diagram shows the sequence of ANN output values obtained for the input data in the centre diagram. The Kakioka
magnetometer data (lower) con®rms the occurrence of Pi2 signatures Fig. 7. Examples where the ANN failed to identify Pi2 signatures which were visually discernible. In the lower example there is no evidence of the Pi2 in the ANN output. In the upper example there is evidence of the Pi2 in the ANN output, but it failed the selection criteria for reporting
network was a sequence of +1s. We thus conclude that during large geomagnetic storms, the ANN fails as a means of identifying Pi2s. However, we point out that at such times it is also not possible visually to identify Pi2 signatures.
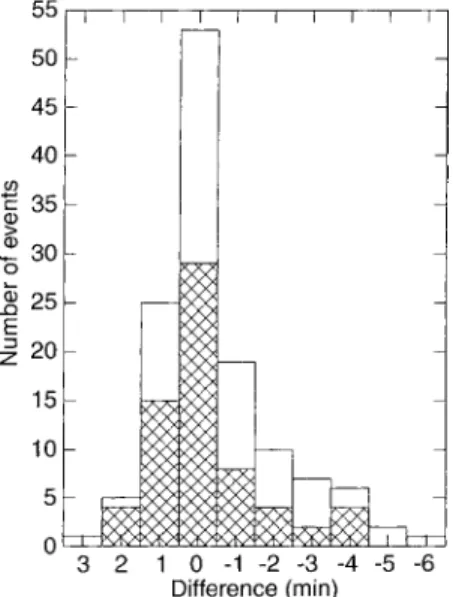
We next consider the timing accuracy of the ANN Pi2 identi®cation method. In order to do this the dierence between the onset times of Pi2s determined by visual inspection and by the ANN were noted. The time dierences for the ®rst two data sets are presented in Fig. 8 in the form of a histogram. It is seen that in the majority of cases the onset times determined by visual inspection and ANN scanning corresponded. In those cases where there was a dierence, the majority diered only by 1 min. In a number of cases the ANN scanned onset times were four or more minutes later than those determined by visual inspection. Investigation of the cause revealed that timing errors may occur in cases where the Pi2 amplitude is very small, where the amplitude increases gradually rather than being impul-sive, or when Pi2s overlap. It is in these cases that an experienced observer also has diculty in determining an accurate onset time.
5 Applications
The neural-network-based process which has been developed to identify Pi2 pulsations in magnetometer data has been shown to work extremely well. It could thus serve as a useful and powerful tool in substorm research. We now brie¯y discuss some of the potential applications:
1. This process can be implemented in real time to identify Pi2 pulsations, and consequently substorm onsets and enhancements, as they occur. Many years ago Saito et al. (1976) proposed that by continuously
monitoring Pi2 pulsations from three low-latitude ground stations evenly spaced in longitude, the onset of most substorms could be identi®ed. Although this suggestion had signi®cant merit, the technology at the time was not adequate to implement easily the idea in practice. Since that time, however, signi®cant develop-ments have taken place. Geomagnetic data are contin-uously recorded in digital form at many observatories. The means exist to distribute data in near real time. More sophisticated data processing techniques have been developed. Consequently, we suggest that the idea of continuously monitoring the occurrence of substorms by utilising observations of low-latitude Pi2 pulsations could be implemented relatively easily.
2. The HMO regularly receives requests from re-searchers world-wide to scan its induction magnetom-eter data for Pi2s. Generally, the purpose of such requests is either to determine or con®rm the occurrence of substorms during a speci®ed interval of time, or to determine or con®rm the onset time of a speci®c substorm. In the past this has been done by plotting and visually inspecting the data, which, when there are a large number of events, can be time consuming. The new process will enable this task to be done rapidly and objectively. It will be particularly useful where the identi®cation of a large number of events from archived data, for example for statistical studies, is required.
3. The ANN process might be used to search for substorms with, or classify substorms according to, certain characteristics which are related to speci®c Pi2 parameters. The ANN-S100 utilised in this paper was trained to identify Pi2s with a broad range of frequen-cies, amplitudes, durations and shapes. However, an ANN might be trained where one or more of these parameters allow for only a narrow range of values; for example, ANN-S4 selected only large-amplitude Pi2s. An ANN might also be trained to classify Pi2s into one or more groups, for example, according to frequency. The ability to make an automated search for Pi2s with periods exceeding 100 s would have been particularly useful to Sutclie and Nielsen (1990) in their search for Pi2 signatures in STARE data. Because of the limited 20-s time resolution of STARE data, Sutclie and Nielsen (1990) ®rst visually scanned Hermanus induc-tion magnetometer data for Pi2s with periods exceeding 100-s. This was a time-consuming process which could have been speeded up signi®cantly using the ANN pattern recognition method.
6 Conclusion
We have used the pattern recognition capabilities of arti®cial neural networks to develop a technique to identify Pi2 pulsations by the automated scanning of digital magnetometer data. Since low-latitude Pi2 pul-sations are among the clearest indicators of magneto-spheric substorm onsets and enhancements, the proce-dure is ideally suited to substorm onset and enhancement identi®cation. We have shown the proce-dure to be extremely reliable and pointed out a number
Fig. 8. Histogram showing the dierences in onset times of Pi2 signatures determined visually and by the ANN; the signs are in the sense of visual minus ANN timing. The cross hatched and plain regions represent the dierences for data sets 1 and 2, respectively
of applications. In future work we plan to train ANNs to identify Pi2 pulsations with speci®c parameters and then to evaluate this as a procedure for the character-isation of substorms.
Acknowledgements. The Kakioka magnetometer data and AE indices were supplied by T. Iyemori and T. Kamei, respectively, of the Data Analysis Center for Geomagnetism and Space Magne-tism, Faculty of Science, Kyoto University, Kyoto, Japan.
Topical Editor K.-H. Glaûmeier thanks A. W. P. Thomson and another referee for their help in evaluating this paper.
References
Bishop, C. M., Neural networks for pattern recognition, Oxford University Press, New York, 1996.
Gorney, D. J., H. C. Koons, and R. L. Waltersheid, Some prospects for arti®cial intelligence techniques in solar-terrestrial predic-tions, in Solar-terrestrial predictions: workshop IV, Eds Hruska et al., Boulder USA, p. 550, 1993.
Haykin, S., Neural networks. A comprehensive foundation, Mac-millan College, New York, 1994.
Joselyn, J., H. Lundstedt, and J. Trolinger, (Eds.) Proceedings of the international workshop on arti®cial intelligence applications in solar-terrestrial physics, Boulder USA, 1993.
Koons, H. C., and D. J. Gorney, A neural network model of relativistic electron ¯ux at geosynchronous orbit, J. Geophys. Res., 96, 5549, 1991.
Lundstedt, H., Neural networks and predictions of solar-terrestrial eects, Planet. Space Sci., 40, 457, 1992.
Lundstedt, H., and P. Wintoft, Prediction of geomagnetic storms from solar wind data with the use of a neural network, Ann. Geophysicae, 12, 19, 1994.
McPherron, R. L., Applications of arti®cial intelligence to space weather forcasting, in Solar-terrestrial predictions: workshop IV, Eds. Hruska et al., Boulder USA, p. 611, 1993.
NoseÂ, M., T. Iyemori, H. J. Singer, and E. W. Worthington, Real-time detection of Pi2 pulsations by wavelet analysis for monitoring substorm onsets, Paper GAA52E-6 presented at the XXI General Assembly of the IUGG, Boulder, USA, July 1995.
Rostoker, G., S.-I. Akasofu, J. Foster, R. A. Greenwald, Y. Kamide, K. Kawasaki, A. T. Y. Lui, R. L. McPherron, and C. T. Russell, Magnetospheric substorms ± de®nition and signatures, J. Geophys. Res., 85, 1663, 1980.
Saito, T., K. Yumoto, and Y. Koyama, Magnetic pulsation Pi2 as a sensitive indicator of magnetospheric substorm, Planet. Space Sci., 24, 1025, 1976.
Sutclie, P. R., The association of harmonics in Pi2 power spectra with the plasmapause, Planet. Space Sci., 23, 1581, 1975. Sutclie, P. R., The development of a Pi2-based substorm index,
Paper GAA52E-7 presented at the XXI General Assembly of the IUGG, Boulder, USA, July 1995.
Sutclie, P. R., and E. Nielsen, STARE observations of Pi2 pulsations, Geophys. Res. Lett., 17, 603, 1990.
Sutclie, P. R., and K. Yumoto, Dayside Pi2 pulsations at low latitudes, Geophys. Res. Lett., 16, 887, 1989.
Sutclie, P. R., and K. Yumoto, On the cavity mode nature of low-latitude Pi2 pulsations, J. Geophys. Res., 96, 1543, 1991. Wu, J.-G., and H. Lundstedt, Prediction of geomagnetic storms
from solar wind data using Elman recurrent neural networks, Geophys. Res. Lett., 23, 319, 1996.
Yeoman, T. K., M. P. Freeman, G. D. Reeves, M. Lester, and D. Orr, A comparison of midlatitude Pi2 pulsations and geosta-tionary orbit particle injections as substorm indicators, J. Geophys. Res., 99, 4085, 1994.