HAL Id: hal-00238559
https://hal.archives-ouvertes.fr/hal-00238559
Submitted on 19 Feb 2008HAL is a multi-disciplinary open access archive for the deposit and dissemination of sci-entific research documents, whether they are pub-lished or not. The documents may come from teaching and research institutions in France or abroad, or from public or private research centers.
L’archive ouverte pluridisciplinaire HAL, est destinée au dépôt et à la diffusion de documents scientifiques de niveau recherche, publiés ou non, émanant des établissements d’enseignement et de recherche français ou étrangers, des laboratoires publics ou privés.
Using spaceborne surface soil moisture to constrain
satellite precipitation estimates over West Africa
Thierry Pellarin, Abdou Ali, Franck Chopin, Isabelle Jobard, Jean Claude
Bergès
To cite this version:
Thierry Pellarin, Abdou Ali, Franck Chopin, Isabelle Jobard, Jean Claude Bergès. Using spaceborne surface soil moisture to constrain satellite precipitation estimates over West Africa. Geophysical Research Letters, American Geophysical Union, 2008, 35 (2), pp.1-5. �10.1029/2007GL032243�. �hal-00238559�
Using spaceborne surface soil moisture to constrain satellite
1precipitation estimates over West Africa
23
Thierry Pellarin1, Abdou Ali2, Franck Chopin3, Isabelle Jobard3, Jean-Claude Bergès4 4
5
1
Université de Grenoble, CNRS/INSU, LTHE, Grenoble, France 6
2
Centre AGRHYMET, Niamey, Niger 7
3
LMD-IPSL, Ecole Polytechnique, CNRS, Univ Paris-Sud, Chatenay Malabry, France 8
4
PRODIG, CNRS, Paris 1, Paris IV, Paris 7, EPHE, France 9
10
Abstract
11
12
This paper describes a methodology to use the passive microwave measurements of the 6.9 13
GHz bandwidth of the AMSR-E sensor which is the most sensitive to surface soil moisture, to 14
constrain satellite-based rainfall estimates over a semi arid region in West-Africa. The paper 15
focuses on the aptitude of AMSR-E measurements to inform if rain occurs or not. The study 16
was conducted over a 125x100 km² region located in Niger where a dense recording 17
raingauge network is available to build an accurate ground-based 3-hour rainfall product at 18
the 25x20 km² resolution. A satellite-based rainfall product (EPSAT-SG), based on both 19
infrared and microwave measurements, was compared to the ground-based rainfall product. It 20
was shown that EPSAT-SG overestimates by about 30 % the total number of rainy events 21
during the 2004 and 2006 rainy seasons. A simple methodology based on the AMSR-E 22
polarization ratio variations related to the surface soil moisture leaded to suppress a large 23
amount of the wrong rainfall events. 24
1
1. Introduction
2
3
In West Africa the existing rain gauges network is very sparse and is often nonexistent. 4
Satellite rainfall estimates, which offer global coverage and operational data accessing, have 5
been attempted to alleviate these problems. Numerous precipitation algorithms are based on 6
Infrared (IR) techniques from geostationary satellites such as METEOSAT [Arkin and 7
Meisner, 1987]. Some algorithms use Microwave (MW) sensors available on polar orbiting
8
satellites, such as the Special Sensor Microwave/Imager [Grody, 1991] or Tropical Rainfall 9
Measuring Mission Satellite [Viltard et al., 2006]. Besides, some precipitation algorithms are 10
based on both IR and MW satellite measurements [Jobard et al.,1994]. Geostationary 11
satellites offer very good temporal sampling of cloud characteristics but the main drawbacks 12
is that they provide cloud-top characteristics which relationship with rain-rate is not direct. 13
Furthermore, since clouds are larger and last longer than individual rain events, the risk of 14
overestimation of the number of rain event is very high. On the other hand, the MW data are 15
sensitive to the concentration of ice particles or droplets associated with precipitation. 16
However, since MW observations are less frequent than IR observations they suffer from 17
larger sampling errors because of the high variability of rainfall systems. This is particularly 18
the case in the Sahel where more than 50% of the total annual rainfall falls within only 4 19
hours [Balme et al., 2006]. In such a situation, MW observations suffer by under-sampling the 20
rain event and lead to poor rainfall cumulative estimates. In general, cumulative rainfall 21
estimates from IR techniques are better than from techniques using MW only [Jobard et al., 22
2007]. However, they might exaggerate the number and/or duration of rain events. 23
Although the rain duration might be very short, the effect of the rain (i.e. the surface soil 24
moisture) can last longer. In this context, surface soil moisture measurements provided by 25
various microwave sensors such as the Advanced Microwave Scanning Radiometer - EOS 1
(AMSR-E), the ERS-Scatterometer or the recent ASCAT onboard the METOP platform may 2
provide useful information related to the precipitation estimates in data-poor area [Crow and 3
Bolten, 2007]. The objective of this study is to investigate the possible synergy of
satellite-4
based rainfall estimates and satellite-based soil moisture measurements to improve rainfall 5
estimates. 6
7
2. Data and Method
8
9
2.1AMSR-E Brightness Temperatures
10
11
The AMSR-E (Advanced Microwave Scanning Radiometer) onboard the AQUA satellite 12
(operated by NASA) is regularly acquiring data since June 2002 [Njoku et al., 2003]. The 13
instrument operates at two different low frequencies 6.9 GHz (C-band) and 10.7 GHz (X-14
band) and three higher frequencies 18.9, 36.8, and 89.0 GHz. Measurements are obtained for 15
two polarizations and a single incidence angle of 55° at the surface. At C-band frequency, the 16
nominal spatial resolution of the level-2 product is 55 km at approximately 1:30 and 13:30 17
local time for descending and ascending tracks respectively. Due to overlapping (55 km scene 18
measurements are recorded at equal intervals of 10 km), a level-3 product is available at a 19
higher spatial resolution of 25x20 km² in a regular Lat-Lon grid. The temporal resolution is 20
ranging from 12 hours to 36 hours (390 measurements in average over each pixel of West 21
Africa during 2004). 22
23
Passive microwave measurements at frequencies of 1 to 10 GHz are known to be strongly 24
related to the soil dielectric constant which is physically related to soil moisture. At these 25
frequencies, the atmosphere and clouds have a limited influence and the main part of the 1
emission signal comes from soil moisture, vegetation water content, soil temperature and soil 2
roughness effects. Thus, a sudden change of the soil microwave emission is obviously due to 3
soil temperature and/or soil moisture variations since the two other factors vary at small time 4
frequencies. To separate between these two effects, the use of both vertical and horizontal 5
polarization measurements allows filtering the effect of the soil temperature, the polarization 6
ratio (PR) being frequently used to describe the soil moisture variations [Wigneron et al., 7 2003]. 8 9 H V H V TB TB TB TB PR + − = (1) 10 11
where TBV and TBH are the brightness temperatures at vertical and horizontal polarization
12
respectively (in kelvin). As the soil moisture increases, TBH decreases more rapidly than TBV.
13
Then, an increase of the soil moisture leads to an increase of the polarization ratio. 14 15 16 2.2Rainfall products 17 18
2.2.1 Ground-based rainfall product 19
20
In this study, we focus on a 125x100 km² area located in Southwestern Niger (1.8°E to 3.1°E; 21
13°N to 14°N). A recording raingauge network continuously operated over this area since 22
1990 was part of the EPSAT-Niger long term monitoring program [Lebel et al., 1992], and its 23
follow up AMMA-CATCH. Based on 31 of these raingauge stations, a kriging procedure (see 24
Ali et al., [2005] for the methodology) was used to provide a ground-based rainfall product at 25
the AMSR-E spatial resolution [25x20 km²] and 3-hour temporal resolution for the 2004 and 1
2006 rainy seasons. 2
3
2.2.2 EPSAT-SG rainfall product 4
5
The EPSAT-SG (Estimation des Précipitations par SATellite - Seconde Génération) rainfall 6
product was developed in the framework of the African Monsoon Multidisciplinary Analysis 7
(AMMA) project by Chopin et al. [2005]. The algorithm combines the IR geostationary 8
satellite data provided by Meteosat 8 and the low orbiting satellite MW data of the TRMM 9
radar, using a neural network procedure. The EPSAT-SG elementary product is computed at 10
the Meteosat pixel resolution (3x3 km², 15 min) allowing, by integration, the provision of the 11
final product at different space and time scales that fit with any user requirements. However, 12
this product has only been validated for 10-day periods and 0.5 degree space resolution over 13
Sahelian countries. In this study, the space and time scales of the EPSAT-SG rainfall product 14
was degraded in order to match that of the ground-based rainfall product (i.e. 25x20 km², 3-15
hour). 16
17
2.2.3 Qualitative comparison of the two products 18
19
A qualitative comparison of the rainfall products is performed from both a temporal and a 20
spatial point of view. Figure 1 illustrates the temporal variation of the two rainfall products on 21
one pixel as well as AMSR-E PR variation, during the 2004 rainy season. The analysis of the 22
two rainfall products suggests four main comments: (i) there are 29 ground-based rainfall 23
events (a rainfall event is defined as a rainfall period separated by at least 18h without rain 24
greater than 0.1 mm/3h) and all these 29 events are detected by the EPSAT-SG algorithm, (ii) 25
there are 44 EPSAT-SG rainfall events, i.e. 15 out of 44 events are incorrect since there is no 1
rainfall at the ground level (i.e. 34 % of “wrong” rainfall events) (iii) the cumulative annual 2
rainfall (not shown) is 391 mm and 350 mm for the ground-based and the EPSAT-SG rainfall 3
product respectively and, (iv) rainfall intensities of the EPSAT-SG product are 4
underestimated. 5
6
7
Figure 2 presents a map of the 4-day cumulative EPSAT-SG rainfall estimate over West 8
Africa (from 10°N to 20°N) from 22 to 26 of June 2004. Also presented in Figure 2 is the sum 9
of the positive variation of the AMSR-E polarization ratio during the same period. The 10
obtained map indicates pixels where the polarization ratio (i.e. the surface soil moisture) 11
increased from 22 to 26 of June 2004. An overall reasonable spatial agreement is observed 12
between the two images, indicating that the soil emission changed where significant rain 13
occured. However, there are regions where no significant PR variation is recorded while the 14
EPSAT-SG algorithm produces significant rain. 15
The first such region is Guinea (SW of the domain): PR variations over Mali correspond to 16
rain but when moving to the SW, the PR variation gradually vanished whereas the rain 17
estimates remains high. This can be due to either an erroneous rainfall estimation of the 18
EPSAT-SG algorithm or a too weak variation of the PR signal caused by vegetation 19
attenuation in Guinea. Another possible reason may be related to the delay between rain and 20
the AMSR-E measurement. As the revisiting time of AMSR-E is ranging from 12 to 36 hours, 21
it is possible that several pixels are observed a long time after the rain has fallen which leads 22
to a weaker soil emission signal due to evaporation in the mean time. 23
Differences can also be observed over our region of interest in South-western Niger (rectangle 24
in Figure 2), no PR variation is occurring in that region in spite of significant EPSAT-SG 25
rainfall estimates on the South-eastern part of the area. The explanation of that behaviour is an 1
erroneous rainfall estimate as confirmed in Figure 1 where no rain occurs from June 22nd to 2
June 26th. 3
4
5
2.3In-situ soil moisture measurements
6
7
Although not available in 2004, in-situ soil moisture measurements provided by 6 CS616 8
sensors installed in 2006 over a 10x10 km² area help clarifying the sources of mismatches 9
between PR and ground rainfields. Figure 3 shows the temporal evolution of the six local soil 10
moisture measurements as well as the AMSR-E PR evolution and the ground-based rainfall 11
product of the closer 25x20 km² pixel. Regarding soil moisture measurements, it can be 12
observed that some rain events do not affect all the soil moisture sensors in a similar way (for 13
instance July 31st, August 3rd and August 9th). This is explained by the strong spatial 14
heterogeneity of rain events which are mostly convective systems with spatial correlation 15
length of about 30 km [Ali et al., 2003]. On the other hand, it can be seen that each rainfall 16
event affects at least one soil moisture sensor. 17
18
Regarding the PR measurements in Figure 3, it can be noted that almost all rainfall events 19
lead to an increase of the PR signal, except for 3 rainfall events (designated by grey arrows) 20
where the PR variation is weak. This behaviour is not due to the cumulative rainfall since a 21
very weak rainfall event (for instance on the August 14th) has a strong impact on the PR 22
signal. The explanation of that behaviour deals with significant evapotranspiration rate in this 23
region associated with the AMSR-E revisiting time. The delay between the 3 considered 24
rainfall events and the following AMSR-E PR measurements are 28h 32min, 27h 40min and 25
22h 40min for July 17th, July 19th and July 31st events respectively. Corresponding PR 1
variations are respectively 0.0047, 0.0025 and 0.0091. 2 3 4 2.4Methodology 5 6
The methodology developed in this study makes use of the temporal variations of AMSR-E 7
PR to confirm or suppress EPSAT-SG estimated rainy events. The proposed methodology is 8
based on the calibration of two parameters for each EPSAT-SG rainfall timestep. The first 9
one is the delay (∆t) between the end of the rainfall timestep and the next AMSR-E 10
measurement. This delay can ranges from 0 to 36 hours. The second parameter is the PR 11
difference (∆PR) between two successive AMSR-E measurements occurring before and after 12
a rainfall event. This parameter can be negative (soil moisture decrease) or positive (soil 13
moisture increase). Usually, ∆PR can from -0.10 to 0.10. Then, a sensitivity study was carried 14
out over the 2004 rainy season to define thresholds (∆tmax and ∆PRmin) in order to obtain 3
15
possible classes for each EPSAT-SG rainfall timestep: 16
17
∆t < ∆tmax and ∆PR > ∆PRmin Rainfall confirmed
18
∆t < ∆tmax and ∆PR < ∆PRmin Rainfall suppressed
19
∆t > ∆tmax Rainfall uncertain
20 21 22 3. Results 23 24
An analysis of the EPSAT-SG rainfall estimates compared with the ground-based rainfall 1
product (considered as the reference product) makes possible to discriminate true rainfall 2
events from wrong rainfall events. In addition, it is possible to detect missed rainfall events, 3
i.e. rainfall events measured exclusively at the ground level. Using this partitioning over the 4
25 pixels of our studied area during the 2006 rainy season, the EPSAT-SG product was found 5
to be composed with 29.96 true rainfall events (out of 44.4), 14.44 wrong rainfall events and 6
0.04 missed rainfall events (see Figure 4). Note that non integer values are due to averaging 7
over 25 pixels (e.g. 0.04 missed rainfall events (1/25) means 1 missed rainfall event over 1 8
pixel and 0 elsewhere). The percentage of wrong rainfall events (32.5 %) is significant but it 9
represents only 15.6 % (53 mm out of 340 mm) of the cumulative EPSAT-SG rainfall 10
estimates, that is to say mostly small rainfall events. It can also be noted that almost 100 % of 11
the reference rainfall events are detected by the EPSAT-SG rainfall product. 12
13
A calibration procedure was performed over the 25 [25x20 km²] pixels of our studied area in 14
Niger to get the best (∆tmax and ∆PRmin) values during the 2004 rainy season. The correction
15
procedure was employed over the 2006 rainy season. In the following, the procedure 16
assessment is based on the number of rainy events. The best correction procedure was 17
obtained using ∆tmax = 36h and ∆PRmin = 0.002. These values are the best compromise
18
between getting the greatest number of true rainfall event (T for True), suppressing the 19
greatest number of wrong rainfall events (W for Wrong) and minimizing the number of 20
missed rainfall events (M for Miss). The optimal (∆tmax, ∆PRmin) corresponds to the largest
21
value of (T-W-M). 22
23
The correction procedure above-mentioned leads to remove 73.7 % of wrong events (the 24
number of wrong events decreases from 14.44 to 3.8). However, the correction procedure also 25
removes true events since the number of true rainfall events decreases from 29.96 to 27.92 1
(i.e. an incorrect elimination of 6.8 % of the true events) leading to a number of missed 2
rainfall events of 2.08 instead of 0.04 without correction. The cumulative rainfall of the 2.08 3
missed rainy events represents 22.3 mm of the reference rainfall estimates (6.6 %). 4
In order to avoid elimination of true rainfall events, a second correction procedure was 5
proposed given more weight to missed events. The obtained values of ∆tmax (12h) and ∆PRmin
6
(0.001) correspond to the largest value of (T-W-2M). The new correction procedure (see 7
Figure 4) leads to remove only 9.28 wrong events (35.7 %) but remove no more than 0.6 true 8
rainy event instead of 2.08 using the first correction procedure. Regarding the cumulative 9
rainfall, 9.28 wrong events represent 42.8 mm of the EPSAT-SG rainfall estimates and 0.6 10
missed event represents 2.3 mm of the reference rainfall estimates (4.7 %). 11
12
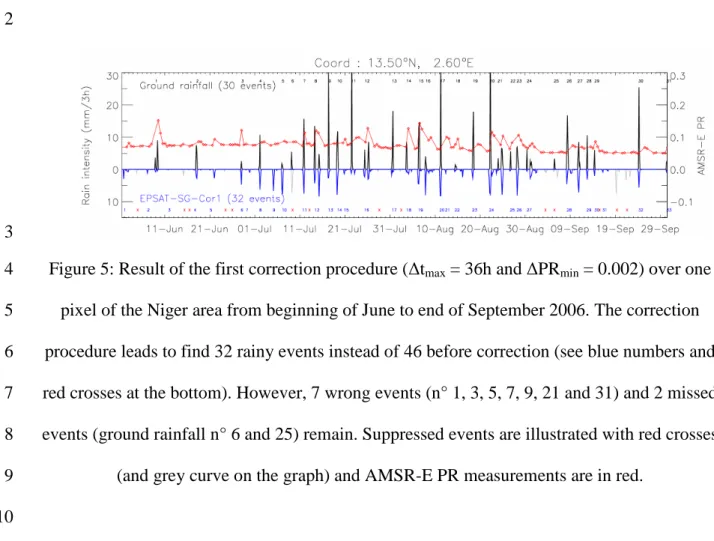
Figure 5 presents the result of the first correction procedure (∆tmax = 36h and ∆PRmin = 0.002)
13
over one of the 25 pixels of the Niger area centred over 13.50°N and 2.60°E during the 2006 14
rainy season. The correction procedure proposes a total number of 32 rainy events instead of 15
46 without correction procedure. An analysis of the corrected rainfall estimates shows that 16
there are 7 wrong rainy events (June 1st, 12th, 21st, 29th, July 5th, August 13th, September 16th) 17
and 2 missed events (July 9th and September 5th). 18
19
4. Conclusion
20
21
This paper describes a simple methodology to use the passive microwave measurements of 22
the 6.9 GHz bandwidth which is the most sensitive to surface soil moisture, provided by the 23
AMSR-E sensor to constrain satellite-based rainfall estimates. The paper focuses on the 24
aptitude of the AMSR-E sensor measurements to inform if rain occurs or not. The study was 25
conducted over 25 [25x20 km²] pixels located in SW Niger where a dense recording 1
raingauge network is available to build an accurate ground-based 3-hour rainfall product at 2
the 25x20 km² resolution (reference rainfall product). A satellite-based rainfall product 3
(EPSAT-SG) was compared to the reference rainfall product at the same spatial and temporal 4
resolution. It was shown that the EPSAT-SG rainfall product overestimates by about 30 % the 5
total number of rainy events during the 2004 and 2006 rainy seasons. A simple methodology 6
based on the AMSR-E polarization ratio variations related to the surface soil moisture leaded 7
to suppress a large amount of the wrong rainfall events. It was also shown that a compromise 8
should be found between an elimination of all wrong rainy events and a suppression of true 9
rainy events. The main limitation was found to be the temporal resolution of AMSR-E 10
microwave measurements which ranges from 12h to 36h. During about 40 % of the time, the 11
delay between a rainfall event and a microwave measurement exceeded 30h. In such cases, 12
the confirmation (or not) of the considered rainfall estimates using the correction procedure 13
was not possible (rainfall events were supposed to be true). Another limitation should be 14
related to the role of the vegetation which is growing from end of July to October. The 15
vegetation cover can also modify the PR variability [Morland et al., 2001]. Nevertheless the 16
correction procedure presented in this paper allows improving the precipitation estimation 17
methods using Infrared techniques for the rain-no rain detection phase. Future works would 18
be devoted to assess the methodology to the whole West Africa region in order to look at the 19
spatial impact of the correction procedure. 20
21
Acknowledgments
22
Based on a French initiative, AMMA was built by an international scientific group and is 23
currently funded by a large number of agencies, especially from France, the UK, the US and 24
Africa. It has been the beneficiary of a major financial contribution from the European 25
Community’s Sixth Framework Research Programme. Detailed information on scientific 1
coordination and funding is available on the AMMA International web site 2 http://www.amma-international.org”. 3 4 5 References 6 7
Ali, A., T. Lebel and A. Amani (2005), Estimation of Rainfall in the Sahel. Part 1: Error 8
Function. J. Appl. Meteorology, 44(11), 1691-1706. 9
Ali, A., T. Lebel, and A. Amani (2003), Invariance in the spatial structure of Sahelian rain 10
fields at climatological scales, J. Hydrometeorol., 4(6), 996-1011. 11
Arkin, P. A., and B. N. Meisner (1987), The relationship between large-scale convective 12
rainfall and cold cloud over the western-hemisphere durind 1982-84, Mon. Weather 13
Rev., 115(1), 51-74.
14
Balme, M., T. Vischel, T. Lebel, C. Peugeot, and S. Galle (2006), Assessing the water balance 15
in the Sahel: Impact of small scale rainfall variability on runoff - Part 1: Rainfall 16
variability analysis, J. Hydrol., 331(1-2), 336-348. 17
Chopin F., Bergès J.C., Desbois M., Jobard I., and Lebel T. "Satellite 18
Rainfall Probability and Estimation. Application to the West Africa 19
During the 2004 Rainy Season" American Geosciences Union, 2005 Joint Assembly 20
New Orleans, USA 23 - 27 May 2005 21
Crow, W. T. & J. D. Bolten (2007), Estimating precipitation errors using spaceborne surface 22
soil moisture retrievals. Geophys. Res. Lett., 34. 23
Grody, N. C. (1991), Classification of snow cover and precipitation using the Special Sensor 24
Microwave Imager, J. Geophys. Res., Vol. 96, pp. 7423-7435. 25
Jobard, I. and M. Desbois (1994), Satellite estimation of the tropical precipitation using the 1
METEOSAT ans SSM/I data. Atmos. Res., 34, pp. 285-298. 2
Jobard, I., F., Chopin, J.C., Bergès A., Ali T., Lebel M. Desbois (2007), The EPSAT-SG 3
method, a comparison with other Satellite Precipitation Estimations in the frame of 4
PrecipAMMA. EGU : Vienna, 17-18 April 2007. 5
Lebel, T., H. Sauvageot, M. Hoepffner, M. Desbois, B. Guillot, and P. Hubert (1992), 6
Rainfall estimation in the sahel - The EPSAT-Niger Experiment, Hydrological Sc. 7
Journal-Journal Des Sciences Hydrologiques, 37(3), 201-215.
8
Morland, J. C., Grimes, D. I. F., Hewison, T. J. (2001), Satellite observations of the 9
microwave emissivity of a semi-arid land surface, Remote Sens. Environ., 77(2), 149-10
164. 11
Njoku, E. G., T. J. Jackson, V. Lakshmi, T. K. Chan, and S. V. Nghiem (2003), Soil moisture 12
retrieval from AMSR-E, IEEE Trans. Geosci. Remote Sens., 41(2), 215-229. 13
Viltard, N., Burlaud, and C. D. Kummerow (2006), Rain retrieval from TMI brightness 14
temperature measurements using a TRMM PR-based database, J. Appl. Meteorol. Clim., 15
45(3), 455-466. 16
Wigneron, J. P., J. C. Calvet, T. Pellarin, A. A. Van de Griend, M. Berger, and P. Ferrazzoli 17
(2003), Retrieving near-surface soil moisture from microwave radiometric observations: 18
current status and future plans, Remote Sens. Environ., 85(4), 489-506. 19
1
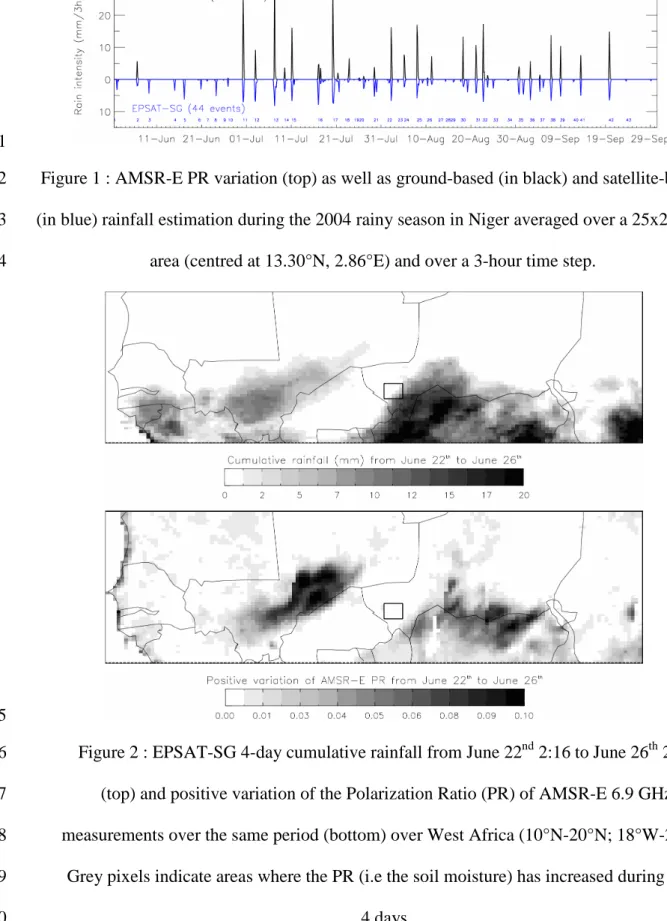
Figure 1 : AMSR-E PR variation (top) as well as ground-based (in black) and satellite-based 2
(in blue) rainfall estimation during the 2004 rainy season in Niger averaged over a 25x20 km² 3
area (centred at 13.30°N, 2.86°E) and over a 3-hour time step. 4
5
Figure 2 : EPSAT-SG 4-day cumulative rainfall from June 22nd 2:16 to June 26th 2:16 6
(top) and positive variation of the Polarization Ratio (PR) of AMSR-E 6.9 GHz 7
measurements over the same period (bottom) over West Africa (10°N-20°N; 18°W-20°E). 8
Grey pixels indicate areas where the PR (i.e the soil moisture) has increased during these 9
4 days. 10
1
2
3
4
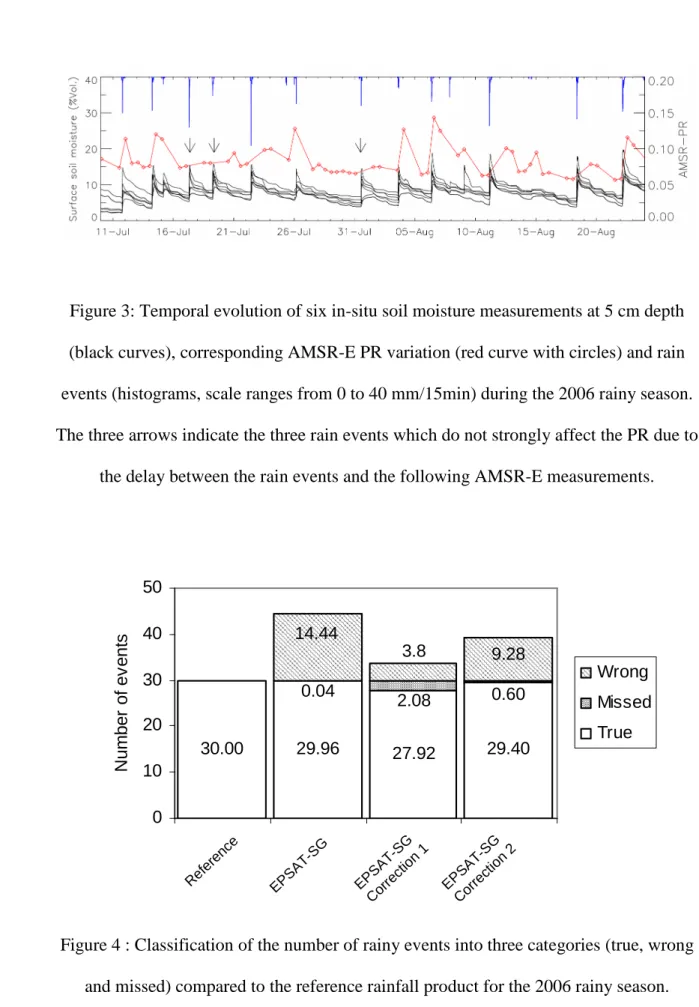
Figure 3: Temporal evolution of six in-situ soil moisture measurements at 5 cm depth 5
(black curves), corresponding AMSR-E PR variation (red curve with circles) and rain 6
events (histograms, scale ranges from 0 to 40 mm/15min) during the 2006 rainy season. 7
The three arrows indicate the three rain events which do not strongly affect the PR due to 8
the delay between the rain events and the following AMSR-E measurements. 9 10 30.00 29.96 27.92 29.40 0.60 0.04 2.08 3.8 14.44 9.28 0 10 20 30 40 50 1 2 3 4 N u m b e r o f e v e n ts Wrong Missed True EPSA T-SG Ref eren ce EPSA T-SG Cor rect ion 1 EPSA T-SG Cor rect ion 2 30.00 29.96 27.92 29.40 0.60 0.04 2.08 3.8 14.44 9.28 0 10 20 30 40 50 1 2 3 4 N u m b e r o f e v e n ts Wrong Missed True EPSA T-SG Ref eren ce EPSA T-SG Cor rect ion 1 EPSA T-SG Cor rect ion 2 11
Figure 4 : Classification of the number of rainy events into three categories (true, wrong 12
and missed) compared to the reference rainfall product for the 2006 rainy season. 13
1
2
3
Figure 5: Result of the first correction procedure (∆tmax = 36h and ∆PRmin = 0.002) over one
4
pixel of the Niger area from beginning of June to end of September 2006. The correction 5
procedure leads to find 32 rainy events instead of 46 before correction (see blue numbers and 6
red crosses at the bottom). However, 7 wrong events (n° 1, 3, 5, 7, 9, 21 and 31) and 2 missed 7
events (ground rainfall n° 6 and 25) remain. Suppressed events are illustrated with red crosses 8
(and grey curve on the graph) and AMSR-E PR measurements are in red. 9