HAL Id: hal-01458009
https://hal.archives-ouvertes.fr/hal-01458009
Submitted on 6 Jun 2020
HAL is a multi-disciplinary open access
archive for the deposit and dissemination of sci-entific research documents, whether they are pub-lished or not. The documents may come from teaching and research institutions in France or abroad, or from public or private research centers.
L’archive ouverte pluridisciplinaire HAL, est destinée au dépôt et à la diffusion de documents scientifiques de niveau recherche, publiés ou non, émanant des établissements d’enseignement et de recherche français ou étrangers, des laboratoires publics ou privés.
Vertical distributions of Cs-137 in soils: a meta-analysis
Marianna Jagercikova, Sophie Cornu, Christine Le Bas, O. Evrard
To cite this version:
Marianna Jagercikova, Sophie Cornu, Christine Le Bas, O. Evrard. Vertical distributions of Cs-137 in soils: a meta-analysis. Journal of Soils and Sediments, Springer Verlag, 2015, 15 (1), pp.81-95. �10.1007/s11368-014-0982-5�. �hal-01458009�
SOILS, SEC 2 • RESEARCH ARTICLE 1
2
Vertical distributions of 137Cs in soils: a meta-analysis 3
4
Marianna Jagercikova • Sophie Cornu • Chrsitine Le Bas • Olivier Evrard 5
6
M. Jagercikova • S. Cornu () 7
INRA, UR1119 Géochimie des Sols et des Eaux, 13100 Aix en Provence, France e-mail: 8 [email protected] 9 10 C. Le Bas 11
INRA, US 1106 Infosol, 45075 Orléans, France 12
13
O. Evrard 14
LSCE, UMR8212 CEA-CNRS-UVSQ, Domaine du CNRS, 91198 Gif-sur-Yvette Cedex, 15 France 16 17 18 () Corresponding author: 19 Sophie Cornu 20 Tel: +33 ø4 42 97 17 96 21 Fax: +33 ø4 42 90 85 17 22 e-mail: [email protected] 23 24
Abstract
25
Purpose. The vertical distribution of 137Cs – an artificial fallout radionuclide – is controlled
26
by soil characteristics and processes that may differ among soil groups. The application of a 27
single modelling approach to large number of soil profiles provides an original contribution to 28
the literature and allows for comparison between these different soil groups. 29
Materials and methods. In order to quantify 137Cs migration in soils, we compiled and
30
modelled depth-distributed data documented in the literature between 2000–2012. The 31
resulting database comprised ninety-nine 137Cs profiles sampled in fourteen soil groups of the
32
World Reference Base (WRB) classification (FAO 1998) under different land uses or covers 33
and collected at various geographical locations in the Northern hemisphere between 1992 and 34
2007. 35
Results and discussion. The 137Cs profiles were classified in seven different categories
36
according to the shape and location of radiocaesium peak. Depth of the latter ranged between 37
0 and 12 cm (median of 2 cm) and maximal penetration of cesium reached from 12 to 60 cm. 38
The 137Cs depth distributions in these soils were fitted using a diffusion-convection equation
39
to allow comparison between different soil groups. Diffusion coefficients ranged from 0.02 to 40
4.44 cm2 yr-1 in soils (median of 0.64 cm2 yr-1); and convection velocities varied from 0 to
41
0.74 cm yr-1(median of 0.1 cm yr-1). The model underestimated 137Cs concentrations by a
42
median value of 1.9% of the total inventory in soil samples collected below 13 cm depth. 43
Conclusions. Global 137Cs penetration velocities ranged from 0.05 to 0.76 cm yr-1 (median of
44
0.28 cm yr-1) over a 25-year period. In future, the model could be improved to better simulate
45
deep penetration of Cs. Our results showed that modelling 137Cs depth profile with a
46
diffusion-convection equation allowed estimating the bioturbation and clay translocation 47
velocity in a certain number of soil groups. This quantification is crucial as these processes 48
partially control the development of soil surface characteristics and several soil services. 49
50
Keywords Bioturbation • Clay translocation • Diffusion-convection equation • Fallout 51
radionuclides • Numerical modelling • Pedogenesis 52
1 Introduction 54
Ceasium-137 is characterised by a strong affinity for fine soil particles and is therefore widely 55
used to quantify soil erosion at the plot and hillslope scales (Ritchie and Ritchie 2007), but it 56
is also employed to quantify the relative contribution of sources delivering sediment to rivers 57
(Ben Slimane et al. 2013). However, its ability to trace vertical transfers of solid matter in 58
soils was much less investigated. Despite the importance of these transfers in controlling the 59
soil surface characteristics, the occurrence and the velocity at which those transfers operate 60
are still poorly understood and quantified. To this end, measurement of tracers that are 61
strongly bound to the solid phase and that were absent from the parent material before the 62
start of pedogenesis along soil profiles could provide relevant information to improve our 63
knowledge on those processes. 64
Although some limitations to this method exist (e.g. Parsons and Foster 2011), caesium-137 65
fulfils both conditions. It was released into the atmosphere by the nuclear weapon tests or, 66
more recently, by nuclear accidents like Chernobyl or Fukushima. Soils may therefore be 67
considered as free of this isotope prior to the first nuclear weapon tests in 1953. During the 68
nuclear weapon tests, from the 1950s to the 1970s, 137Cs was mixed in the stratosphere and its
69
deposition pattern to the terrestrial surface, referred to as global fallout, reflects the 70
atmospheric circulation and its latitude-dependence (UNSCEAR 1982). In contrast, 137Cs
71
atmospheric deposits after nuclear accidents displayed locally heterogeneous spatial patterns, 72
mostly depending on the weather conditions that prevailed shortly after the emissions 73
(Chartin et al., 2013; Korsakissok et al. 2013). As a result of the combination of wet and dry 74
fallout, 137Cs is delivered to the soil surface, and it may then migrate in depth at a rate
75
depending on processes controlling this transfer and soil characteristics. 76
These characteristics control the fixation of 137Cs on solid phases. Caesium-137 was shown to
77
be fixed on soil constituents such as micaceous clay minerals (Tamura and Jacobs 1960; 78
Sawhney 1972; Konoplev et al. 1996; Bunzl et al. 1998), bearing Frayed Edge Sites (FES) 79
which are specific sites for caesium sorption (Cremers et al. 1988). According to 80
Vandenbroek et al. (2012), surface layers of most soils found across the world were shown to 81
have a high selectivity for caesium adsorption, with the exception of Oxysols, Podzols and 82
Andosols that are depleted in micas. Regarding the other soil types, Gil-Garcia et al. (2009) 83
found high solid/liquid distribution coefficients (Kd) for caesium with mean Kd values of 530
84
L kg-1, 5 500 L kg-1 and 3 500 L kg-1 for sandy, clayey and loamy soils respectively. Under
85
these conditions, transport of caesium in dissolved form may be considered negligible after 86
the initial fixation of this radionuclide onto mineral soil particles (Elshamy et al. 2007; Jarvis 87
et al. 2010; Matisoff et al. 2011). Consequently, over the long-term, radionuclides are mainly 88
transported along hillslopes with soil particles (Müller-Lemans and van Dorp, 1996; Turner et 89
al. 2006). In this context, the presence of artificial fallout radionuclides in depth can be 90
interpreted as resulting from a particle-borne transfer due to clay migration or to a physical 91
mixing by turbation including bioturbation processes (Müller-Lemans and van Dorp 1996; 92
VandenBygaart et al. 1998; Ireson and Butler 2009). Nevertheless organic soils containing 93
more than 20 % of organic matter were shown to have a relatively lower Kd value (mean of
94
270 L kg-1) (Gil-Garcia et al. 2009). In these soils, a significant contribution of solute transfer
95
of 137Cs that may be associated with DOC cannot be ruled out (AIEA 2010).
96
Finally, the relatively short half-life of 137Cs (T
1/2=30 yr) is particularly relevant for
97
investigating processes occurring at decadal scales (Kaste et al. 2007). Although soil 98
formation occurs over much longer periods, individual pedological processes may be 99
characterised by temporal variations with a succession of active and inactive periods 100
throughout the entire story of soil development. The use of 137Cs as a tracer provides therefore
101
a relevant tool to understand and quantify those variations during the last 50 years. 102
Most approaches that aimed to quantify the migration velocities of fallout radionuclides in 103
soils solved the diffusion-convection equation (e.g. Bossew and Kirchner 2004; Schuller et al. 104
2004; Schimmack and Márquez 2006), using either analytical or numerical solutions (Smith 105
and Elder 1999; Bunzl et al. 2000; Bossew and Kirchner 2004). 106
In this study, we aimed at quantifying the kinetics of vertical transfers of 137Cs in soils
107
depending on their characteristics and the relative contribution of processes controlling this 108
transfer in soils. To this end, we modelled the vertical distributions of 137Cs fallout along soil
109
profiles documented in the literature. 110
111
2 Materials and methods 112
2.1 Database description 113
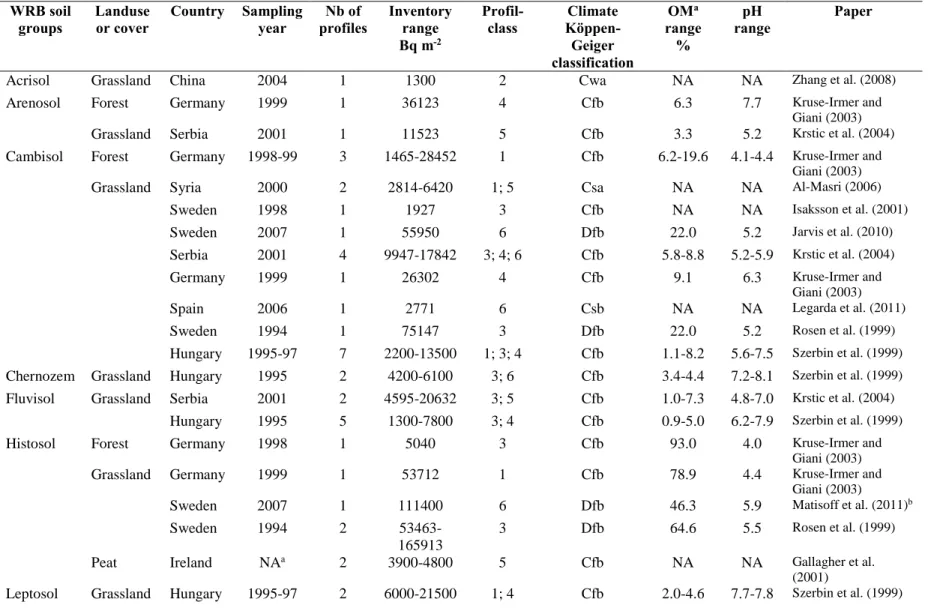
The database compiles 99 profiles with detailed evolution of 137Cs activities with depth
114
retrieved from 17 publications published before 2013 (Table 1, detailed information is 115
provided in the Electronic Annex A). We restricted our work to the investigations mentioning 116
the soil group of the studied profiles. This reduced considerably the amount of relevant 117
studies among the hundreds of studies dedicated to 137Cs in soils that have been continuously
118
published since the mid-1990s (Ritchie and Ritchie 2007). Land use or cover, altitude, annual 119
precipitation, sampling date and pedological data such as pH and organic matter content were 120
compiled when available. The depth of maximum 137Cs concentration and the maximum
121
depth reached by 137Cs were also collected.
122
In these studies, 137Cs data were expressed in different units: Bq kg-1 (direct measurement of
123
137Cs activity in gamma spectrometry - 85 % of observations), Bq cm-3 (137Cs activity per
124
volume of soil, which requires multiplying the values in Bq kg-1 by the bulk density – 2 % of
125
observations), Bq cm-2 (inventory per layer, which requires multiplying the values in Bq cm-3
126
by the sample thickness – 7 % of observations), or percentage of the total inventory % Bq cm
-127
2 (inventory per layer divided by the total inventory - 6 % of observations). All 137Cs data
were therefore converted into Bq cm-3 to facilitate modelling. Several pedotransfer functions
129
exist to estimate soil bulk density (De Vos et al. 2005). However, they are generally based on 130
the measurements of organic matter content or particle-size distributions and these data were 131
not available in most of the compiled studies. We therefore derived a relationship between 132
this parameter and the soil depth from the values available for 13 soil profiles. ). However, 133
We determined the duration between soil sampling and publication (mean of four years with a 134
standard-deviation of 1 year). Therefore, when not available (6 profiles), the sampling date 135
was estimated as the publication date minus 4 years. 136
Soil groups were given according to different classifications (WRB in 38 % of studies (FAO, 137
1998); Soil Taxonomy in 36 % of studies (Soil Survey Staff 1999) and national classification 138
systems in the remaining studies). To allow for comparison, all soil groups were reclassified 139
according to the WRB system (FAO 1998). Among the 30 main soil groups of the WRB 140
classification, only 14 soil groups were represented in the database (Table 1). 141
The studies were conducted in 12 countries from the Northern Hemisphere that were 142
submitted to different levels of 137Cs contamination due to the Chernobyl accident, which
143
resulted in a large variability in 137Cs inventories (Table 1).
144
Soil profiles were collected under different land uses or covers, i.e. grassland (56 % of the 145
cases), woodland (25 % of the cases), peatland (2% of the cases), cropland (4% of the cases), 146
and land use or cover was not specified in 13 % of the cases. In the latter case, the sites were 147
described as undisturbed and we hypothesised that they were under grassland. 148
Most studies restricted sampling to the uppermost 20-cm layer (87 %). However, in 79 % of 149
the cases, the deepest sample had 137Cs non-null concentration. The inventories estimated by
150
the authors were therefore probably underestimated. 151
In some studies, only three samples were analysed along the profile. The modelling approach 152
was therefore not applicable to such a small number of samples and these soil profiles were 153
removed from further analysis (16 profiles). We did not model 137Cs distribution in the
154
profiles located under cropland, as our model did not take tillage processes into account. 155
156
2.2 Modelling of radionuclide vertical distributions 157
The migration of fallout radionuclides in soils is often described using the diffusion-158
convection equation (e.g. He and Walling 1997; Schuller et al. 1997): 159
(1)
160
With A- the total 137Cs activity per volume of soil (Bq m-3; obtained by multiplying the 137Cs
161
activity in Bq kg-1 by the soil bulk density), z- the soil depth (m), t- the time (s), D s- the
162
diffusion coefficients (m2 s-1), v
s- the convection velocity (m s-1), - the radioactive decay
163
constant (s-1). The diffusion coefficients D
s and the convection velocity vs were considered as
164
spatially and temporally constant in this study. This is an over-simplification, as we know that 165
mixing processes and vertical transfers in soil may vary in both time and depth. However, we 166
considered that intensity of these processes remained constant during the last decades. 167
In the model, 137C is given as a bulk concentration, hypothesising that 137Cs is evenly
168
distributed within the soil mass of the considered layer. However, as 137Cs is mainly deposited
169
as the result of wet fallout, its distribution is heterogeneous in soils and depends on soil 170
structure, macropore distribution and preferential flow (Bundt et al. 2000). Furthermore, it 171
evolves throughout time due to the occurrence of wetting/drying cycles and bioturbation, and 172
it depends on the soil moisture content at the time of deposition. Therefore, we acknowledge 173
that 137Cs distribution in soils may be more complex than modelled in our study.
174 175
2.2.1 Boundary conditions
176
At the soil surface, we applied a boundary condition with a pulse-like input of radionuclides. 177
This pulse-like input was obtained by multiplying the annual fallout deposition a0(t') in Bq
m-2 of the considered year t’ by a Dirac delta function a(0, t') = a
0(t')(t-t'):
179
(2)
180
Isotopes were delivered to the surface, at z=0, annually and input time-series were dealt as a 181
time-dependent boundary condition, i.e. A(0, t') =A(0, t'-1)+a0(t') (t-t').
182
The annual global fallout input aGF(t') followed the distribution calculated by Cambray et al.
183
(1989) for various locations across the Northern Hemisphere, with a total fallout 184
accumulation of 3018 Bq m-2 before the Chernobyl accident in 1986. The global fallout was
185
latitude-dependent and it was reconstructed based on 90Sr fallout recorded by UNSCEAR
186
(1982) in different latitudinal bands (Table 2). As the 137Cs/90Sr ratio was constant over time
187
(1.6 for global bomb fallout), 137Cs fallout (Table 2) was deducted from 90Sr measurements.
188
With respect to the total fallout accumulation of Cambray et al. (1989), we defined a weighted 189
factor maximum rth as a function of the latitudinal position of the sampled site (Table 2).
190
Therefore global fallout contribution was determined as the product of the weighted factor r 191
and the annual global fallout aGF (3). In the model, the weighted factor r was allowed to vary
192
between 0 and the maximal weighted factor rth of the latitudinal band in which the sampling
193
site was located (Table 2). The factor r was considered as an unknown variable and was 194
estimated by the model for each profile. As 137Cs input due to the Chernobyl accident (a Ch)
195
strongly varied across space, it was also considered as an unknown variable and was 196
estimated by the model. Hence, the temporal input variations were described as follows: 197
(3)
198
We applied as lower boundary condition (at 200 cm) an advective transport free of diffusion 199
in order to avoid spurious accumulation of radionuclides and not to influence the numerical 200
solution within the first 100 cm. 201
202
2.2.2 Discretization and resolution of the equation
203
We solved the differential Eq. (1) using upwind finite differences approximation for spatial 204
derivatives and semi-implicit Crank-Nicholson scheme as a time-solver. The obtained 205
algebraic system of equations was solved by Gaussian elimination. All the simulations started 206
in 1954 and finished on the sampling year. Time-step was equal to 0.01 year. The accuracy of 207
the numerical solution was verified by comparison with the analytical solution (4) obtained 208
with similar initial and boundary conditions: 209
(4) 210
with a simple pulse-like input (a0(t)(t)) into a semi-infinite domain and a zero-concentration
211
when z∞. 212
213
2.2.3 Non-linear least square minimization procedure
214
The unknown parameters (Ds, vs, r, aCh) and their standard deviations were determined with a
215
non-linear least-square minimization procedure based on the Levenberg-Marquardt algorithm 216
included in Python lmfit package. The minimized value for each measurement Am (in Bq cm-3)
217
was calculated in an integral form, which provided a way to take different sampling intervals 218
into account (Bossew and Kirchner, 2004): 219
(5)
220
In order to estimate the performance of the fitting procedure, we calculated residual sum of 221
squares (RSS) for N sampled layers and modelling efficiency (EF): 222
(6)
(7) 224
The first simulation was run to fit all 4 parameters (Ds, vs, r, aCh). If the resulting model
225
parameters remained in the range of possible values (0 < r ≤ rth, 0 ≤ aCh), the simulation was
226
retained as the best fit. Otherwise, we added the following assumptions: aCh = 0 if the
227
sampling site was located in a region spared by Chernobyl deposits and raGF = 4 527 Bq m-2
228
(the maximum global fallout input) if the model attributed larger global fallout input than 229
expected, which was often the case for the sites characterised by high levels of Chernobyl 230
contamination. All sites affected by soil erosion or soil accumulation were excluded from the 231
database for further analysis, and these processes were therefore not simulated by the model. 232
233
3 Results and discussion 234
3.1 Soil bulk density within the uppermost 20 centimetres of the soil: evolution and 235
estimation 236
Bulk densities reported in the literature for 13 soil profiles ranged from 0.6 to 1.41 g 237
cm-3 at 5-cm-depth and from 0.9 to 1.47 g cm-3 at 20-cm-depth. The mean bulk density of
238
these 13 soil profiles evolved with depth following a logarithmic function (Fig. 1a; eq. 8): 239
(8)
240
with depth z expressed in cm. For the considered soil profiles, C1 was equal to 0.1636 and C2
241
to 0.7329 (R2=0.94).
242
We considered a comparable evolution of the bulk density in depth for the other profiles, with 243
the same C1 value, whereas C2 was estimated in order to fit the total 137Cs inventory (I)
244
considering the depth evolution of the activities of 137Cs in Bq kg-1, using the minimization
245
equation (9): 246
(9) 247
In order to check the accuracy of the obtained predictive model, bulk densities were estimated 248
for the soil profiles for which these data were available (Fig. 1b). We obtained a reasonable 249
estimation of the bulk density in samples close to the surface, but the density was 250
underestimated by the model below 10 cm depth. However, as only a small proportion of the 251
137Cs was located at this depth, the impact of bulk density underestimation on 137Cs vertical
252
distribution was considered to be negligible. 253
The model was applied to the 48 soil profiles for which bulk density data were not available 254
(Electronic Annex A). C2 varied between 0.37 and 2.53. Eighty percent of the mean bulk
255
density of the 0-20 cm layer - estimated by the predictive model - ranged from 0.94 to 256
1.66 g cm-3, with a median value of 1.22 g cm-3. The estimated soil bulk densities were
257
considered as irrelevant in 5 profiles compared to the values classically found in soils. In 258
addition, negative values were obtained in 4 profiles. They were therefore not considered in 259 further analysis. 260 261 3.2 Cs-137 distributions in soils 262
The recorded 137Cs inventories (decay-corrected for 2013) ranged from 697 Bq m-2 to 107 200
263
Bq m-2. The highest inventories were measured in soils collected in the areas severely
264
contaminated by Chernobyl fallout in central Europe and Sweden as documented in the atlas 265
of Chernobyl contamination (De Cort et al. 1998). The depth of the maximum concentration 266
(zmaxC) ranged between 0 and 12 cm (with a median value of 2 cm) and the maximal
267
penetration depth (i.e. with a 137Cs concentration higher than or equal to 0.001 Bq cm-3)
268
ranged between 12 cm and 60 cm. Width of the peak (estimated as Half Width at Half 269
Maximum (HWHM)) ranged between 1.25 and 13.7 cm (median of 5 cm). We could not 270
identify any clear relationship between the soil groups and the depth of maximum 271
concentration, maximum depth or width of the peak. 272
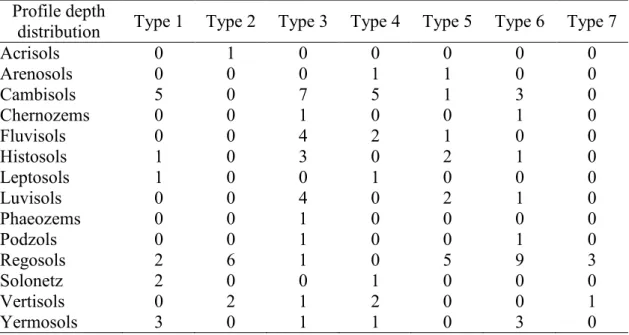
Based on the depth of maximum 137Cs concentration, the width of peak and the shape of
273
radiocesium profile, we determined 7 classes of depth distribution profiles (Fig. 2): 274
1- Continuous decrease in the concentrations with depth (zmaxC = 0 cm and HWHM ≤ 5 cm -
275
13 profiles); 276
2- Half bell-shaped curve with maximum concentration at the soil surface. The concentrations 277
decrease with depth following a Gaussian-like shape (zmaxC = 0 cm and HWHM > 5 cm - 10
278
profiles); 279
3- Narrow hump-shaped curve at shallow depth with a maximum concentration comprised 280
between 0 and 2 cm depth (0 < zmaxC ≤ 2 cm and HWHM ≤5 cm - 25 profiles);
281
4- Wide hump-shaped curve shape at shallow depth with a maximum concentration within the 282
0-2 cm depth interval (0 < zmaxC ≤ 2 cm and HWHM > 5 cm - 13 profiles);
283
5- Narrow hump-shaped curve with maximum concentration deeper than 2 cm (zmaxC > 2 cm
284
and HWHM ≤ 5 cm - 12 profiles); 285
6- Wide hump-shaped curve with maximum concentration deeper than 2 cm (zmaxC > 2 cm and
286
HWHM > 5 cm - 18 profiles);
287
7- Constant isotopic profile concentration over depth (4 profiles). 288
289
As 137Cs fate in the soil depends on the soil characteristics and processes, 137Cs depth
290
distribution should be a function of the soil groups. It was however not the case (Table 3). 291
Other factors may influence the distribution profile such as the duration since the 137Cs input
292
or the climate conditions. 293
VandenBygaart et al. (1998), Tyler et al. (2001), Bunzl (2002), Kaste et al. (2007), Elshamy 294
et al. (2007), Ireson and Butler (2009), Jarvis et al. (2010) and Matisoff et al. (2011) 295
demonstrated the impact of bioturbation on radionuclide redistribution in soil profiles. The 296
importance of bioturbation may be estimated from the width of the peak: highly active 297
bioturbation leads to wider shaped curves. We would thus expect stronger bioturbation in the 298
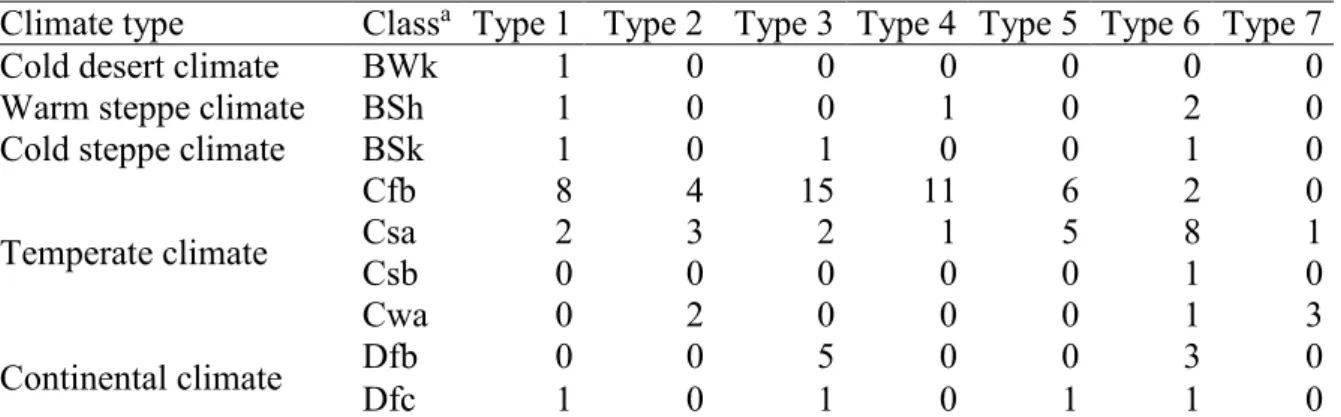
profile types 2, 4, 6 than in profile types 1, 3, 5. As bioturbation depends on the mean annual 299
temperature, it should be more intense under warm climates than under cold or dry climates. 300
Table 4 shows the climate distribution for the different profile types as it was determined 301
from the location of the sampling site and the climate classification according to Kottek et al. 302
(2006). However, depth distribution profiles 2, 4, 6 were not more frequent under warm 303
temperate and humid climates (C classes of Köppen’s climate classification, 32 profiles out of 304
69), than under dry or cold climates (B and D classes of Köppen’s climate classification; 8 out 305
of 20). Land use or cover may also impact the 137Cs distribution. Most of the type-1
306
distribution profiles corresponding to Cambisols were collected under forests whereas 307
peatlands corresponded to type 5 (n = 2). All the cultivated plots were attributed to type 7 308
(n = 4). 309
The soil profiles were sampled between 1992 and 2007. The classification of different soils of 310
a same soil group according to different depth-profile types may be explained by the temporal 311
evolution of the initial profile. Indeed, after 137Cs inputs, the peak progressively migrates in
312
depth, and its distribution profile will widen with time depending on the turbation rate. This 313
evolution will nevertheless depend on the time elapsed after the main 137Cs input that may
314
either be due to the bomb tests or to the Chernobyl accident depending on the site. This 315
probably explains why we could not find any relationship between 137Cs depth profiles and
316
the sampling dates. In addition, for similar sampling dates, classification according to 317
different profile shapes may originate from differences in values of diffusion coefficient (Ds
318
in cm2 yr-1) and convection velocity (v
s in cm yr-1): profile type 1 being obtained for Ds > 0
319
and vs ≈ 0; profile type 2 for Ds >> 0 and vs ≈ 0; profile type 3 for Ds > 0 and vs > 0; profile
320
type 4 for Ds >> 0 and vs > 0; profile type 5 for Ds > 0 and vs >> 0; and profile type 6 for Ds
>> 0 and vs >> 0. The profiles belonging to class 7 result either from a disturbance or from a
322
mixing of the entire profile that may have been achieved by agricultural practices such as 323
tillage. 324
As a conclusion, the 137Cs profile type is a complex result of the variations in soil processes
325
affecting the diffusion and convection transport and resulting in contrasted temporal 326
evolutions. 327
328
3.3 Diffusion and convection in soils 329
3.3.1 Overall quality of the simulation results
330
We have simulated the evolution of 71 profiles out of the 99 profiles compiled in the database 331
(detailed results are provided in the Electronic Annex A and B). We have excluded 4 332
cultivated profiles, 4 profiles with thick organic horizons containing more than 30 % of the 333
total 137Cs inventory, 4 profiles with unrealistic bulk density values and 16 profiles with only
334
3 measurements per profile, which was insufficient for optimizing the 4 required parameters. 335
Overall, modelling efficiency (EF) reached a mean of 0.89 ± 0.20, and a median of 0.96 336
(max(EF) = 1), which is fairly good. The comparison between simulated and observed 137Cs
337
concentrations in all profiles showed a reasonable agreement with some underestimation at 338
low concentrations (Fig. 3). Scaled residuals as a function of 137Cs concentrations were
339
normally distributed. However, when considered as a function of depth (Fig. 4), residuals 340
were normally distributed and centred at zero in the first 13 cm only. They shifted towards 341
positive values below 13 cm and they were all positive below 30 cm. This demonstrates that 342
the model underestimated 137Cs concentrations in most samples collected below 13 cm and
343
that it underestimated all values below 30 cm. 344
Finally, vs was null for 23 profiles. These profiles exhibited large standard deviation values
345
for all parameters. The model could therefore not differentiate the inputs due to global fallout 346
range of values. 348
349
3.3.2 Estimation of global fallout
350
We have compared the global fallout raGF values optimized by our model to the range of
351
fallout estimations provided by UNSCEAR (1982) for different latitudes (Table 2). In 59 % of 352
the cases, the modelled global fallout values were equivalent to the values estimated by 353
UNSCEAR (1982), but they were lower in the remaining 41% of the sites. However, the 354
values estimated by UNSCEAR (1982) may have been affected by other local factors such as 355
rainfall. As an example, Cambray et al. (1989) provided lower values of global fallout 356
compared to UNSCEAR (1982) for regions located in the 40-50°N band. Furthermore, 357
extremely low values of global fallout were obtained for the sites located in arid regions in 358
Syria, reaching even zero at several places (4 sites). The lower fallout obtained in this region 359
compared to those estimated by UNSCEAR (1982) probably reflects the absence of 360
precipitations (Aoyama et al. 2006). 361
The occurrence of soil erosion between the end of 1960s and Chernobyl accident may also 362
explain the lower values of global fallout obtained for several profiles. However, no data 363
(such as the history of land use or cover of the corresponding sites) were available to verify 364
this hypothesis. In addition, erosion was probably very limited at these sites, since they were 365
generally covered by vegetation (forest, grassland) and were therefore considered as 366
undisturbed. 367
For three Swedish sites located between 62 and 64°N, the use of the global fallout of the 50-368
60°N band with higher fallout rates improved the modelling efficiency compared to the one 369
obtained when taking values of the 60-70° band. Similarly, Sigurgeirsson et al. (2005) 370
reported that 137Cs deposition was underestimated for 60-70° N band by UNSCEAR (1982) in
371
Icelandic soils. We observe the same phenomena for Chinese sites at 29°N, showing that the 372
latitude parallels defining the limit between two bands should be rather considered as buffer 373
(transition?) zones. 374
Overall, differences between observed and simulated global fallout may be explained by: (i), 375
a virtual absence of fallout because of the lack of precipitation in arid regions (as it was 376
probably the case in Syria); (ii), the possible occurrence of soil erosion between the end of 377
1960s and Chernobyl accident. 378
379
3.3.3 Possible mechanisms behind D and v
380
Diffusion coefficient is widely used to estimate bioturbation in the literature (e.g. Elzein and 381
Balesdent 1995; Schiffers et al. 2011). Bioturbation in soil is due to the activity of micro- and 382
macro-organisms. Under temperate climates, it is mainly controlled by earthworm activity 383
(Wilkinson et al. 2009). However, diffusion coefficient only represents a local mixing, 384
whereas a non-negligible part of bioturbation may be due to non-local feeder earthworm 385
species (Jarvis et al. 2010; Schiffers et al. 2011). As the diffusion coefficient is unable to 386
simulate this non-local behaviour, alternative models were developed (Müller-Lemans and 387
van Drop, 1996; Schiffers et al. 2011). A non-local mixing term was integrated into the 388
general diffusion-convection equation (Jarvis et al. 2010), which improved the simulations of 389
deep penetration of 137Cs. The transfer function describing the behaviour of non-local feeders
390
requires the implementation of other parameters (i.e. ingestion rate of non-local feeders, depth 391
of ingestion), which were calibrated by Jarvis et al. (2010) for their field-site based on an 392
ecological study of anecic and endogeic earthworm species (i.e., classical non-local feeders in 393
temperate soils). As such data were not available for the study sites, we could not model the 394
behaviour of non-local feeders. However, Jarvis et al. (2010) showed that estimating 395
bioturbation with a diffusion coefficient fits reasonably well with 137Cs profiles, although it
396
underestimates concentrations at depth. 397
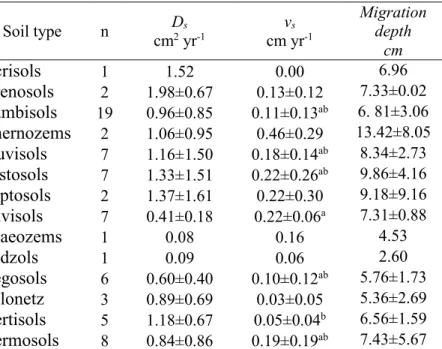
The simulated diffusion coefficients Ds ranged from 0.02 to 4.44 cm2 yr-1 (median of 0.64 cm2
398
yr-1). Among the profiles compiled in our database, modelling had already been conducted on
399
35 soils using different methods for solving the diffusion-convection equation (Szerbin et al. 400
1999; Krstic et al. 2004; Schimmack and Márquez 2006; Zhang et al. 2008; Legarda et al. 401
2011). These studies obtained a median Ds value of 0.53 cm2 yr-1, which is slightly different
402
from our findings. However, this discrepancy may be explained by the inclusion of ca. 40 403
additional profiles in our study, which may have enlarged the range of Ds values in soils.
404
These Ds values were the highest for depth-distribution type 4 (mean of 1.4 cm2 yr-1). Then,
405
they were higher for depth distribution types 2, 3, and 6 (mean ranging from 0.8 to 1.3 cm2 yr
-406
1) than for depth distribution types 1 and 5 (mean of 0.5 cm2 yr-1; ANOVA with a Fisher test
407
at 5 % level of confidence). 408
We could not observe any significant difference in Ds values as a function of land use or
409
cover, the time elapsed after the main 137Cs input, soil group or the climate type.
410
One of the difficulties associated with our approach is that Ds may account for both a
411
diffusion process and a dispersion of the convection velocities when the convection operates. 412
Therefore, a correlation between both parameters may indicate that Ds is not exclusively
413
linked to bioturbation but that it is also affected by convection processes. However, we did 414
not observe any correlation between Ds and either the precipitation or vs when considering the
415
entire set of profiles. When the different soil groups were considered separately (Fig. 5), Ds
416
remained independent from vs in Luvisols and Regosols, whereas in Yermosols, a positive
417
linear relationship was observed between Ds and vs (Ds = 4.13vs + 0.08, R2 = 0.84, n = 8). This
418
relationship suggested that an important dispersive effect exists in Yermosols with increasing 419
convection velocity. The relatively high Ds values observed in this soil group under a dry
420
climate are therefore likely due to the convection process occurring in these soils and not to 421
bioturbation, which is probably low under dry climate conditions. In Cambisols, i.e. the most 422
documented soil group (n = 19), three trends between Ds and vs were observed: a variable
423
diffusion at zero-velocity, a slight dispersion with increasing vs and a high dispersion.
424
Although they were not significantly different, Ds values lower than 0.2 cm2 yr-1 were
425
generally found either in the soils experiencing podzolization or gleization (Spodic Dystric 426
Cambisols, Hypogleyic Cambisols, Podzols, Gleyic Phaeozems) or in soils collected in 427
Northern regions (latitude > 60°N with the exception of a Histosol profile sampled in Hille, 428
Sweden). Soils of the first group were acidic and thus unfavourable to bioturbing organisms, 429
whereas in the second group bioturbation was limited because of the cold climate conditions. 430
In Cambisols and Regosols, Ds increased with soil pH (R of 0.50 for n = 13 in Cambisol). For
431
the other soil groups, the soil pH data were too scarce to draw any conclusion. Finally, the 432
high Ds values obtained for Chernozems and Vertisols may be due to the occurrence of
433
specific pedological processes in these soils (organic matter diffusion and turbation via 434
shrinking and swelling, respectively), rather than to bioturbation (Table 5). 435
The vs coefficient can be considered as representative of the transfer of 137Cs that was either
436
adsorbed on the clay surface - and that may therefore reflect clay translocation-, or that was 437
dissolved in organic rich soils. In this study, vs ranged from 0 to 0.74 cmyr -1 (median of 0.1
438
cm yr-1). These values were of the same order of magnitude as those obtained for the 35
439
profiles that were previously modelled in the literature (Szerbin et al. 1999; Krstic et al. 2004; 440
Schimmack and Márquez 2006; Zhang et al. 2008; Legarda et al. 2011). The vs values ranked
441
as follows from the highest to the lowest: types 5 and 6 (mean ranging from 0.27 to 0.35 cm 442
yr-1) > type 3 and 4 (mean ranging from 0.13 to 0.15 cm yr-1) > type 1 and 2 (mean ranging
443
from 0 to 0.01 cm yr-1) (ANOVA with a Fisher test at 5 % level of confidence). Zero-velocity
444
occurred in 23 profiles corresponding to different soil groups: Acrisols (n=1), Cambisols 445
(n=7), Fluvisols (n=2), Histosols (n=3), Leptosols (n=1), Regosols (n=2), Solonetz (n=2), 446
Vertisols (n=2) and Yermosols (n=3). We could not identify the key parameter responsible for 447
these zero-velocities. Significant differences in vs were observed under various land uses and
448
covers, with the highest vs values found under peatland (0.38 cm yr-1, n=2) and the lowest
449
under forests (0.07 cmyr-1, n=6), soils located under grassland being associated with
450
intermediary vs values (0.14 cm yr-1, n=63).
451
Several authors found that migration velocity of 137Cs decreased with time after the
452
radionuclide input (Alexakhin and Krouglov, 2001). To test the impact of this parameter, we 453
calculated the time elapsed since the main 137Cs input considering the simulated respective
454
contributions of global fallout and Chernobyl accident (all values were decay-corrected to the 455
sampling date). The simulated vs values for the entire set of profiles decreased with time (T)
456
after the main 137Cs input (R=-0.32, n=71; Fig. 6).
457
When considering the different soil groups, velocities were independent of the time after the 458
main input in Vertisols, Solonetzs, Luvisols, Fluvisols and Cambisol. For the two first soil 459
groups, vs were systematically lower than 0.11 cm yr-1, whereas in Luvisols, velocities were
460
relatively high (0.22±0.06 cm yr-1). They ranged from 0 to 0.43 yr cm-1 in Fluvisols and
461
Cambisols. In Leptosols, Podzols, Regosols and Yermosols, the velocities decreased with 462
time, whereas they increased in Histosols. 463
In addition, Histosols showed two populations of profiles: profiles with a high Ds value
464
(> 1.5 cm2 yr-1) and a v
s close to 0 cm yr-1 or profiles with the highest vs values (vs > 0.2 cm yr
-465
1 with D
s < 0.2 cm2 yr-1). The highest vs values were simulated in peatland profiles, whereas
466
the lowest velocities were obtained for Histosols under forest or grassland. In addition vs
467
values increased with time. As discussed in the introduction, transport of 137Cs in dissolved
468
form can partially explain the simulated vs values in Histosols that contain more than 20% of
469
organic matter. Their relatively lower value when Histosol were collected under grassland or 470
forest is probably due to a partial absorption of the soluble fraction of 137Cs by the vegetation.
471
In the case of Luvisols, Acrisols, Solonetz and Cambisols, the obtained vs values may reflect
the occurrence of clay translocation, as clay translocation is a major pedogenic process in 473
Luvisols, Acrisols and Solonetz, and secondary pedogenic process in Cambisols (FAO 1998; 474
Bockheim and Gennadiyev 2000). The significantly higher vs values obtained for Luvisols
475
(ANOVA with a Fisher test at 5 % level of confidence, Table 5) are consistent with the 476
occurrence of clay translocation in this soil group. Clay translocation may also explain some 477
of the few high vs values found in Cambisols. However, some profiles corresponding to these
478
soil groups have a vs value equal to 0 cm yr-1 (Acrisols for example) or positive but extremely
479
low values (Solonetz with a mean vs of 0.03 cm yr-1). In these soils, clay translocation might
480
not have been active since the beginning of the 137Cs release into the atmosphere. This finding
481
is consistent with the fact that this process is only active in soils where pH ranges from 5 to 482
6.5 (Quénard et al. 2011), except in sodic soils (Solonetz for example). 483
484
3.3.4 Global penetration velocity of caesium-137
485
Soils compiled in the database were submitted to different inputs of 137Cs and were sampled
486
at various dates. As mentioned above, these parameters control the actual depth of 487
penetration. We modelled Ds and vs that are responsible for the penetration of caesium in the
488
soils, but these parameters did not provide a direct picture of the penetration velocity of 489
caesium in the soil. To obtain it, we calculated the mean depth reached by 137Cs after 25 years
490
of migration, considering that 137Cs was instantaneously injected into the soil as a Dirac
491
distribution representing a 'spike' of concentrated 137Cs (Table 5). Mean penetration velocity
492
of 137Cs over 25 years varied between 0.05 and 0.76 cm yr-1 (median of 0.28 cm yr-1). When
493
calculated over 50 years, these values decreased by about 20 % in average because of 494
diffusive processes and ranged from 0.04 to 0.71 cm yr-1 (median of 0.21 cm yr-1).
495 496
3.3.5 Caesium-137 content at depth below 13 cm
As mentioned before, the distribution of scaled residuals suggested that the model 498
underestimated the deep penetration of 137Cs below 13 cm. We therefore estimated the
499
unmodelled Cs inventory and quantified its migration rate. The proportion of the inventory 500
underestimated by the model below 13 cm ranged between -3.8 and 37.2 %, with a median 501
value of 1.9 %. The mean transfer rate below 13 cm was then calculated by dividing the 502
underestimated fraction by the time after the main 137Cs input. It ranged from 7.5 to 44.1
503
years (median of 20.1 years) and the obtained rate of transfer below 13 cm varied from 0 to 504
0.02 yr-1 (median of 0.001 yr-1). As discussed above, this transfer in depth could be due to the
505
behaviour of local feeders. Matisoff et al. (2011) estimated that the feeding rate of non-506
local feeders ranged from 0.002 to 0.02 yr-1 depending on the soil group. As our results are of
507
the same order of magnitude, this suggests that non-local feeders could be responsible for 508
these deep transfers. 509
510
3.3.6 Approximations in the model: implications for estimating solid matter transfers
511
Initial distribution of radionuclides was modelled as an injection at the surface (z=0), which is 512
an over-simplification as 137Cs wet deposits are inherently heterogeneous. Cs-137 is most
513
likely sorbed in soil macropores, and sorbing zones are affected by preferential flow (Bundt et 514
al. 2000), which depends itself on soil structure and moisture. Prediction of initial 137Cs
515
distribution is therefore case-dependent and as such, it is difficult to reproduce in a general 516
modelling approach. 517
Furthermore, in our modelling approach, we considered that the diffusion and convection 518
velocity coefficients were constant in time and depth. However, some authors predicted a 519
decrease in migration velocities with time (Alexakhin and Krouglov 2001). Nevertheless, as 520
outlined by Kirchner (1998), this apparent decrease simulated by compartment models may 521
be explained by the occurrence of the diffusive process itself. The heterogeneous distribution 522
of 137Cs can also be a cause of this decrease: 137Cs was likely initially located on the surface
523
of macropores and aggregates and it was then progressively incorporated within the soil 524
matrix and become therefore less mobile. Nevertheless, it has been shown that preferential 525
flow paths (and thus the soil structure) may remain stable for more than 40 years in soils 526
(Bundt et al. 2000). Moreover, pedogenic processes affecting the vertical solid matter 527
transfers such as bioturbation were recognized to be depth-depend (Müller-Lemans and Van 528
Dorp 1996). Similarly, integrating non-local feeders modelling as in Jarvis et al. (2010) has a 529
direct influence on the soil displacement rate (corresponding to vs in our study), which
530
decreased linearly with depth in the feeding zone. Therefore, we expect that the inclusion of 531
depth-variable coefficients in the model may improve simulations of 137Cs distributions at
532
depths < 13 cm. However, including spatially variable coefficients in the model would require 533
the inclusion of new parameters (at least 2 additional factors to account for exponentially 534
decreasing Ds and vs), the improvement of the database or the collection of additional samples
535
and measurements in the field. 536
537
4 Conclusions 538
The modelling approach proposed in this study provides an original basis for comparing 137Cs
539
depth migration in different soil groups. However, no difference of global 137Cs penetration
540
velocities was observed among soil groups. It ranged from 0.05 to 0.76 cm yr-1 (median of
541
0.28 cm yr-1), with a significantly lower velocity for soil groups poorly evolved (Regosol),
542
and a significantly higher for soils rich in organic matter (Histosols). The model 543
underestimated this velocity under a 13-cm depth. In the future, the model could be improved 544
by introducing a non-local feeder term or by allowing Ds and vs values to vary with soil depth
545
in the diffusion-convection equation. 546
Ds and vs values explained the depth profile of 137Cs in soils and were shown to partly reflect
the occurrence of turbation including bioturbation for Ds and clay translocation for vs, except
548
in Histosols where the transfer of 137Cs in dissolved form was very likely. D
s values ranged
549
from 0.02 to 4.44 cm2 yr-1 (median of 0.64 cm2 yr-1) and v
s varied from 0 to 0.74 cm yr-1
550
(median of 0.1 cm yr-1).
551
Due to the limited number of documented profiles per soil group and other potential sources 552
of variability that could not be documented (climate, land use or cover, pH), it was not 553
possible to attribute precisely Ds and vs variations to the occurrence of different soil processes.
554
However, clear trends were observed for certain soil groups. Lower Ds values were simulated
555
in acidic soils or under cold climate conditions, and they likely reflected the lower-intensity 556
bioturbation prevailing under those pedoclimatic conditions. In addition, high vs values were
557
simulated in soils submitted to clay translocation (notably Luvisols). A relationship was also 558
derived between vs and certain land uses or covers. In this context, our results showed that
559
modelling 137Cs depth-profile with a diffusion-convection equation allowed estimating the
560
bioturbation and clay translocation velocity in a certain number of soil groups. Although the 561
occurrence of these soil processes is well known in most soils, they have been rarely 562
quantified. Still, this quantification is crucial as these processes partially control the 563
development of soil surface characteristics and several soil services such as plant nutrition, 564
organic carbon storage or pollutant fixation. In the future, to overcome the limitations 565
associated with the modelling of diffusion-convection parameters based on 137Cs
566
measurements, we suggest to conduct a multi-isotopic characterisation of different types of 567
soil profiles in order to quantify the relative contribution of the different processes responsible 568
for vertical solid matter transfer. 569
570
Acknowledgments - The authors are grateful to Dr. Jérôme Balesdent for his helpful advises, 571
as well to Dr. Frédéric Golay, Dr. Cédric Galusinski and Dr. Gloria Faccanoni for their help 572
with model simulations. We thank the French Research Agency (ANR) that funded the 573
Agriped project (ANR 10 Blanc 605). M. Jagercikova received a PhD fellowship from the 574
French National Institute of Agronomy (INRA). We are also grateful to Dr. Luise Giani, Dr. 575
Gwen Milton, Dr. Concepción Olondo Castro and Dr. Klas Rosén for kindly providing their 576
soil datasets and additional information regarding their studies. 577
578
References 579
AIEA (2010) Handbook of Parameter Values for the Prediction of Radionuclide Transfer in 580
Terrestrial and Freshwater Environments. Technical Reports SeriEs No. 472. 581
International Atomic Energy Agency 582
Al-Masri M (2006) Vertical distribution and inventories of Cs-137 in the Syrian soils of the 583
eastern Mediterranean region. J Environ Radioact 86:187-198 584
Alexakhin RM, Krouglov SV (2001) Soil as the main compartment for radioactive substances 585
in terrestrial ecosystems. In: Bréchignac F, Howard BJ (eds) Radioactive pollutants. 586
Impact on the environment, EDP Sciences, Les Ulis, France, pp 149-174 587
Aoyama M, Hirose K, Igarashi Y (2006) Re-construction and updating our understanding on 588
the global weapons test 137Cs fallout. J Environ Monit 8:431-438 589
Ben Slimane A, Raclot D, Evrard O, Sanaa M, Lefèvre I, Ahmadi M, Tounsi M, Rumpel C, 590
Ben Mammou A, Le Bissonnais Y (2013) Fingerprinting sediment sources in the 591
outlet reservoir of a hilly cultivated catchment of Tunisia. J Soils Sediments 13:801-592
815 593
Bockheim J, Gennadiyev A (2000) The role of soil-forming processes in the definition of taxa 594
in Soil Taxonomy and the World Soil Reference Base. Geoderma 95:53-72 595
Bossew P, Kirchner G (2004) Modelling the vertical distribution of radionuclides in soil. Part 596
1: the convection-dispersion equation revisited. J Environ Radioact 73:127-150 597
Bunzl K (2002) Transport of fallout radiocesium in the soil by bioturbation: a random walk 598
model and application to a forest soil with a high abundance of earthworms. Sci Total 599
Environ 293:191–200 600
Bunzl K, Kracke W, Schimmack W, Zelles L (1998) Forms of fallout Cs-137 and Pu239+240 601
in successive horizons of a forest soil. J Environ Radioact 39:55-68 602
Bunzl K, Schimmack W, Zelles L, Albers B (2000) Spatial variability of the 603
vertical migration of fallout Cs-137 in the soil of a pasture, and consequences for long-604
term predictions. Radiat Environ Biophys 39:197-205 605
Bundt M, Albrecht A, Froidevaux P, Blaser P, Flühler H (2000) Impact of preferential flow 606
on radionuclide distribution in soil. Environ Sci Tech 34:3895-3899 607
Cambray RS, Playford K, Lewis G, Carpenter R (1989) Radioactive fallout in air and rain: 608
results to the end of 1988. Environmental and Medical Sciences Division, United 609
Kingdom Atomic Energy Authority 610
Chartin C, Evrard O, Onda Y, Patin J, Lefèvre I, Ayrault S, Lepage H, Bonté P (2013) 611
Tracking the early dispersion of contaminated sediment along rivers draining the 612
Fukushima radioactive pollution plume. Anthropocene 1: 23-34 613
Cremers A, Elsen A, Depreter P, Maes A (1988) Quantitative-analysis of radiocesium 614
retention in soils. Nature 335:247-249 615
De Cort M, Dubois G, Fridman SD, Germenchuk MG, Izrael YA, Janssens A, Jones AR, 616
Kelly GN, Kvasnikova EV, Matveenko II, Nazarov IM, Pokumeiko YM, Sitak VA, 617
Stukin ED, Tabachnyi LY, Tsaturov YS, Avdyushin SI (1996) Atlas of caesium 618
deposition on Europe after the Chernobyl accident. EUR Report 16733, EC, Office for 619
Official Publications of the European Communities, Luxembourg 620
De Vos B, Van Meirvenne M, Quataert P, Deckers J, Muys B (2005) Predictive quality of 621
pedotransfer functions for estimating bulk density of forest soils. Soil Sci Soc Am J 622
69:500-510 623
Elshamy M, Mathias S, Butler A (2007) Demonstration of radionuclide transport modelling 624
under field conditions: 50-year simulation of caesium migration insoil. Tech. Rep. 625
Imperial/ NRP_016, United Kingdom Nirex Limited 626
Elzein A, Balesdent J (1995) Mechanistic simulation of vertical distribution of carbon 627
concentrations and residence times in soils. Soil Sci Soc Am J 59:1328-1335 628
FAO (1998) World reference base for soil resources. World Soil Resources Rep. 84, Rome 629
Gallagher D, McGee E, Mitchell P (2001) A recent history of C-14, Cs-137, Pb-210, and Am-630
241 accumulation at two Irish peat bog sites: An east versus west coast comparison. 631
Radiocarbon 43:517-525 632
Gil-Garcia C, Rigol A, Vidal M (2009) New best estimates for radionuclide solid liquid 633
distribution coefficients in soils. Part 1: radiostrontium and radiocaesium. J Environ 634
Radioact 100:690-696 635
He Q, Walling D (1997) The distribution of fallout Cs-137 and Pb-210 in undisturbed and 636
cultivated soils. App Radiat Isot 48:677-690 637
Ireson M, Butler A (2009) A review of soil bioturbation and soil development. Tech. Rep. 638
Imperial/NRP_018, United Kingdom Nirex Limited 639
Isaksson M, Erlandsson B, Mattsson S (2001) A 10-year study of the Cs-137 distribution in 640
soil and a comparison of Cs soil inventory with precipitation-determined deposition. J 641
Environ Radioact 55:47-59 642
Jarvis NJ, Taylor A, Larsbo M, Etana A, Rosen K (2010) Modelling the effects of 643
bioturbation on the re-distribution of 137Cs in an undisturbed grassland soil. Eur J 644
Soil Sci 61:24-34 645
Karadeniz O, Yaprak G (2008) Geographical and vertical distribution of radiocesium levels in 646
coniferous forest soils in Izmir. J Radioanal Nucl Chem 277:567-577 647
Kaste JM, Heimsath AM, Bostick, BC (2007) Short-term soil mixing quantified with fallout 648
radionuclides. Geology 35:243-246 649
Kirchner G (1998) Applicability of compartmental models for simulating the transport of 650
radionuclides in soil. J Environ Radioact 38:339-352 651
Konoplev A, Bulgakov A, Popov V, Hilton J, Comans R (1996) Long-term investigation of 652
Cs-137 fixation by soils. Radiation Protection Dosimetry 64:15-18 653
Korsakissok I, Mathieu A, Didier D (2013) Atmospheric dispersion and ground deposition 654
induced by the fukushima nuclear power plant accident: a local-scale simulation and 655
sensitivity study. Atmos Environ 70:267-279 656
Kottek M, Grieser J, Beck C, Rudolf B, Rubel F (2006) World map of the Koppen Geiger 657
climate classification updated. Meteorologische Zeitschrift 15(3):259-263 658
Krstic D, Nikezic D, Stevanovic N, Jelic M (2004) Vertical profile of 137Cs in soil. App
659
Radiat Isot 61:1487-1492 660
Kruse-Irmer S, Giani L (2003) Vertical distribution and bioavailability of Cs-137 in organic 661
and mineral soils. J Plant Nutr Soil Sci 166:635-641 662
Kruyts N, Delvaux B (2002) Soil organic horizons as a major source for radiocesium 663
biorecycling in forest ecosystems. J Environ Radioact 58:175-190 664
Legarda F, Romero LM, Herranz M, Barrera M, Idoeta R, Valino F, Olondo C, Caro A (2011) 665
Inventory and vertical migration of Cs-137 in Spanish mainland soils. J Environ 666
Radioact 102:589-597 667
Lepage H, Evrard O, Onda Y, Patin J, Chartin C, Lefèvre I, Bonté P, Ayrault S (2014) 668
Environmental mobility of 110mAg: lessons learnt from Fukushima accident (Japan)
669
and potential use for tracking the dispersion of contamination within coastal 670
catchments. J Environ Radioactiv 130:44-55 671
Mabit L, Benmansour M, Walling DE (2008) Comparative advantages and limitations of the 672
fallout radionuclides Cs-137, Pb-210(ex) and Be-7 for assessing soil erosion and 673
sedimentation. J Environ Radioactiv 99:1799-1807 674
Matisoff G, Ketterer ME, Rosen K, Mietelski JW, Vitko LF, Persson H, Lokas E (2011) 675
Downward migration of Chernobyl-derived radionuclides in soils in Poland and 676
Sweden. Appl Geochem 26:105-115 677
Milton G, Kramer S, Watson W, Kotzer T (2001) Qualitative estimates of soil disturbance in 678
the vicinity of CANDU stations, utilizing measurements of Cs-137 and Pb- 210 in soil 679
cores. J Environ Radioact 55:195-205 680
Müller-Lemans H, van Dorp F (1996) Bioturbation as a mechanism for radionuclide transport 681
in soil: Relevance of earthworms. J Environ Radioact 31:7-20 682
Noordijk H, Van Bergeijk KE, Lembrechts J, Frissel MJ (1992) Impact of ageing and weather 683
conditions on soil-to-plant transfer of radiocesium and radiostrontium. J Environ 684
Radioact 15:277-286 685
Parsons AJ, Foster IDL (2011) What can we learn about soil erosion from the use of 137Cs? 686
Earth-Sci Rev 108:101-113 687
Quénard L, Samouelian A, Laroche B, Cornu S (2011) Lessivage as a major process of soil 688
formation: A revisitation of existing data. Geoderma 167-168:135-147 689
Ritchie JC, Ritchie CA (2007) Bibliography of publications of 137cesium studies related to 690
erosion and sediment deposition. Tech. rep., USDA Agricultural Research Service 691
Rosén K, Öborn I, Lönsjö H (1999) Migration of radiocaesium in Swedish soil profiles after 692
the Chernobyl accident, 1987–1995. J Environ Radioact 46:45-66 693
Sanchez A, Smolders E, Van den Brande K, Merckx R, Wright S, Naylor C (2002) 694
Predictions of in situ solid/liquid distribution of radiocaesium in soils. J Environ 695
Radioact 63:35-47 696
Sawhney B (1972) Selective sorption and fixation of cations by clay minerals: a review. Clays 697
Clay Miner 20:93-100 698
Schiffers K, Teal LR, Travis JMJ, Solan M (2011) An open source simulation model for soil 699
and sediment bioturbation. PloS ONE 6:e28028 700
SchimmackW, Márquez FF (2006) Migration of fallout radiocaesium in a grassland soil from 701
1986 to 2001. Part II: Evaluation of the activity-depth profiles by transport models. Sci 702
Total Environ 368:863-874 703
Schimmack W, Schultz W (2006) Migration of fallout radiocaesium in a grassland soil from 704
1986 to 2001 - Part I: Activity-depth profiles of Cs-134 and Cs-137. Sci Total Environ 705
368:853-862 706
Schuller P, Bunzl K, Voigt G, Ellies A, Castillo A (2004) Global fallout Cs-137 accumulation 707
and vertical migration in selected soils from South Patagonia. J Environ Radioactiv 708
71:43-60 709
Schuller P, Ellies A, Kirchner G (1997) Vertical migration of fallout Cs-137 in agricultural 710
soils from Southern Chile. Sci Total Environ 193:197-205 711
Sigurgeirsson MA, Arnalds O, Palsson SE, Howard BJ, Gudnason K (2005) Radiocaesium 712
fallout behaviour in volcanic soils in Iceland. J Environ Radioact 79:39-53 713
Smith JT, Elder DG (1999) A comparison of models for characterizing the distribution of 714
radionuclides with depth in soils. Eur J Soil Sci 50:295-307 715
Smith JT, Fesenko SV, Howard BJ, Horrill AD, Sanzharova NI, Alexakhin RM, Elder DG, 716
Naylor C (1999) Temporal change in fallout 137Cs in terrestrial and aquatic systems: 717
a whole ecosystem approach. Environ Sci Tech 33:49-54 718
Szerbin P, Koblinger-Bokori E, Koblinger L, Vegvari I, Ugron A (1999) Caesium- 137 719
migration in Hungarian soils. Sci Total Environ 227:215-227 720
Soil Survey Staff (1999) Soil taxonomy: a basic system of soil classification for making and 721
interpreting soil surveys. US Department of Agriculture, Agriculture Handbook, N° 722
436, Washington DC, 2nd edition
723
Tamura T, Jacobs D (1960) Structural implications in cesium sorption. Health Phys 2:391-724
398 725
Turner NB, Ryan JN, Saiers JE (2006) Effect of desorption kinetics on colloid facilitated 726
transport of contaminants: Cesium, strontium, and illite colloids. Water Resour Res 727
42:W12S09 728
Tyler A, Carter S, Davidson D, Long D, Tipping R (2001) The extent and significance of 729
bioturbation on Cs-137 distributions in upland soils. Catena 43:81-99 730
UNSCEAR (1982) Ionizing radiation: sources and biological effects report to the general 731
assembly, with annexes. Tech. rep., United Nations, New York 732
Vandebroek L, Van Hees M, Delvaux B, Spaargaren O, Thiry Y (2012) Relevance of 733
Radiocaesium Interception Potential (RIP) on a worldwide scale to assess soil 734
vulnerability to 137Cs contamination. J Environ Radioact 104:87-93
735
VandenBygaart A, Protz R, Tomlin A, Miller J (1998) Cs-137 as an indicator of earthworm 736
activity in soils. Appl Soil Ecol 9:167-173 737
Wilkinson MT, Richards PJ, Humphreys GS (2009) Breaking ground: Pedological, 738
geological, and ecological implications of soil bioturbation. Earth Sci Rev 97:257-272 739
Zhang X, Long Y, He X, Fu J, Zhang Y (2008) A simplified (CS)-C-137 transport model for 740
estimating erosion rates in undisturbed soil. J Environ Radioactiv 99:1242-1246 741
Zhang X, Qi Y, Walling DE, He X, Wen A, Fu J (2006) A preliminary assessment of the 742
potential for using Pb-210(ex) measurement to estimate soil redistribution rates on 743
cultivated slopes in the Sichuan Hilly Basin of China. Catena 68:1-9 744
Zheng JJ, He XB, Walling D, Zhang XB, Flanagan D, Qi YQ (2007) Assessing soil erosion 745
rates on manually-tilled hillslopes in the Sichuan Hilly Basin using Cs-137 and Pb-746
210(ex) measurements. Pedosphere 17:273-283 747