HAL Id: hal-03215088
https://hal.inrae.fr/hal-03215088
Submitted on 3 May 2021
HAL is a multi-disciplinary open access
archive for the deposit and dissemination of sci-entific research documents, whether they are pub-lished or not. The documents may come from teaching and research institutions in France or abroad, or from public or private research centers.
L’archive ouverte pluridisciplinaire HAL, est destinée au dépôt et à la diffusion de documents scientifiques de niveau recherche, publiés ou non, émanant des établissements d’enseignement et de recherche français ou étrangers, des laboratoires publics ou privés.
Distributed under a Creative Commons Attribution| 4.0 International License
A review on cesium desorption at the
freshwater-seawater interface
A Delaval, C Duffa, O Radakovitch
To cite this version:
A Delaval, C Duffa, O Radakovitch. A review on cesium desorption at the
freshwater-seawater interface. Journal of Environmental Radioactivity, Elsevier, 2020, 218, pp.106255.
A REVIEW ON CESIUM DESORPTION AT
1THE FRESHWATER-SEAWATER
2INTERFACE
3 4 5DELAVAL1* A., DUFFA1 C., RADAKOVITCH1,2 O.
6 7
1 - IRSN (Institut de Radioprotection et de Sûreté Nucléaire), PSE-ENV/SRTE/LRTA, 8
13115 Saint-Paul-Les-Durance, France. 9
2 - Aix Marseille Univ, CNRS, IRD, INRAE, Coll France, CEREGE, Aix-en-Provence, 10
France 11
12
Corresponding author : adrien.delaval@irsn.fr 13
14 15
Acknowledgments : 16
The authors are indebted to the Institute for Radiological Protection and Nuclear Safety 17
(IRSN) and to Region Sud (Provence-Alpes-Côte d'Azur) authorities for the PhD funding. 18
We thank the CRIS (Centre de ressources en informations scientifiques et techniques) of 19
IRSN for their help to provide various documents. This study was conducted within the 20
Rhône Sediment Observatory (OSR) program, a multi-partner research program funded 21
through Plan Rhône of the European Regional Development Fund (ERDF), Agence de l'eau 22
© 2020 published by Elsevier. This manuscript is made available under the Elsevier user license https://www.elsevier.com/open-access/userlicense/1.0/
Version of Record: https://www.sciencedirect.com/science/article/pii/S0265931X20300862
Rhône Méditerranée Corse, CNR, EDF and three regional councils (Region Auvergne-23
Rhône-Alpes, PACA and Occitanie). 24
25 26 27
Introduction
1 2
The pollution of marine ecosystems by radionuclides is a major concern for society since 3
the beginning of the nuclear era. It may be due to different sources including: in-situ
4
releases from coastal nuclear power-plants, accidents associated with nuclear vessels 5
(vessels, missils), Naturally Occuring Radioactive Materials (NORMs) related to oil or 6
gas production and direct or indirect global releases associated with nuclear tests or 7
accidents on installations. A direct input is provided by atmospheric fallout and/or 8
offshore releases (Fukushima), while an indirect input is due to the transport by rivers, 9
collecting radionuclides from watersheds consequently to atmospheric fallout. Finally, 10
submarine groundwater discharge may constitute a very specific direct input (Sanial et 11
al., 2017). 12
13 14
Cesium radioactive isotopes (134Cs and 137Cs) have been extensively monitored in the
15
environment due to their significant radioecological hazard (Garnier-Laplace et al., 16
2011) and their persistence (half-life of 2.4 and 30.2 years respectively). They are 17
produced through uranium fission within nuclear reactors and thus can be found in both 18
accident or authorized releases. 19
In the case of accidents and atmospheric nuclear testing, radiocesium has been spread 20
over large spatial scales by the way of atmospheric deposition (Mattsson and Moberg, 21
1991), but rivers constitute an additional input to the sea (Trapeznikov et al., 1994; 22
Yamashiki et al., 2014). These rivers bring radiocesium through the releases of 23
reprocessing and power plants as well as by the runoff of contaminated watersheds like 24
in Chernobyl or Fukushima (Walling and He, 1999; Garcia-Sanchez and Konoplev, 2009; 25
Sakaguchi et al., 2018 ). Cesium exists in rivers as dissolved Cs+ with small tendency to
26
form colloids (Onishi et al., 1981; Eyrolle and Charmasson 2004) but is mainly 27
transported in particular form (Takahashi et al., 2017) because of its high affinity for 28
clay minerals ( Torstenfelt et al., 1982; Fan et al., 2014;) 29
30
At the river-sea interface, the important changes in physico-chemical conditions 31
including ionic strength, solution composition and pH may induce the desorption of Cs 32
from particles to the dissolved phase. A direct consequence is the shift of its distribution 33
coefficient Kd (ratio between solid and liquid activities, L/Kg), decreasing from 6,66.103
-34
1,35.105 in freshwater (Tomczak et al., 2019) to 4,5.102 -2.103 in seawater (IAEA, 2004;
35
Tagami and Uchida, 2013) 36
37
This desorption has been highlighted in laboratory experiments and in-situ studies, 38
through the monitoring of dissolved activities ( Matishov et al., 2006 ; Kakehi et al., 39
2016) or sediment inventories (Kusakabe et al., 2013). It is well recognized that clay 40
minerals are the most important solid phase for the adsorption of radiocesium, but a 41
fraction may also be attached to organic material, at least in contaminated watersheds 42
near Fukushima (Naulier et al., 2017). For clays, illite is the most important and strong 43
absorbent but kaolinite, smectite and vermiculite are also active, as well as biotite for 44
phyllosilicate (Okumura et al., 2018)), 45
The negatively charged basal oxygen surfaces found on clay planar sites can form strong 46
inner-sphere complexes with monovalent cations with low hydration energy, such as 47
K+,NH4+, Rb+ and Cs+ (Sposito et al., 1999). These sites have usually low affinity due to
48
their low selectivity (Wauters et al., 1996), but they adsorb Cs+ more efficiently than the
49
other cations due to its lowest hydration energy (Nakao et al., 2014). This cation uptake 50
can be effective within a few hours (Onishi et al., 1981). Other sorption occurred on edge 51
sites, hydrated interlayer sites or frayed edge sites, corresponding to weathering fronts 52
of micaceous minerals (Okumura et al., 2018). Finally, interlayer sites are not accessible 53
to hydrated cations with large effective ionic radii, but are accessible to easily 54
dehydrated cations such as Cs+ (Zachara et al., 2002). This binding could result in a 55
strong fixation, similar to those of native stable Cs already present in the mineral (Yin et 56
al., 2016). However, binding on both planar and interlayer sites are partially reversible, 57
and the increase of competitive ions in seawater ( K+, Na+ or NH4+) moves the
58
equilibrium towards a release of Cs+, providing an additional input to the dissolved
59
phase. 60
If desorption process at the freshwater-seawater interface has been already 61
demonstrated, there is no consensus on the potential quantity of Cs that can be desorbed 62
depending on the salinity. According to Sakaguchi et al (2018): “the desorbed value 63
remains open for discussion”. Furthermore, the influence of the major cations on the 64
desorption efficiency is not completely clear. According Yin et al (2016), questions remain 65
on how each site is likely to desorb and on the various associated kinetic rates. 66
67
This paper provides a review on experimental laboratory studies conducted on Cs 68
desorption in seawater. It aims to precise this process by identifying the values that can 69
be expected according to the salinity, by characterizing the parameters of influence and 70
by underlining unknowns for an eventual modelling work. 71
72 73
1
Material and methods
74
1.1
Literature search
75 76
All laboratory experiments exposing particles to a Cs (stable or radioactive) 77
contamination in freshwater or seawater and then desorbing in seawater media were 78
examined. The information required were the distribution of Cs between the solid 79
and the dissolved phase. 80
Searches were performed to list all experimental studies carried out on stable and 81
radioactive cesium desorption from particles samples in salt water. We included peer-82
reviewed and conferences papers, thesis and technical reports from 1950 to present. 83
The databases used were Google Scholar, Scopus, and the CRIS (Centre de 84
ressources en informations scientifiques et techniques) of IRSN. 85
Searches were performed using the keywords: “Caesium”, “cesium”, and “desorption”, 86
”remobilization”, ”leaching”, ”distribution” and “saltwater”, ”seawater”, ”sea”, 87
”salinity”. Studies reporting distribution of radiocesium between solid and liquid 88
phases in the field were not considered because of the lack of information on duration 89
of desorption, delay between adsorption and desorption as well as the salinity of the 90
media. We focused only on experimental laboratory approach that explicitly 91
addressed cesium desorption in saltwater (minimal salinity of 1). Three studies 92
which did not provide the fraction of desorbed Cs from samples after the desorption 93
experiment (or a way to obtain it such as graphs, Kd, or activities in both phases 94
before and after experiment) were excluded. The completeness of the results obtained 95
was considered as satisfactory when no more relevant references on the topic could 96
be found in the selected studies. This is the “snowballing approach” proposed by 97
(Sayers, 2007). 98
1.2
Database construction
100
A bibliographic database was created to list all publications concerning cesium 101
desorption from particles samples in saltwater according to the enounced modalities, 102
leading to a total of 32 publications (Table 1). 103
Different kinds of information were extracted from this database and reported into 104
sections described hereunder. Some are presented in Table 1: 105
• Paper information and objectives of the experiment: This section includes reference
106
information such as title, year and authors of the publication. 107
• Sampling location information: Geographical information on the sampling sites as 108
well as available information on main physico-chemical parameters: grain-size, 109
cation exchange capacity (CEC), organic content and clay content. It is important to 110
note that samples can be different and include suspended particles in the water 111
column, sediments or soils. The results obtained on samples that were modified are 112
not taken into account (sieving of grain-size or removal of specific mineral phases; 113
Ouaniche, 1984; El Assy et al., 1991). 114
• Experimental design: This section focused on the materials and methods information
115
such as the conditions of cesium uptake and the isotope used. Four main 116
experimental designs were found and differentiated for our work (see the scheme of 117
their classification on Figure 2). 118
1) desorption of Stable Cesium (SCs) corresponding to 133Cs naturally
119
incorporated into the mineral material of the particles (not spiked). A 120
good example of the experiment is provided by Takata et al. (2015). 121
2) desorption of RadioCesium (RCs) from particles which have been 122
exposed to 134Cs or 137Cs in the field (Yamasaki et al., 2016).
3) desorption of RadioCesium from particles spiked (134Cs or 137Cs) in
124
Laboratory and in Freshwater media (RCs.Lab.Fw; ex. Onodera et al., 125
2017). 126
4) desorption of RadioCesium from particles spiked in Laboratory in 127
Saltwater media at salinity>1 (RCs.Lab.Sw; ex. Oughton et al., 1997). 128
129
• Experimental conditions: this section reports experimental parameters such as
130
salinity, ratio between sample mass and volume of seawater, use of natural or 131
artificial seawater, duration of the sorption and desorption phases. 132
• Results collection methodology: All the results concerning the distribution of cesium
133
between the solid and the dissolved phases after exposition to saltwater were 134
collected. When a study reported multiple values corresponding to change of the 135
experimental conditions or of the sample used, all results were also collected. Results 136
were homogenized into a percentage of Cs activity (or concentration for stable Cs) 137
desorbed in seawater. The section reports the methodology used to obtain this 138
percentage which are values: (i) directly provided by the authors, (ii) calculated from 139
graphical extraction with plot digitizer, (iii) calculated from activities of (iv) the 140
sample or from the Kd provided by the authors. 141
142
2
Global overview of the database
143 144
2.1
Worldwide and historic concerns on radiocesium desorption at
river-145
sea interfaces
146 147
The 32 studies selected correspond to 68 samples and a total of 502 experimental results. 148
87% of these samples were sediments, 10% suspended particles and 3% soils. The 149
sediments were collected mostly in river (56 %), sea or bays (30%), or estuaries (14%). 150
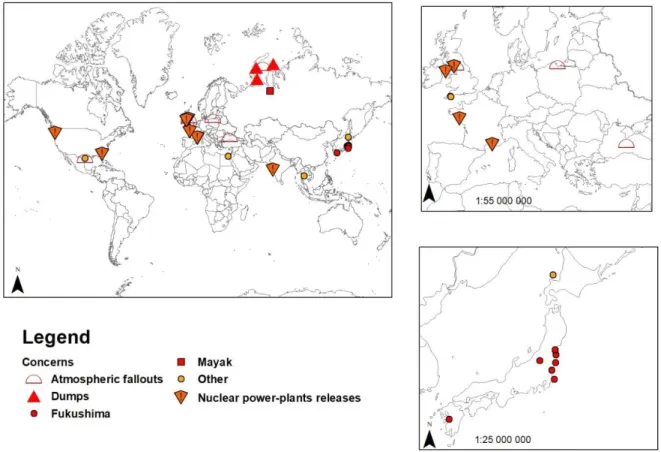
The majority of studies (14) were interested in the fate of radiocesium sorbed onto soils 151
after atmospheric depositions due to global fallout or nuclear accidents. Also, most of the 152
sediment or suspended particle samples were collected at the output of contaminated 153
watersheds as shown by the locations of the sites (figure 1), mostly related with the 154
Fukushima accident or with nuclear power-plant releases. Only one study reported data 155
directly in relation with the Chernobyl accident (Davison et al., 1993). Four specific 156
studies were also conducted in the Artic Sea in relation with the dumping of radioactive 157
material (17000 containers and 19 vessels) and the potential release from high activity 158
sediments. 159
The aim of the other works (5) was related to the understanding of stable elements 160
transfer at the river-sea interface, using of their radioactive analogs. 161
162
2.2
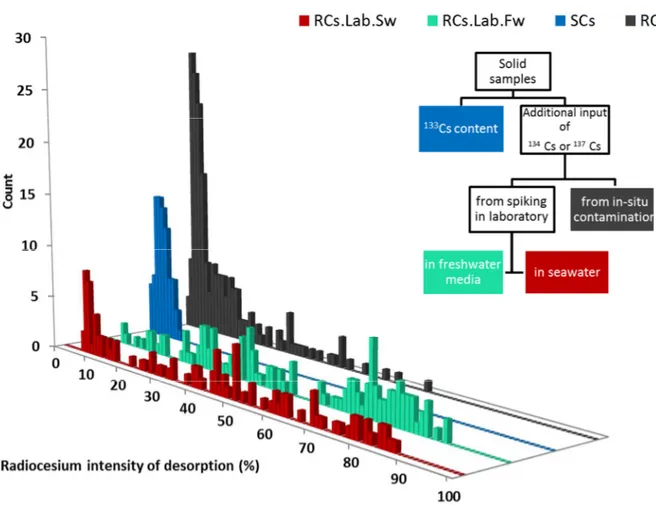
Influence of the experimental design
163
The values of Cs desorption percentage are reported in Figure 2. They relate the initial 164
activity onto the particles, i.e. 100% indicates that all radiocesium was released into 165
dissolved phase. They are directly issued from the document or calculated according 166
different methodologies (Table 1). When this value in % was not given in the study, it 167
was calculated as following: 168 % = 1 − × 100 (1) 169 Or 170 % = 1 − ∗∗ × 100 (2) 171
Where and are the massic activities (Bq/kg) of the sample before 172
and after desorption, the dissolved activity after the desorption experiment
173
(Bq/L), the mass of sample used (kg) and the mass of water in the media
174
(L). 175
176
The design of the experiment may have an influence on the results. Indeed, while the 177
desorption protocol was similar between experiments, the Cs sorption (in the lab or in 178
the environment) was very different. This could lead to different desorption dynamics 179
depending on the solid to liquid ratio used for the contamination (Onodera et al., 2017), 180
or the ionic composition of the spiked medium as shown by Benes et al. (1992) in 181
freshwater. Consequently, results were separated into 4 different experimental designs 182
defined in section 1.2, and the distribution of the percentage of desorption obtained are 183
presented in Figure 2. 184
The range of desorption rate for experiments SCs and RCs varied greatly since they are 185
limited between 0 and respectively 10 and 64%. They present however the same modal 186
class at 2-6%. On the other hand, experiments RCs.Lab.Fw and RCs.Lab.Sw show wider 187
and multimodal distributions, extending from 6 to 86 % and 7 to 88%. 188
Our aim is to evaluate the state of knowledge and major uncertainties on the fate of 189
radiocesium at the river-sea interface. We will focus on the RCs and RCs.Lab.Fw 190
experiments because SCs concerns stable Cs and RCs.Lab.Sw sorption phase occurs in 191
seawater. These two experiments answer to different questions described below. They 192
were designed to give an order of magnitude of the Cs released after a sorption in 193
freshwater, and they did not look at the influence of various physico-chemical 194
parameters. 195
The experimental design RCs includes (but not only) riverine particles or sediments 196
issued from contaminated watersheds (Sakaguchi et al., 2018) or contaminated directly 197
in the river (Standring et al., 2002). These particles are likely to be transported from 198
river to sea especially during a flood event (Takata et al., 2015). 199
The experimental design RCs.Lab.Fw aims to reproduce the fate of suspended particles 200
or bottom sediments contaminated after a radioactive release directly into freshwater 201
(river), but desorption is still considered into seawater (Ciffroy et al., 2003). In general, 202
such experiment is more difficult to carry out because it requires an additional sorption 203
phase using radioactive sources. This could explain the lower number of available 204 results. 205
3
Overview on experiments
206 207Results of the RCs experiments follow a log-normal distribution (Fig. 2 and 3). The 208
percentages of desorption range between 0 and 65%, but the modal class 2-6% gathers 209
more than 47% of the experimental results (93/197). Furthermore, it should be noted 210
that values above 30% are issued from three studies only, and two of them used 211
sediments from Bombay Harbour (Desai et al., 1994; Patel, 1978). These authors 212
reported little information on their samples. The last and maximal value of 65 % comes 213
from the Ravenglass estuary (Stanners and Aston, 1982). 214
In contrary, results of RCs.Lab.Fw do not follow any classical distribution (Fig 2 and 4) 215
and present many modes. Low desorption below 10% concerned only particles with solid 216
to liquid ratios at or above 10000 mg/L. This concentration is already above most of those 217
observed in rivers, even in floods (Meybeck and Moatar, 2014; Sadaoui et al., 2016). The 218
highest desorption value (86%) was found for particles from the Tamar estuary (Bale, 219
1987). 220
221 222
3.1
Influence of salinity
223 224
There is no significant statistical relation between the salinity and the desorbed fraction 225
or Kd, when the results of the 32 studies related to RCs and RCs.Lab.Fw experiments 226
are plotted together (Fig 5). However, most of these studies tested just one salinity value, 227
and only two of them reported results over a range of salinity. In RCs experiments, 228
Sakaguchi et al. (2018) tested two salinities (16.5 and 33) using successive desorption 229
experiments, and each time the desorption at the 33 salinity medium increases by a 230
factor 1.5-2 compared to those at 16.5. Patel (1978) found a linear relation between 231
salinity and the amount of desorbed Cs for two different samples of the Bombay Harbour 232
for salinities ranging between 9.5 and 38. 233
For RCs.Lab.Fw, Reynolds and Gloyna (1964) found a positive linear relation between 234
released Cs and salinity, whereas Ciffroy et al. (2003) and Bale (1987) found that the 235
same fraction of Cs is desorbed for low (respectively 13 and 10) and high salinity (34), 236
similarly to a threshold over which salinity had no more influence on the fraction of 237
desorbed Cs. It must be noted however that in both studies, the desorbed fraction 238
increased significantly in the range 0 to 10 of salinity. 239
It is impossible from these various results to parametrize a relation between the salinity 240
and desorption of Cs from the particles. This might be due to the various solutions 241
chemistry used for these experiments, ranging from natural seawater to monoionic 242
solutions of Na+. Indeed, the use of monoionic solutions (Na+, K+) as desorption medium
243
leads to different effects. Mukai et al. (2018), Onodera et al. (2017), and Desai et al. 244
(1994) observed that for the use of K+ solutions always reached a plateau in the Cs
245
desorption, which was similar whatever the range of K+ concentrations, respectively 10-5
246
to 1 M, 0.01 to 1 M and 0.01 to 1.6 M. On the other hand, desorption increased linearly 247
with Na+, using respective ranges of 10-5 to 1M, 0.47 to 1M, and 0.01 to 1.6 M. By
comparison, the mean concentrations of K+ and Na+ in seawater at 35 salinity are 0.01
249
and 0.47M, and their molar ratio is 47. 250
251 252
These authors explained their results by the fact that Na+ has a higher hydration energy
253
and the capacity to enhance the interfoliar layer of clays, releasing thus the Cs stored on 254
these sites. On the other hand, K+ has a lower hydration energy and cannot release this
255
Cs. It is only involved in the cation exchange reaction occurring on surficial sites.
256 257
In addition, Mukai et al., (2018), and Onodera et al., (2017) both found that an increase 258
of K+ concentrationfrom 0.001 to 0.01 M (seawater) combined with Na+ (at 1M or 0.47 M)
259
decreased the desorption by a factor 2 (60% to 30% for Onodera) or even 4 (80% to 20% 260
for Mukai et al), which is also the amount of desorption observed with natural seawater 261
in their experiment. 262
These authors and Desai et al., (1994), argue that the “shrinking” or “collapsing” effect of 263
K+ on the interfoliar gap of clays (Mela, 1962) inhibits Cs release from these interfoliar
264
sites.Increasing salinity undoubtedly influences the desorption due to Na+ and K+ and
265
their mechanisms discussed above. However, while desorption increases linearly with 266
Na+ alone, addition of K+, around 0.001 to 0.01M range (corresponding to concentrations
267
in seawater of salinity 3.5-35) leads to a desorption plateau, due to its shrinking 268
properties on clay. These results suggest that the desorption no longer significantly 269
increases once a minimal salinity has been reached (>3.5). This is in agreement with 270
Figure 5 showing that Kd are similar in seawater regardless of salinity. This could also 271
explain the salinity threshold found by Ciffroy et al. (2003) and Bale (1987). 272
Care must thus be taken on desorption results obtained only with Na+ solution at high
273
concentrations which would lead to an overestimation of the amount of desorbed Cs due 274
to the absence of the inhibitive effect of K+.
275 276 277
3.2
Influence of the duration of the desorption phase
278 279
Studies performing experiments in the form of successive desorption (Sakaguchi 2018; 280
Berthail, 2015; Ouaniche, 1984; Yamasaki et al 2016) were not taken into account as 281
each time that a new desorption media is added, equilibrium is moved, allowing 282
additional Cs to be released. 283
Durations of desorption phase for RCs ranged between half an hour and 8 months. The 284
desorption was not more important by extending the experiment over one week (Takata 285
et al 2015), one month (Otosaka and Kobayashi, 2013) or two months (Standring et al. 286
(2002). Only Stanners & Aston (1982) found that the amount of released Cs is still 287
increasing after few days in their experiments. 288
The desorption phase for RCs.Lab.Fw ranged between ten minutes and ten days. The 289
five studies of RCs.Lab.Fw experiments looking at desorption over time showed a fast 290
increase of release within the first hours and then a plateau. The timescales of these five 291
studies differed and we integrated rate laws in order to compare the desorption rates 292
(Jannasch et al., 1988; Simonsen and Saetra, 2019). This approach assumes that trace 293
element uptake and release, including Cs, are the sum of a complex series of first order 294
reversible reactions (Okumura et al, 2018; Jannasch et al., 1988) . 295
Md and Ms being the metal in dissolved and solid phases, each reaction can be written as
296 : 297
→ !" 298
Each first-order reaction should verify the linearized equation : 299
300
− ln %& ' − ( )( ) − ( )*
*+ = (, - ,.). 0 (3)
301
where ( )* is the metal in dissolved phase at equilibrium and Mt the total metal in the
302
solid-liquid system. Demonstration of the equation is available in Simonsen and Saetra, 303
(2019) and Jannasch et al. (1988). 304
Plotting the left member of equation (3) in function of time provides the slope. 305
Because the number of experimental data points (n≈5) for each desorption studies was 306
too small, multiple linearization was not possible and the equation was derived only one 307
time for each experiments (16) with the available points. Observations ranged between 308
0.17 and 168 hours. One analytical curve by experiment is then plotted using 309
exponential transformation of equation (3).The 16 curves are presented in Figure 6. 310
311 312
The integration allows to define 3 cases (Figure 6): 313
• The equation was verified but a significant intercept (different from zero) exists
314
(7/16 experiments; black curves) 315
• The equation was not verified (slope not significant at 0.05 error) and a 316
significant intercept exists (7/16; dotted blue curves) 317
• The equation was not verified (2/16) and there is no significant intercept at 0.05
318
error (dotted red curves) 319
320
The significant intercept observed on 14 studies proves the existence of one or more 321
desorption processes at a timescale inferior to one hour (Jannasch et al., 1988). The 322
fraction of Cs released by these fast processes on the total released is 86 % ± 13 (mean of 323
the intercepts). The non-significant slopes (9/16; case 2 and 3) can be due to the fact that 324
an increasing number of data within the plateau relatively to those in the rising limb 325
minimizes the trend. 326
These observations lead to the conclusion that Cs desorption in this kind of experimental 327
design is governed by one or more processes on a timescale inferior to one hour releasing 328
in average 86% of the available Cs, and less frequently by an additional (or more) 329
reaction on timescales inferior to 7 days. This justify the use of at least two reactions for 330
an accurate representation of desorption process for timescales over one hour. 331
In modeling, these reactions are usually taken into account through two successive 332
desorption kinetics involving surficial and interlayer sites of clays, they have led to a 333
two box model (or more) used for both saltwater and freshwater (e.g. Comans and 334
Hockley, 1992). 335
The kinetic of the first reaction is given by the slope coefficient between time 0 (origin) 336
and the first point of measure. These overall rates (k1+k-1) obtained for the 16 studies
337
range between 1.10-4 and 1.10-3 s-1 (half-reaction time, t1/2, of 0.2 to 2 hours) similar to
338
those obtained in freshwater (Ciffroy et al., 2003; Benes et al., 1992; Comans and 339
Hockley, 1992). They are theoretically related to surficial sites. The second reaction, 340
theoretically related to interlayer sites, presents overall rates ranging between 5.10-6 and
341
1.10-5s-1 (half-reaction time of two days to one week) in seawater, half an order of
342
magnitude above those in freshwater (1.10-6 to 5.10-6); (Benes et al., 1992; Comans and
343
Hockley, 1992; Ciffroy et al., 2003). 344
These two reactions are considered to occur consecutively (Comans and Hockley, 1992; 345
Oughton et al., 1997; Ciffroy et al., 2001) or in parallel (Benes et al., 1992; Yamamoto et 346
al., 2015). Since the fast desorption rate of surficial Cs is usually two orders of 347
magnitude higher, most of the slowly released pool of Cs within interlayers must remain 348
available even if the reactions are in parallel. In any case, this difference is not so much 349
important for timescales inferior to one week and does not change the goodness of fit of 350
the models (Benes et al., 1992; Borretzen and Salbu, 2002). 351
352
3.3
Influence of the cesium distribution into particles prior to desorption
353 354
The existence of different sites with their own affinity for Cs implies that preliminar 355
distribution of cesium on these sites influences the quantities and the dynamics of 356
desorbed Cs. When plotting the values of Kd obtained after desorption in seawater from 357
experiment RCs.Lab.Fw in function of their Kd after adsorption in freshwater (8 studies; 358
Fig 7) we observe a positive and significant correlation (R²=0.43, p-value =2.10-14) and a
359
decrease by a factor 6 in seawater. This leads to the hypothesis that particles presenting 360
high affinity with cesium in freshwater (high Kd) partially keep this affinity in seawater. 361
Consequently, we investigated factors influencing cesium repartition on material and 362
consequences for desorption. 363
364
3.3.1 Influence of material:
365
Authors generally refer to three components as main absorbents for Cs+ with different
366
properties: 367
-strongly sorbing non-expansible 2:1 phyllosilicates such as micaceous mineral 368
(biotite) or illite with relatively low cation-exchange capacity (CEC) with high affinity 369
sites(Nakao et al., 2014). 370
-weakly sorbing expansible 2:1 phyllosilicate such as smectite with relatively high 371
CEC (Mckinley et al., 2001). 372
- organic matter with usually high CEC (Valcke and Cremers, 1994). 373
Since particles composition is a heterogeneous mixing of mineral and organic phases in 374
different proportions, we can expect a high spatio-temporal variability in the proportion 375
of available sites with their own capacity to sorb Cs. Such heterogeneity may explains 376
the discrepancies in distribution coefficients in freshwater between sites (Boyer et al., 377
2018; Takahashi et al., 2017). In the case where riverine particles directly reach the 378
coastal zone (small rivers, sea with no tides), the characteristics of the particles 379
regarding Cs fixation can be conserved in seawater, explaining the good relation of Fig 7. 380
The important role of the nature of particulate material is highlighted in RCs.Lab.Fw, by 381
the fact that two samples from the same river presents a similar desorption, even if they 382
were not collected at the same time. Ferrer (1983) and Ouaniche (1984) obtained 40% of 383
desorption in the Rhône river; Clanton (1968) and Reynolds and Gloyna (1964) also 384
obtained 40% in Guadalupe river. Ciffroy et al (2001) used two samples from the Loire 385
river collected over 6 months, and they found 60-80% of desorption for both. 386
387
3.3.2 Influence of the contamination process
388
Sites with high affinity (FES: Frayed Edge Site) contributes predominantly to Cs 389
sorption at low concentrations under 10-8M (Sawhney, 1970; Bradbury and Baeyens,
390
2000). However, they also present the lowest capacity (Nakao et al., 2014) and 391
constitutes only 0.25% of the CEC of the illite (Bradbury and Baeyens, 2000). Once these 392
sites are saturated, excess Cs goes to surficial sites with lower affinity. 393
Usually the particles spiked for the RCs.Lab.Fw experiment present higher activities 394
than those for RCs. This potentially results in a higher fraction of Cs in surficial sites, 395
more subject to a rapid remobilization. 396
Beyond that, an increase of solid-to-liquid ratio during the contamination phase leads to 397
a lower desorption. Onodera et al. (2017) found that the desorbed fraction of radiocesium 398
followed a negative power law with a ratio ranging from 0.17 g/L to 10 g/L during the 399
spiking phase. According to the authors, a larger number of strong adsorption sites were 400
available when the solid-to-liquid ratio was higher, leading to an increase of the fraction 401
of strongly adsorbed Cs onto particles and, as a result, desorption became more difficult. 402
Finally, it is possible that a longer contact time with the Cs solution decreases the 403
amount of extractable Cs from all sites (Okumura et al, 2018). 404
405
Comans and Hockley (1992) argued that radiocesium is able to migrate from basal 406
surface sites to interlayer sites and can be incorporated into the mineral as stable Cs. 407
This migration called “ aging effect” may impact its mobility; (Madruga and Cremers, 408
1997; Roig et al., 2007). This effect has been studied in a 1M Na+ solution only by Mukai
409
et al. (2018) on weathered biotites from Fukushima. They found that a sorption time 410
longer than one week decreased desorbed fraction from 90% to less than 10%, compared 411
to a one day or one weak sorption. Biotite sampled at the same site, containing 412
radiocesium post-Fukushima (RCs like experiment) desorbed the same amount of 413
radiocesium. However, it should be noted that this experiment was conducted at pH 4.5, 414
clearly different from those of seawater. 415
416
The aging effect has been more studied in experiments using freshwater for both the 417
adsorption and desorption phase. Ciffroy et al (2001) found that the fraction of Cs 418
released after 24 h decreases by a factor 2 when the duration of the contact time of the 419
sorption phase increases from 30 min to 100 hr. Benes et al (1992) also found that a 420
sorption phase of 5 and 21 days instead of 2 hours decreased the fraction of released Cs 421
by a factor 1.3 and 2 respectively. 422
From these experiments it seems that a longer sorption phase allows to fix Cs more 423
irreversibly, at least in freshwater media. These results could partly explain why the 424
desorption in RCs experiment is usually lower than for RCs.Lab.Fw and closer to SCs 425
experiment. Indeed the contact time for the samples used in RCs is longer because it 426
corresponds to the delay between the in-situ sample contamination and its desorption 427
once the particles are exposed to seawater. This longer delay facilitates Cs migration 428
into the mineral lattice with strong affinity. 429
430 431 432
4
Discussion
433 434
The objective of this review is to summarize data from literature in order to precise the 435
efficiency of Cs desorption processes into seawater medium. We show that results issued 436
from two main experimental designs may be used for that purpose. In the first design, 437
RCs, particles have been exposed to 134Cs or 137Cs in the field, whereas the second one,
438
RCS.Lab.Fw, concerns the desorption of radiocesium from particles spiked (134Cs or
439
137Cs) in laboratory and in freshwater media.
440 441
In the case of field exposition, most of the values of desorption fractions are around 3% 442
(figure 2), and this is valid for both radiocesium (RCs) and stable Cs (SCs). Furthermore, 443
any sample of particles collected in the environment consequently to a contamination by 444
137Cs or 134Cs (RCs experiment) released in 95% of cases one third or less of its
445
radiocesium (Figure 3). These results have to be compared with the value proposed by 446
IAEA for the proportion of desorbable Cs in coastal sediments: 20% (IAEA, 2004). Above 447
20% the figure 3 shows that a plateau is effectively reached, but this value is clearly 448
above the mode at 3% determined here. 449
Important points are that the efficiency of desorption (i.e. the fraction of Cs released) 450
does not depend on the duration of desorption, and that an increase of salinity does not 451
influence so much the desorbed fraction. 452
453
In RCs.Lab.Fw samples were highly contaminated and thus different mineral sites with 454
different sorption isotherms may have stored cesium, including those with low affinity. 455
Overall amount of released Cs is higher than for RCs experiment and could reach 456
sometime 87%. Usually, two kinetic rates are observed and 80% of equilibrium is 457
reached in one hour. A short duration of contamination reduces the “aging” effect 458
resulting in a consequent pool of easily released cesium. 459
Here, the percentages of desorbed Cs do not follow any regular distribution. 460
Experimental design RCs.Lab.Fw looks like an “ideal” case based on the fact that there 461
is “no aging”, no change in equilibrium between the fixation of Cs onto particles and 462
their arrival into brackish waters. However, it may correspond to the case were 463
suspended particles are contaminated in freshwater and rapidly reach the sea because of 464
short transit times in rivers. In this case, desorption could be as high as 80 %, and it is 465
not possible to predict it regarding the irregular distribution observed here. In case of an 466
accident, an evolution of the Cs desorbed may be thus expected with time, related to the 467
duration of transit of the particles between their contamination and the sea. 468
This desorption is also dependent on salinity until a certain threshold. Studies showed 469
that for salinity above 2, concentrations of K+ (5.10-5 M) and Na+ (0.027 M) are in theory
470
sufficient to desorb superficial Cs, but there was no change in desorption from 10 to 35 of 471
salinity. 472
473
The repartition of Cs onto different sites of the mineral may thus partly explains the 474
differences in desorbed Cs found between both experiments. The various proportions of 475
adsorption sites between samples plus a possible aging effect are an additional source of 476
variability. For each area of interest, we thus recommend to use a sample representative 477
of the site for the sorption/desorption experiments, in order to properly discuss the 478
dynamics of Cs transfer. 479
5
Conclusion
480
Desorption of radiocesium from contaminated particles was observed at any salinity 481
above 3, and the fraction desorbed ranges widely from 0 to 86%. For particles containing 482
radiocesium due to an environmental contamination, this range extends from 0 to 64 % 483
with a peak at 3%. Particles containing radiocesium issued from a contamination in 484
laboratory show higher values of Cs released and a reaction implying two first-order 485
kinetics. The first one is really short with a half-life reaction time about one hour, 486
whereas it is of a few days for the second one. These two parallel or successive reactions 487
must be related to sites with different affinity for Cs, and thus radiocesium distribution 488
on mineral prior to desorption is a key factor to take into account. 489
As a result, a two kinetic box-model calibrated for each site of interest is suitable to 490
predict more accurately desorbed cesium at the interface. However, these conceptual 491
models should be supported by recent developments on clay mineral structures and 492
avoid over parametrization. 493
494 495 496 497
REFERENCES 498
Bale, A.. (1987). The characteristics behaviour and heterogeneous chemical reactivity of estuarine 499
suspended particles.PhD report, University of Plymouth, 216 pp. 500
Benes, P., Cernik, M. and Lam Ramos, P. (1992). Factors affecting interaction of radiocesium with 501
freshwater solids. Journal of Radioanalytical and Nuclear Chemistry, I(2), 201–218. 502
Berthail, T. (2015). Détermination des phases porteuses et de la réactivité du 137Cs dans les 503
sédiments marins au large de la centrale de Fukushima. Master report, Ecole Nationale 504
Supérieure de Chimie de Lille, 47 pp. 505
Borretzen, P. and Salbu, B. (2002). Fixation of Cs to marine sediments estimated by a stochastic 506
modelling approach. Journal of Environmental Radioactivity, 61(1), 1–20.
507
https://doi.org/10.1016/S0265-931X(01)00107-2 508
Boyer, P., Wells, C. and Howard, B. (2018). Extended Kd distributions for freshwater environment, 509
Journal of Environmental Radioactivity, 192, 128–142.
510
https://doi.org/10.1016/j.jenvrad.2018.06.006 511
Bradbury, M.H. and Baeyens, B. (2000). A generalised sorption model for the concentration 512
dependent uptake of caesium by argillaceous rocks. Journal of Contaminant Hydrology, 42 (2-4), 513
141-163. 514
Ciffroy, P., Garnier, J.M. and Benyahya, L. (2003). Kinetic partitioning of Co, Mn, Cs, Fe, Ag, Zn and Cd 515
in fresh waters (Loire) mixed with brackish waters (Loire estuary): Experimental and modelling 516
approaches. Marine Pollution Bulletin, 46(5), 626–641. https://doi.org/10.1016/S0025-517
326X(02)00517-9 518
Ciffroy, P., Garnier, J.M. and Khanh Pham, M. (2001). Kinetics of the adsorption and desorption of 519
radionuclides of Co, Mn, Cs, Fe, Ag and Cd in freshwater systems: Experimental and modelling 520
approaches. Journal of Environmental Radioactivity, 55(1), 71–91.
521
https://doi.org/10.1016/S0265-931X(01)00026-1 522
Clanton. (1968). Sorption and release of strontium-89 and cesium-137 by recent sediments of the 523
guadalupe river of texas. PhD report, University of Texas at Austin, 80 pp. 524
Comans, R.N.J. and Hockley, D.E. (1992). Kinetics of cesium sorption on illite. Geochimica et 525
Cosmochimica Acta, 56(3), 1157–1164. https://doi.org/10.1016/0016-7037(92)90053-L 526
Davison, W., Spezzano, P. and Hilton, J. (1993). Remobilization of caesium from freshwater 527
sediments, Journal of Environmental Radioactivity, 19, 109–124. 528
Desai, D.V., Sathi, S.K. and K.C Pillai. (1994). Influence of major cations of sea water on the desorption 529
of 137Cs from marine sediments, Journal of Radioanalytical Nuclear Chemistry, 187 (3), 197– 530
205. 531
El-Assy, N.B., Fattah, A.T. and Essa, M.W.A. (1991). Adsorption-Desorption equilibria of some 532
radionuclides in sediment-sea water system. Journal of Radioanalytical and Nuclear Chemistry, 533
152 (1), 31-35 534
Eyrolle, F. and Charmasson, S. (2004). Importance of colloids in the transport within the dissolved 535
phase ( < 450 nm ) of artificial radionuclides from the Rhône river toward the Gulf of Lions ( 536
Mediterranean Sea ), Journal of Environmental Radioactivity, 72(3), 273–286.
537
https://doi.org/10.1016/S0265-931X(03)00178-4 538
Fan, Q., Tanaka, K., Sakaguchi, A., Kondo, H., Watanabe, N. and Takahashi, Y. (2014). Applied 539
Geochemistry Factors controlling radiocesium distribution in river sediments : Field and 540
laboratory studies after the Fukushima Dai-ichi Nuclear Power Plant accident. Applied 541
Geochemistry, 48, 93–103. https://doi.org/10.1016/j.apgeochem.2014.07.012 542
Ferrer, M.C. (1983) Etude expérimentale du comportement de huit radionucléides artificiels dans le 543
cours terminal du Rhône. PhD report Université de Bordeaux, 147 pp 544
Garcia-Sanchez, L. and Konoplev, A. V. (2009). Watershed wash-off of atmospherically deposited 545
radionuclides : a review of normalized entrainment coefficients, Journal of Environmental 546
Radioactivity, 100, 774–778. https://doi.org/10.1016/j.jenvrad.2008.08.005 547
Garnier-Laplace, J., Beaugelin-Seiller, K. and Hinton, T.G. (2011). Fukushima wildlife dose 548
reconstruction signals ecological consequences. Environmental Science and Technology, 45(12), 549
5077–5078. https://doi.org/10.1021/es201637c 550
IAEA. (2004). Sediment distribution coefficients and concentrations factors for biota in the marine 551
environment. Vienna, Tech-doc n°422, 95pp. 552
Jannasch, H.W., Honeyman, B.D., Balistrieri, L.S. and James W., M. (1988). Kinetics of trace element 553
uptake by marine particles. Geochimica et Cosmochimica Acta, 52(2), 567–577. 554
https://doi.org/10.1016/0016-7037(88)90111-1 555
Kakehi, S., Kaeriyama, H., Ambe, D., Ono, T., Ito, S. ichi, Shimizu, Y. and Watanabe, T. (2016). 556
Radioactive cesium dynamics derived from hydrographic observations in the Abukuma River 557
Estuary, Japan. Journal of Environmental Radioactivity, 153, 1–9.
558
https://doi.org/10.1016/j.jenvrad.2015.11.015 559
Kusakabe, M., Oikawa, S., Takata, H. and Misonoo, J. (2013). Spatiotemporal distributions of 560
Fukushima-derived radionuclides in nearby marine surface sediments. Biogeosciences, 5019– 561
5030. https://doi.org/10.5194/bg-10-5019-2013 562
Madruga, M.. and Cremers, A. (1997). Effet of ionic composition and temperature on the radiocesium 563
fixation in freshwater sediments. Water, Air, Soil Pollution, 99(1–4), 201–208. 564
Matishov, D., Matishov, G. and Kasatkina, N. (2006). 137-Cs exchange processes in the Azov Sea. 565
Proceedings of international conference in Monaco, Isotopes in Environmental Studies, 25-29 566
October 2004 567
Mattsson, S., & Moberg, L. Moberg, L. (Ed.). (1991). Fallout from Chernobyl and atmospheric nuclear 568
weapons tests Chernobyl in perspective. Swedish Radiation Protection Institute, Sweden:. 569
Mckinley, J.P., Zeissler, C.J., Zachara, J.M., Jeffrey Serne, R., Lindstrom, R.M., Schaef, H.T. and Orr, 570
R.D. (2001). Distribution and retention of 137Cs in sediments at the Hanford Site, Washington. 571
Environmental Science and Technology, 35(17), 3433–3441. https://doi.org/10.1021/es0018116 572
Mela, M.P. (1962). Fixation of ammonium by clay minerals in relation to some probable effect on the 573
vegetative development of plants. Soil Science, 93(3), 189–194. 574
Meybeck, M. and Moatar, F. (2014). Daily variability of suspended particulate concentrations and 575
yields and their effect on river particulates chemistry. Sediment Dynamics from the Summit to 576
the Sea, Louisiana, USA, 11–14 December 2014, (IAHS Publ. 367, 2014).
577
Mukai, H., Tamura, K., Kikuchi, R., Takahashi, Y., Yaita, T. and Kogure, T. (2018). Cesium desorption 578
behavior of weathered biotite in Fukushima considering the actual radioactive contamination 579
level of soils. Journal of Environmental Radioactivity, 190–191, 81–88.
580
https://doi.org/10.1016/j.jenvrad.2018.05.006 581
Nakao, A., Ogasawara, S., Sano, O., Ito, T. and Yanai, J. (2014). Radiocesium sorption in relation to 582
clay mineralogy of paddy soils in Fukushima, Japan. Science of the Total Environment, 469, 523– 583
529. 584
Naulier, M., Eyrolle-boyer, F., Boyer, P., Métivier, J. and Onda, Y. (2017). Particulate organic matter in 585
rivers of Fukushima : An unexpected carrier phase for radiocesiums. Science of the Total 586
Environment, 579, 1560–1571. https://doi.org/10.1016/j.scitotenv.2016.11.165 587
Okumura, M., Kerisit, S., Bourg, I.C., Lammers, L.N., Ikeda, T., Sassi, M., Machida, M. (2018). 588
Radiocesium interaction with clay minerals: Theory and simulation advances Post–Fukushima. 589
Journal of Environmental Radioactivity, 189, 135–145.
590
https://doi.org/10.1016/j.jenvrad.2018.03.011 591
Onishi, Y., Serne, R.., Arnold, E.., Cowen, C.. and Thompson, F.. (1981). Critical review : Radionuclide 592
Transport, Sediment Transport, and Water Quality Mathematical Modeling; and Radionuclide 593
Adsorption/desorption Mechanisms. Technical report, Battelle Pacific Northwest Labs, Richland, 594
WA (United States). 595
Onodera, M., Kirishima, A., Nagao, S., Takamiya, K., Ohtsuki, T., Akiyama, D. and Sato, N. (2017). 596
Desorption of radioactive cesium by seawater from the suspended particles in river water. 597
Chemosphere, 185, 806–815. https://doi.org/10.1016/j.chemosphere.2017.07.078 598
Otosaka, S. and Kobayashi, T. (2013). Sedimentation and remobilization of radiocesium in the coastal 599
area of Ibaraki, 70 km south of the Fukushima Dai-ichi Nuclear Power Plant. Environmental 600
Monitoring and Assessment, 185(7), 5419–5433. https://doi.org/10.1007/s10661-012-2956-7 601
Ouaniche, D. (1984). Influence de la matière organique sur la distribution de 4 radioéléments entre 602
les phases solubles et particulaires dans des milieux à salinité variable. PhD report, Université 603
Aix-Marseille, 151 pp. 604
Oughton, D.H., Børretzen, P., Salbu, B. and Tronstad, E. (1997). Mobilisation of 137Cs and 90Sr from 605
sediments: Potential sources to arctic waters. Science of the Total Environment, 202(1–3), 155– 606
165. https://doi.org/10.1016/S0048-9697(97)00112-5 607
Patel. (1978). Desorption of radioactivity from the nearshore sediment. Estuarine and Coastal Marine 608
Science, 221, pp. 49–58. 609
Reynolds and Gloyna. (1964). Uptake and release of radionuclides by stream sediments. Water 610
Pollution Control Federation, 36(3), 279–280. 611
Roig, M., Vidal, M., Rauret, G. and Rigol, A. (2007). Prediction of radionuclide aging in soils from the 612
Chernobyl and Mediterranean areas. Journal of Environmental Quality, 36(4), 943–952. 613
Sadaoui, M., Ludwig, W., Bourrin, F. and Raimbault, P. (2016). Controls , budgets and variability of 614
riverine sediment fluxes to the Gulf of Lions ( NW Mediterranean Sea ). Journal of Hydrology, 615
540, 1002–1015. https://doi.org/10.1016/j.jhydrol.2016.07.012 616
Sakaguchi, A., Chiga, H., Tanaka, K., Tsuruta, H. and Takahashi, Y. (2018). Estimation of desorption 617
ratios of radio/stable caesium from environmental samples (aerosols and soils) leached with 618
seawater, diluted seawater and ultrapure water. Geochemical Journal, 52(2), 187–199. 619
https://doi.org/10.2343/geochemj.2.0496 620
Sanial, V., Buesseler, K.O., Charette, M.A. and Nagao, S. (2017). Unexpected source of Fukushima-621
derived radiocesium to the coastal ocean of Japan. Proceedings of the National Academy of 622
Sciences, 201708659. https://doi.org/10.1073/pnas.1708659114 623
Sawhney, B.L. (1970). Potassium and Cesium Ion Selectivity in Relation to Clay Mineral Structure. 624
Clays and Clay Minerals 18, 47-52. 625
Sayers, A. (2007). Tips and tricks in performing a systematic review. British Journal of General 626
Practice, 57(538), 759. 627
Simonsen, M. and Saetra, O. (2019). Determination of transformation rates from sorption and 628
desorption measurement, Technical report, 10 pp. 629
Sposito, G., Skipper, N.T., Sutton, R., Park, S.H., Soper, A.K. and Greathouse, J.A. (1999). Surface 630
geochemistry of the clay minerals. Proceedings of the National Academy of Sciences of the 631
United States of America, 96(7), 3358–3364. https://doi.org/10.1073/pnas.96.7.3358 632
Standring, W.J., Oughton, D.. and Salbu, B. (2002). Potential Remobilization of 137 Cs , 60 Co , 99 Tc , 633
and 90 Sr from Contaminated Mayak Sediments in River and Estuary Environments. 634
Environmental Science and Technology, 36(11), 2330–2337. 635
Stanners, D.A. and Aston, S.R. (1982). Desorption of 106Ru, 134Cs, 137Cs, 144 Ce and 241 Am from 636
Intertidal Sediment Contaminated by Nuclear Fuel Reprocessing Effluents. Estuarine, Coastal 637
and Shelf Science, (14), 687–691. 638
Tagami, K. and Uchida, S. (2013). Seawater, Sediment-seawater Distribution Coefficient for 639
Radionuclides and Estimation of Radionuclide Desorption Ratio from Soil in Seawater. Japan 640
Society for Analytical Chemistry, 62(6), 527–533. 641
Takahashi, Y., Fan, Q., Suga, H., Tanaka, K. and Sakaguchi, A. (2017). Comparison of Solid-Water 642
Partitions of Radiocesium in River Waters in Fukushima and Chernobyl Areas. Scientific Reports, 643
1–11. https://doi.org/10.1038/s41598-017-12391-7 644
Takata, H., Hasegawa, K., Oikawa, S., Kudo, N., Ikenoue, T., Isono, R.S. and Kusakabe, M. (2015). 645
Remobilization of radiocesium on riverine particles in seawater: The contribution of desorption 646
to the export flux to the marine environment. Marine Chemistry, 176, 51–63. 647
https://doi.org/10.1016/j.marchem.2015.07.004 648
Tomczak, W., Boyer, P., Krimissa, M., Radakovitch, O. (2019). Kd distributions in freshwater systems 649
as a function of material type , mass- volume ratio , dissolved organic carbon and pH, Applied 650
Geochemistry, 105, 68–77. 651
Torstenfelt, B., Andersson, K. and Allard, B. (1982). Sorption of strontium and cesium on rocks and 652
minerals. Chemical Geology, 36, 123–137. 653
Trapeznikov, A., Aarkrog, A., Pozolotina, V., Nielsen, S. P., Trapeznikova, V., Yushkov, P., & Polikarpov, 654
G. (1995). Radionuclides in the Ob-Irtysh river region system and their contribution to pollution 655
of the Arctic. In P. Strand, & A. Cooke (Eds.), Environmental radioactivity in the Arctic (pp. 68-656
71). Østerås: Norwegian Radiation Protection Authority. 657
Valcke, E. and Cremers, A. (1994). Sorption-desorption dynamics of radiocaesium in organic matter 658
soils. The Science of the Total Environment, 157(C), 275–283. https://doi.org/10.1016/0048-659
9697(94)90590-8 660
Walling, D.. and He, Q. (1999). Improved Models for Estimating Soil Erosion Rates from Cesium-137 661
Measurements. Journal of Environmental Quality, 28(2), 611–622.
662
https://doi.org/jeq1999.00472425002800020027x 663
Wauters, J., Vidal, M., Elsen, A. and Cremers, A. (1996). Prediction of solid/liquid distribution 664
coefficients of radiocaesium in soils and sediments. Part two: A new procedure for solid phase 665
speciation of radiocaesium. Applied Geochemistry, 11(4), 595–599.
666
https://doi.org/10.1016/0883-2927(96)00028-5 667
Yamamoto, K., Tagami, K., Uchida, S. and Ishii, N. (2015). Model estimation of 137Cs concentration 668
change with time in seawater and sediment around the Fukushima Daiichi Nuclear Power Plant 669
site considering fast and slow reactions in the seawater-sediment systems. Journal of 670
Radioanalytical and Nuclear Chemistry, 304(2), 867–881. https://doi.org/10.1007/s10967-014-671
3897-0 672
Yamasaki, S., Imoto, J., Furuki, G., Ochiai, A., Ohnuki, T., Sueki, K., Utsunomiya, S. (2016). Radioactive 673
Cs in the estuary sediments near Fukushima Daiichi Nuclear Power Plant. Science of the Total 674
Environment, 551–552, 155–162. https://doi.org/10.1016/j.scitotenv.2016.01.155 675
Yamashiki, Y., Onda, Y., Smith, H.G., Blake, W.H., Wakahara, T., Igarashi, Y. Yoshimura, K. (2014). 676
radiocesium to the ocean from the largest Nuclear Power Plant. Scientific Reports, 1–7. 677
https://doi.org/10.1038/srep03714 678
Yin, X., Takahashi, H., Inada, Y. and Takeshita, K. (2016). Desorption of cesium ions from vermiculite 679
with sea water by hydrothermal process. Chemistry Letters, 45, 256–258. 680
https://doi.org/10.1246/cl.151045 681
Zachara, J.M., Smith, S.C., Liu, C., McKinley, J.P., Serne, R.J. and Gassman, P.L. (2002). Sorption of Cs+ 682
to micaceous subsurface sediments from the Hanford site, USA. Geochimica et Cosmochimica 683 Acta, 66(2), 193–211. https://doi.org/10.1016/S0016-7037(01)00759-1 684 685 686
Figures List
687Figure 1 : Locations of the sampling sites relative to the documents reporting results on 688
cesium desorption. The symbols refer to the sources of contamination of the particles 689
690
Figure 2 : Percentage of desorption distributions obtained for the 4 different 691
experimental designs (see text for details). The scheme in the top right corner 692
presents the classification of these designs. 693
Figure 3 : Cumulative frequency of cesium desorption percentage and its distribution for 694
experiment RCs 695
696
Figure 4 : Cumulative frequency of cesium desorption percentage and its distribution for 697
experiment RCc.Lab.Fw 698
699
Figure 5 : Distribution coefficent of radiocesium in function of salinity for different 700
experimental designs 701
702
Figure 6 : Compilation of kinetic trends for cesium desorption in seawater. See text for 703
the explanation of the different curves. 704
Figure 7 : Cs distribution coefficients (Kd) calculated after desorption in seawater Vs Kd 706
calculation after laboratory sorption. See Table 1 for involved studies. 707
708 709
Table List
710
Table 1 : main information of the studies compiled in this article 711
Figure 1 : Locations of the sampling sites relative to the documents reporting results on cesium desorption. The symbols refer to the sources of contamination of the particles. See Table 1 for references.
Figure 2 : Percentage of desorption distributions obtained for the 4 different experimental designs (see text for details). The scheme in the top right corner presents the classification of these designs.
Figure 3 : Cumulative frequency of cesium desorption percentage and its distribution for experiment RCs
Figure 4 : Cumulative frequency of cesium desorption percentage and its distribution for experiment RCs.Lab.Fw
Figure 5 : Distribution coefficient of radiocesium in function of salinity for different experimental designs
Figure 6 : Compilation of kinetic trends for cesium desorption in seawater. See text for the explanation of the different curves.
Figure 7 : Cs distribution coefficients (Kd) calculated after desorption in seawater Vs Kd calculation after laboratory sorption. See Table 1 for involved studies.
References Sample type Number of samples used in the study Desorption medium Experimental design Studies used for linearization Studies used for Freshwater Seawater Kd comparison
Origin of the data used in the study S C s R C s R C s . L a b . F w R C s . L a b . S w (Reynolds and Gloyna, 1964) Guadalupe river sediments 1 San Antonio bay water X X X Graphical extraction (Clanton, 1968) Guadalupe river sediments 1 San Antonio bay water X X X Graphical extraction (Cheng, 1968) Terrigenou s sediments Hokkaido 1 Japanese seawater X Graphical extraction (Ganguly et al., 1968) Bombay harbour sediments 1 Bombay harbour water X Provided (Robertson et al., 1972) Columbia river sediments 1 Pacific ocean water X Graphical extraction (Brisbin et al., 1974) Savannah river sediments 1 NaCl solution X Reported by Onishi et al., (1981) (Patel, 1978) Bombay harbour sediments 2 Bombay harbour water X Graphical extraction (Stanners and Aston, 1982) Ravenglass estuary sediments 1 Irish seawater X Calculation from activities (Evans et al., 1983) Savannah river pond sediments 2 NaCl solution X Provided (Ferrer, 1983) Suspended particles Rhône river 3 Artificial seawater X X X Graphical extraction (Ouaniche, 1984) Rhône sediments 2 Rade de Toulon water X X X Provided (Bale, 1987) Tamar estuary sediments 1 Manche seawater X X Graphical extraction (El-Assy et al., 1991) Suez canal sediments 1 Suez gulf water X X Graphical extraction (Davison et al., 1993) Esthwaite Water lake sediments 1 Artificial seawater X Provided (Desai et al., 1994) Bombay harbour sediments 1 Bombay harbour water X Provided (Kleinot, 1994) Tamar estuary sediments 1 Artificial seawater X Graphical extraction (Knapinsk a-Skiba et al., 1994) Baltic sea sediments 2 Gdansk Bay water X X Graphical extraction (Oughton et al., 1997) Kara sea sediments 4 Oslo Fjord water X X X Graphical extraction
and calculations from Kd (Fuhrmann et al., 2001) Kara sea sediments 1 Atlantic ocean water X Graphical extraction (Borretzen and Salbu, 2002) Stepovogo Fjord sediments 1 Kara seawater X Graphical extraction (Standring et al., 2002) Mayak ponds sediments 4 Artificial seawater X Calculation from activities
Table 1 : main information of the studies compiled in this article et al., 2002) sediments water (Ciffroy et al., 2003) Suspended particles Loire river 2 Atlantic ocean water X X X Graphical extraction
and calculations from Kd (Saengkul et al., 2013) Bang Pakong estuary sediments 2 Thaïland gulf water X Graphical extraction (Tagami and Uchida, 2013) Fukushima soil 1 Pacific ocean water X Provided (Otosaka and Kobayashi, 2013) Marine sediments Fukushima 2 Pacific ocean water X Graphical extraction (Fan et al., 2014) Abukama and Kuchibuto river sediments 4 Artificial seawater X X Graphical extraction
and calculations from Kd (Berthail, 2015) Nitta and Otta river sediments and Sellafield estuary sediments 3 Seawater (origin unspecified ) X Provided (Takata et al., 2015) Abukama, Tone, Kuji and Naka river sediments 12 Pacific ocean water X X Graphical extraction (Yamasaki et al., 2016) Kuma river sediments 1 Artificial seawater X Graphical extraction (Onodera et al., 2017) Suspended particles Abukama and Natsui rivers. 2 Artificial seawater, pacific ocean water and NaCl solution X X X Graphical extraction (Sakaguchi et al., 2018) Fukushima soil 1 Seawater nearby Kikajima island X X Calculation from activities