HAL Id: hal-03252700
https://hal.archives-ouvertes.fr/hal-03252700
Submitted on 8 Jun 2021
HAL is a multi-disciplinary open access
archive for the deposit and dissemination of
sci-entific research documents, whether they are
pub-lished or not. The documents may come from
teaching and research institutions in France or
abroad, or from public or private research centers.
L’archive ouverte pluridisciplinaire HAL, est
destinée au dépôt et à la diffusion de documents
scientifiques de niveau recherche, publiés ou non,
émanant des établissements d’enseignement et de
recherche français ou étrangers, des laboratoires
publics ou privés.
Testing the performance of dendroclimatic process-based
models at global scale with the PAGES2k tree-ring
width database
Jeanne Rezsöhazy, Fabio Gennaretti, Hugues Goosse, Joël Guiot
To cite this version:
Jeanne Rezsöhazy, Fabio Gennaretti, Hugues Goosse, Joël Guiot. Testing the performance of
dendro-climatic process-based models at global scale with the PAGES2k tree-ring width database. Climate
Dynamics, Springer Verlag, 2021, �10.1007/s00382-021-05789-7�. �hal-03252700�
(will be inserted by the editor)
Testing the performance of dendroclimatic
process-based models at global scale with the
PAGES2k tree-ring width database
Jeanne Rezsöhazy · Fabio Gennaretti · Hugues Goosse · Joël Guiot
Received: date / Accepted: date
Abstract Tree-rings are one of the most commonly used proxies for
recon-1
structing past climates at annual resolution. The climate information is
gen-2
erally deduced from tree-rings using statistical relationships, but the assumed
3
linearity and stationarity may be inadequate. Process-based models allow for
4
non-stationarity and non-linearity; however, many challenges are associated
5
with their application for global scale reconstructions. In this study, we aim
6
to test the feasibility of using the mechanistic model MAIDEN at the global
7
scale for paleoclimate data assimilation based reconstructions by applying it
8
to the PAGES2k tree-ring width database. We also compare its performance
9
with the simpler model VS-Lite, often used in global applications. Both
mod-10
els are skillful in terms of calibration and verification correlations for a similar
11
number of sites (63 and 64 for VS-Lite and MAIDEN, respectively). VS-Lite
12
tends to perform better for sites where the climate signal in tree-rings is strong
13
and clear. By contrast, MAIDEN’s performance is likely mostly limited by the
14
J. Rezsöhazy
Université catholique de Louvain (UCLouvain), Earth and Life Institute (ELI), Georges Lemaître Centre for Earth and Climate Research (TECLIM), Place Louis Pasteur, B-1348 Louvain-la-Neuve, Belgium
Aix Marseille University, CNRS, IRD, INRA, College de France, CEREGE, Aix-en-Provence, France
Tel.: +32 10 47 92 58
E-mail: [email protected] F. Gennaretti
Institut de recherche sur les forêts, UQAT, Amos, Québec, J9T 2L8, Canada H. Goosse
Université catholique de Louvain (UCLouvain), Earth and Life Institute (ELI), Georges Lemaître Centre for Earth and Climate Research (TECLIM), Place Louis Pasteur, B-1348 Louvain-la-Neuve, Belgium
J. Guiot
Aix Marseille University, CNRS, IRD, INRA, College de France, CEREGE, Aix-en-Provence, France
lack of data (for example, daily Gross Primary Production data or
pheno-15
logical timings) needed to accurately calibrate the model. However, when the
16
calibration is robust, both models reproduce well the observed link between
17
climate and tree-growth. In general, VS-Lite tends to overestimate the climate
18
signal in tree-rings compared to MAIDEN, which better reproduces the
mag-19
nitude of the climate signal on average. Our results show that both models
20
are complementary and can be applied at the global scale to reconstruct past
21
climates using an adequate protocol designed to exploit existing tree-ring data.
22
Keywords Ecophysiological modelling · Proxy system models ·
Dendrocli-23
matology · PAGES2k tree-ring database · Paleoclimate data assimilation
24
based reconstructions
25
1 Introduction
26
Studying past climates prior to the instrumental period requires the use of
in-27
direct records of climate variations from natural archives, commonly referred
28
to as proxies (Jones et al., 2009). Different projects and consortia have emerged
29
in recent years to improve global climate reconstructions using the
develop-30
ment of global multi-proxy databases spanning last millennium (PAGES 2k
31
Consortium, 2013; Wilson et al., 2016; Anchukaitis et al., 2017; PAGES 2k
32
Consortium, 2017; Tardif et al., 2019; Konecky et al., 2020). Among
avail-33
able records, tree-rings are one of the most commonly used proxies for
recon-34
structing past climates at high temporal (annual) resolution, due to their large
35
spatial coverage and availability (Fritts, 1976; Jones et al., 2009; Mann et al.,
36
2009; Wilson et al., 2016; Anchukaitis et al., 2017; Esper et al., 2018; Anderson
37
et al., 2019; St. George and Esper, 2019).
38
To make the link between climate and indirect observations of
paleocli-39
mate variations from proxies, proxy system models (PSMs; i.e. models that
40
simulate the development of measured variables, for example tree-ring width,
41
in response to a climate forcing; Evans et al., 2013; Dee et al., 2016) must be
42
used. Such models can be applied in the forward mode, for example to compare
43
proxy data directly with climate model simulations when these simulations are
44
used as inputs of the PSM. In the inverse mode, PSMs can reconstruct the
45
climate variations that produce the measured variables (Guiot et al., 2000;
46
Evans et al., 2013).
47
In the case of tree-growth proxy data (such as tree-ring width, hereafter
48
TRW, or density), the climate information is generally deduced on the
ba-49
sis of a statistical relationship calibrated over the instrumental period (Fritts,
50
1976; Cook and Kairiukstis, 1990; Fritts, 1991; Jones et al., 1998; Mann et al.,
51
1999, 2008). Therefore, many climate reconstructions of the period covered by
52
dendroclimatic data have been developed with linear regressions between
cli-53
mate variables and proxy records (Fritts, 1991; Jones et al., 1998; Mann et al.,
54
1999, 2008). This raises concern about the assumed linearity and stationarity
55
of the relationship deduced from the calibration (Briffa et al., 1998; Wilson and
56
Elling, 2004; Wilson et al., 2007; D’Arrigo et al., 2008; Guiot et al., 2014). A
complementary approach that has been expanded over the past decade is data
58
assimilation, which combines information from the physics of the system
in-59
cluded in climate models and indirect climate observations provided by proxy
60
data, such as TRW (e.g. Goosse et al., 2012; Franke et al., 2017; Steiger et al.,
61
2018; Tardif et al., 2019). So far, the studies using tree-ring proxy data with
62
data assimilation have focused on the use of statistical PSMs (i.e., univariate
63
or multiple linear regressions) to provide a large-scale reconstruction over the
64
past millennia (e.g. Tardif et al., 2019).
65
As a complement to statistical methods, the link between climate and
66
tree-ring proxy data can be established from process-based PSMs. Mechanistic
67
modelling of tree-growth dependency on climate explicitly states the processes
68
that govern the relationship between climate and tree-growth and allows for
69
non-stationarity and non-linearity (Guiot et al., 2014). While in
regression-70
based PSMs, tree-growth is assumed to be only dependent on the chosen
cli-71
mate target variables, mechanistic modelling introduces the influence of other
72
climate variables, for example atmospheric CO2 concentration. Additionally,
73
tree-ring-based reconstructions are often limited to sites where tree-growth is
74
driven by one limiting climatic factor. Yet, process-based tree-growth models
75
are able to extract a climate signal from tree-rings at sites where tree-growth is
76
driven by multiple climatic factors. Accordingly, they may expand the area of
77
dendroclimatic reconstructions to a wide range of regions away from extreme
78
growth environments (Breitenmoser et al., 2014; Babst et al., 2018). To date,
79
such models have only been used for local reconstructions (e.g. Boucher et al.,
80
2014). While global scale reconstructions are theoretically possible with a data
81
assimilation procedure including a process-based PSM, such models have only
82
been applied in a pseudo-proxy context (Dee et al., 2016; Acevedo et al., 2017;
83
Steiger and Smerdon, 2017). A further step would be to introduce such
mech-84
anistic models in the data assimilation procedure using actual proxy data to
85
possibly improve the quality of the reconstruction.
86
However, many challenges are associated with the use of process-based
87
tree-ring PSMs for global scale reconstructions. In particular, the inclusion of
88
complex biological processes, for example photosynthesis and carbon
alloca-89
tion, usually implies a cautious initialization and calibration of the model at
90
each particular site of interest, depending on the site environment or the tree
91
species. This information is not readily available at global coverage with the
92
necessary detail. Running and calibration time of such models can also be an
93
obstacle to their utilization.
94
Among the many available process-based dendroclimatic models, the
Vaganov-95
Shashkin-Lite model (VS-Lite; Tolwinski-Ward et al., 2011) has been used in
96
several paleoclimate studies (Breitenmoser et al., 2014; Lavergne et al., 2015;
97
Dee et al., 2016; Steiger and Smerdon, 2017; Seftigen et al., 2018; Fang and
98
Li, 2019). The model is not considered as fully mechanistic. Indeed, VS-Lite
99
does not include any explicit representation of tree-growth processes, but
re-100
lies instead on the principle of limiting factors (soil moisture and temperature;
101
Tolwinski-Ward et al., 2011) to mimic the response of tree-ring growth to
cli-102
mate conditions. The model has faced difficulties in simulating tree-growth
where the dependence on climate is not dominated by a limiting factor, such
104
as precipitation or temperature (Breitenmoser et al., 2014).
105
Process-based dendroclimatic models that describe more mechanistically
106
the response of proxy data to climate could overcome those limitations. Among
107
the complex mechanistic models (e.g. Misson, 2004; Dufrêne et al., 2005;
108
Vaganov et al., 2006; Drew et al., 2010), we will focus here on the model
109
MAIDEN (Modelling and Analysis In DENdroecology; Misson, 2004) that
110
explicitly includes biological processes and has the potential to be applied
111
at the global scale. Unlike VS-Lite, MAIDEN also takes into account
atmo-112
spheric CO2concentration as an input, allowing the user to consider the
non-113
stationary dependency of tree-growth on the recent exponential increase of
114
CO2 (Myhre et al., 2013; Boucher et al., 2014). Another important difference
115
between MAIDEN and VS-Lite is the theoretical basis of the models. VS-Lite
116
is a "sink" model in the sense that it only considers the climate constraints on
117
tree-rings (the carbon sink tissues at the tree-level; see Körner, 2015; Fatichi
118
et al., 2014, 2019). MAIDEN is a "source-sink" mechanistic model in the sense
119
that it first determines the carbon availability by modelling photosynthesis,
120
and second, it allocates the available carbon to the sink tissues based on
allo-121
cation and climate-dependent rules. Feedbacks between allocation and
photo-122
synthesis are also considered in MAIDEN. So far, MAIDEN has been applied
123
to the European temperate forests (Misson, 2004; Boucher et al., 2014), to
124
the Mediterranean forests (Gea-Izquierdo et al., 2015, 2017), to the eastern
125
Canadian taiga (Gennaretti et al., 2017) and to Argentine forests (Lavergne
126
et al., 2017). However, unlike VS-Lite, MAIDEN has not been applied at the
127
global scale yet, due to its level of complexity. In particular, the need for daily
128
climate data at high spatial resolution and for measurements of
ecophysiologi-129
cal variables to calibrate the model parameters represents the main limitation
130
for its systematic application in different regions. In Rezsöhazy et al. (2020), a
131
protocol has been developed to calibrate and apply MAIDEN automatically at
132
any site globally that contains TRW observations in the extratropical regions.
133
To date, the new protocol applying MAIDEN globally has not been
demon-134
strated. To this end, this study highlights the advantages and potential
limita-135
tions of using a process-based model like MAIDEN at the global scale. In the
136
future, such mechanistic PSM could be utilized for paleoclimate data
assimi-137
lation based reconstructions. Specifically, we perform a comparative analysis
138
of the performance of the simpler VS-Lite and the more complex MAIDEN
139
process-based models. Both models have been applied over the last century to
140
the global TRW data network of PAGES2k (PAGES 2k Consortium, 2017),
141
including 354 TRW records. Studies such as this which lend insight into the
142
mechanisms controlling tree-ring width and tree-growth elevate our ability to
143
extract meaningful climate information from tree-ring networks. This
informa-144
tion is required to improve our understanding of natural and forced decadal
145
climate variability, and to potentially improve reconstructions of past climate
146
variability.
147
First, we describe MAIDEN and VS-Lite in Sect. 2.1, as well as the TRW
148
data network (Sect. 2.2) and climate data (Sect. 2.3) used in this study.
The calibration (Sect. 2.4) and verification (2.5) procedure of both models
150
is then presented. The models are calibrated and applied to the PAGES2k
151
TRW database in Sect. 3.1. We provide explanations on the performance of
152
the models in Sect. 3.2. The ability of MAIDEN and VS-Lite to reproduce the
153
climate signal in tree-rings is then evaluated in Sect. 3.3 and, finally, the
impli-154
cations of including atmospheric CO2 concentration as an input of MAIDEN
155
are assessed in Sect. 3.4.
156
2 Material and Methods
157
2.1 Tree-growth models
158
2.1.1 MAIDEN
159
MAIDEN (Misson, 2004; Gea-Izquierdo et al., 2015; Gennaretti et al., 2017)
160
is a complex tree-growth model that explicitly includes biological processes
161
(photosynthesis and carbon allocation to different tree compartments) to
sim-162
ulate, among other outputs, the annual quantity of carbon allocated to the
163
stem. This key variable is hereafter referred to as Dstem, in grams of carbon
164
per square meter of stand per year. In this study, Dstem is assumed to be
pro-165
portional to tree-ring growth so as to compare it with TRW observations. The
166
model runs on a daily basis with maximum and minimum air temperature,
167
cumulative precipitation and atmospheric CO2 concentration as inputs.
168
In this study, we use a combined version of the model from Gea-Izquierdo
169
et al. (2015) (initially developed for Mediterranean forests; hereafter GI2015)
170
and Gennaretti et al. (2017) (initially developed for boreal tree species;
here-171
after Ge2017) developed by Fabio Gennaretti (unpublished) that gives the
172
possibility to switch between those two versions. The versions from GI2015
173
and Ge2017 only differ in some mechanistic rules used in the photosynthetic
174
and allocation modules, but they are identical otherwise. The structure of
175
the MAIDEN model is provided online (https://figshare.com/articles/
176
MAIDEN_ecophysiological_forest_model/5446435/1, last access: 16 May
177
2020) and its modules are available upon request.
178
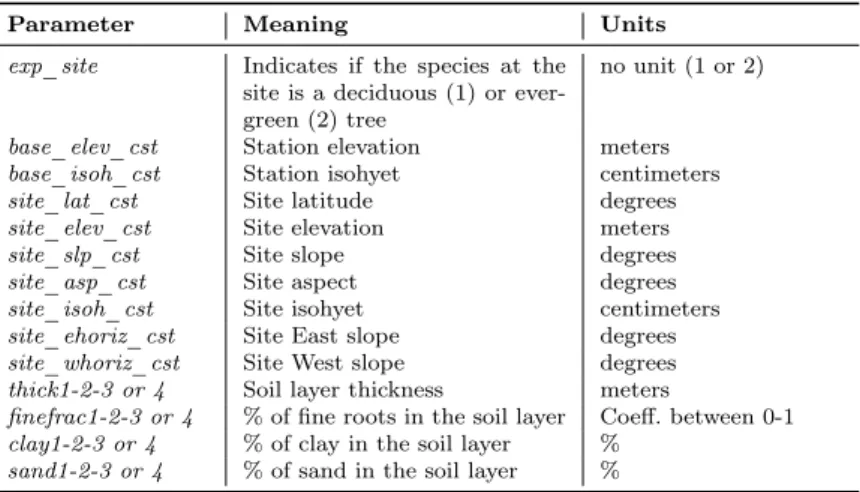
The model includes constants to describe the conditions at the tree-ring
179
observations site and the climate station (Table S1). As in Rezsöhazy et al.
180
(2020), the constants are derived from observations. However, slope and
as-181
pect constants are set to zero, as we do not have the field knowledge needed to
182
extract the information from a Digital Elevation Model. MAIDEN includes
183
a four-layer soil module (1-15cm; 15-30cm; 30-65cm; 65-100cm) for which
184
we have to provide the main characteristics (clay and sand fractions;
Ta-185
ble S1). The soil characteristics are obtained from the Harmonized World
186
Soil Database (hereafter HWSD) v1.2 at a 30 arc-second spatial resolution
187
(FAO/IIASA/ISRIC/ISSCAS/JRC, 2012), as in Rezsöhazy et al. (2020).
2.1.2 VS-Lite
189
The Vaganov-Shashkin Lite model (Tolwinski-Ward et al., 2011) is a
sim-190
ple tree-growth model that simulates a unitless annual tree-growth increment
191
based on latitude, monthly cumulative precipitation and average
tempera-192
ture of the study site as inputs. It is based on the limiting factors principle
193
(temperature and soil moisture) and on the use of threshold growth response
194
functions. VS-Lite is derived from the full process-based Vaganov-Shashkin
195
model (Vaganov et al., 2006) that has been developed to explicitly quantify
196
the influence of climate and environmental variables on tree-ring formation.
197
While the full model is a two-block model, i.e. a block with cell growth,
di-198
vision and multiplication in the cambium and a growth block based on the
199
limiting factor principle, the Lite version just uses the second block.
200
2.2 PAGES2k tree-ring width data
201
The PAGES2k working group aims to reconstruct the climate of the last two
202
millennia based on proxy records (PAGES 2k Consortium, 2017). Their
com-203
munity database contains 692 temperature-sensitive proxy records from
differ-204
ent archives (trees, ice, sediment, coral, speleothems, documentary evidence,
205
and other archives), among which 354 TRW time series are of interest for our
206
work (PAGES 2k Consortium, 2017). We were able to retrieve the species
in-207
formation needed to run MAIDEN at 307 sites. Time series ending before 1979
208
were excluded to allow for a long enough calibration period (at least 30 years
209
starting from 1950, Sect. 2.4), leaving 302 TRW time series for our analysis
210
(Fig. 1). The resulting TRW network covers a large range of environmental
211
conditions and tree species (evergreen and deciduous), but is mostly located
212
in the Northern Hemisphere, specifically in North America and Asia. As a
213
consequence, the TRW network is dominated by cold and dry sites (Fig. S1).
214
The tree-ring proxy records in the PAGES2k database have been specifically
215
selected for their local sensitivity to temperature (PAGES 2k Consortium,
216
2017). However, correlations with other environmental variables can be
signif-217
icant as well, for example with precipitation, and a gradient of environmental
218
sensitivity is thus obtained (water limited sites, temperature limited sites or
219
unclear limiting factor). This can be illustrated by the comparison of the
cor-220
relations of TRW observations with annual cumulative precipitation against
221
the correlations with mean annual temperature over 1901-2000 (Fig. S2). A
222
wide range of values in the correlations is observed with both variables, with
223
the mean being slightly higher for temperature (0.07 mean correlation,
com-224
pared to 0.05 for precipitation). TRW data are available online (PAGES 2k
225
Consortium, 2017).
60°S
30°S
0°
30°N
60°N
120°W60°W 0° 60°E 120°E
Fig. 1 PAGES2k (PAGES 2k Consortium, 2017) tree-ring width sites used in this study (302 sites). Background map from Hunter (2007).
2.3 Climate data
227
Daily climatic inputs are needed to run MAIDEN (Sect. 2.1.1) while
VS-228
Lite needs monthly climate inputs (Sect. 2.1.2). In this study, we use the
229
Global Meteorological Forcing Dataset for land surface modelling (v2) (http:
230
//hydrology.princeton.edu/data.php, last access: 13 March 2020; Sheffield
231
et al., 2006) at 0.5◦ resolution over the 1901-1949 and 1950-2000 time
peri-232
ods. Daily maximum and minimum temperature and daily cumulative
pre-233
cipitation were extracted for MAIDEN from the grid cell closest to each
in-234
dividual site. Daily mean temperature and cumulative precipitation were
av-235
eraged and summed, respectively, for VS-Lite at a monthly time step.
An-236
nual atmospheric CO2concentration data are from Sato and Schmidt (https:
237
//data.giss.nasa.gov/modelforce/ghgases/, last access: 6 January 2020)
238
and were linearly interpolated at a daily time step. Note that for the
South-239
ern Hemisphere climate data start in July instead of January to match the
240 seasonality of tree-growth. 241 2.4 Calibration 242 2.4.1 MAIDEN 243
A protocol has been developed in Rezsöhazy et al. (2020) to calibrate MAIDEN
244
in a systematic and automatic way following a Bayesian procedure with Markov
245
Chain Monte Carlo sampling using the DREAMzs algorithm (Hartig et al.,
246
2019). Because we are working with the two versions of MAIDEN here
(Gea-247
Izquierdo et al., 2015; Gennaretti et al., 2017), the procedure has been adapted
to the version from Gea-Izquierdo et al. (2015), that was not used in
Rezsö-249
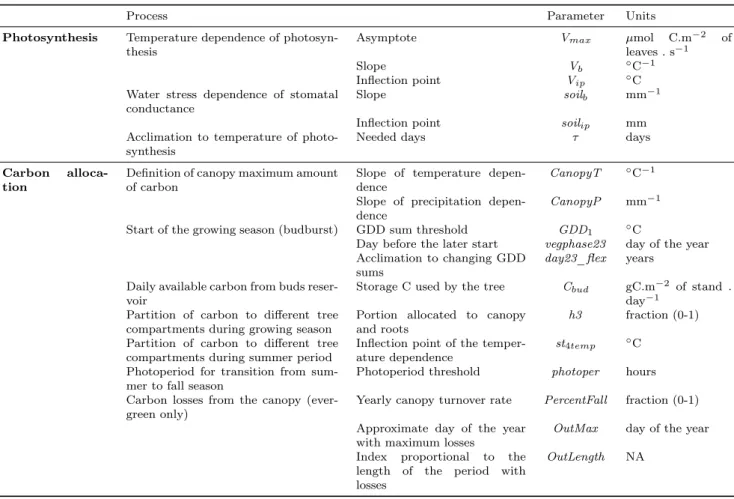
hazy et al. (2020). The Bayesian procedure allows for calibration of the most
250
sensitive parameters of the model. This includes parameters influencing the
251
simulated stand growth primary production or GPP (6 parameters in the
252
Ge2017 version and 5 parameters in the GI2015 version) and parameters
in-253
fluencing the simulated daily quantity of carbon allocated to different tree
254
compartments (12 parameters in the Ge2017 version and 13 parameters in
255
the GI2015 version). Those parameters are referenced hereafter as
photosyn-256
thesis and carbon allocation parameters, respectively. The calibration starts
257
from prior distributions, assumed to be uniform over an acceptable range, to
258
produce posteriors for each of the 18 calibrated parameters. It is based on
259
the comparison between the normalized (i.e. with a null mean and a standard
260
deviation of 1) simulated annual quantity of carbon allocated to the stem or
261
Dstem and normalized observed TRW time series. Tables S2 and S3 give the
262
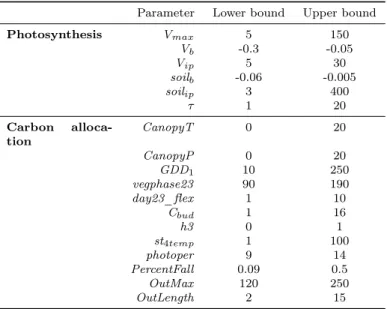
definition of each calibrated parameter for both versions. The ranges of the
263
parameters are available for both versions in Tables S4 and S5.
264
Ideally, photosynthesis parameters should be calibrated by comparing
sim-265
ulated against observed GPP instead of simulated Dstem against observed
266
TRW and prior ranges would have been more informative for each species
267
or biome (Misson, 2004; Danis et al., 2012; Gea-Izquierdo et al., 2015, 2017;
268
Gennaretti et al., 2017; Lavergne et al., 2017). However, this is not possible
269
here as the information is lacking for the majority of sites. Furthermore, the
270
tree-growth index simulated by MAIDEN, which is derived from the annual
271
quantity of carbon allocated to the stem, is not directly comparable to TRW
272
without standardization. We are thus unable to both calibrate the variance and
273
evaluate the error variance of tree-growth (Rezsöhazy et al., 2020). Information
274
is thus missing to guide the Bayesian calibration towards a biologically
plausi-275
ble set of parameters. For example, we miss information to properly constrain
276
phenology. Consequently, the selection of parameters for our simulations has
277
been slightly updated compared to Rezsöhazy et al. (2020). The set of
photo-278
synthesis parameters with the highest posterior (Maximum a posteriori value
279
or MAP; Hartig et al., 2019) is selected as in Rezsöhazy et al. (2020). The
car-280
bon allocation parameters are then calibrated as in Rezsöhazy et al. (2020).
281
In addition, after the calibration procedure, the model is iteratively run over
282
the top 10% carbon allocation parameters. The photosynthesis parameters are
283
fixed at their calibrated values. To avoid unrealistic growth period lengths, a
284
parameter set which simulates a growth period of less than 20 days for each
285
year of the calibration period (hereafter, phenological criterion) is excluded.
286
At the end of the iterations, we keep the set of parameters with the highest
287
likelihood. Note that if none of the parameter sets meet the phenological
cri-288
terion, the MAIDEN calibration is considered as non-valid for this site with
289
the forcing used.
290
MAIDEN was calibrated at the TRW sites with at least 30 TRW
observa-291
tions available over the 1950-2000 period, using the climate data described in
292
Sect. 2.3. For simplicity, the calibration period will be referred to as 1950-2000.
2.4.2 VS-Lite
294
The Bayesian approach proposed in Tolwinski-Ward et al. (2013) was used to
295
calibrate the four VS-Lite parameters linked to the growth response (lower
296
and upper temperature and soil moisture thresholds of the model; T1and T2,
297
and M1 and M2, respectively, in Tolwinski-Ward et al., 2011). This Bayesian
298
approach is based on a standard Markov Chain Monte Carlo method to
sam-299
ple the posterior distribution, i.e., a Metropolis-Hastings algorithm embedded
300
within a Gibbs sampler. Default values were given to the other parameters
301
(six soil moisture parameters and two integration window parameters) as
pro-302
vided in the standard version of the model code (https://www.ncei.noaa.
303
gov/pub/data/paleo/softlib/vs-lite/, last access: 16 March 2021).
304
VS-Lite was optimized at the 302 TRW sites over the same time period as
305
MAIDEN and using the climate dataset described in Sect. 2.3.
306
2.5 Verification
307
Both models were tested over the 1901-1949 time period, with the same climate
308
data as described in Sect. 2.3. Models were run over the verification period
309
using the parameters calibrated over the 1950-2000 time period as in Sect. 2.4.
310
Pearson correlation coefficients and their corresponding confidence levels were
311
calculated at each site between simulated tree-ring indexes from MAIDEN or
312
VS-Lite and observed TRW on both the calibration and the verification time
313
periods.
314
3 Results
315
Section 3.1 assesses and compares the general performance of both VS-Lite
316
and MAIDEN models with respect to calibration (Sect. 2.4) and independent
317
verification (Sect. 2.5), in order to determine the sites with the best
perfor-318
mance. Section 3.2 explains the performance of both models, by focusing on its
319
relationship with different environmental characteristics, such as climate and
320
tree leaf traits. Section 3.3 evaluates the ability of both PSMs to reproduce
321
the climate signal recorded in tree-rings, and then their potential for
paleocli-322
mate data assimilation based reconstructions. Finally, Section 3.4 assesses the
323
effect of CO2 concentration in the MAIDEN model with a sensitivity analysis.
324
3.1 Applying MAIDEN and VS-Lite to the PAGES2k TRW sites
325
Substantial challenges arose in the calibration of MAIDEN. In particular, at
326
some sites, we were unable to properly set phenology due to the lack of
informa-327
tion available for calibration (Sect. 2.4.1). From all 302 calibration experiments
328
(Sect. 2.4.1), 113 sites for Ge2017 and 142 sites for GI2015 were excluded based
329
on the phenological criterion (Sect. 2.4.1). The remaining sites (189 sites for
Ge2017 and 160 sites for GI2015) will be referred to as MAIDEN selected sites.
331
All the analyses for MAIDEN are performed on these selected sites. From all
332
calibration (Sect. 2.4.1) and verification (Sect. 2.5) experiments for both
ver-333
sions (Gea-Izquierdo et al., 2015; Gennaretti et al., 2017) of MAIDEN (Figs.
334
S3 – S6), we consider a site as well-fitted only if the following conditions are
335
fulfilled, whatever the model version used: (i) a significant (at the 95%
con-336
fidence level) calibration (1950-2000) and verification (1901-1949) correlation
337
≥ 0.3; (ii) a growth period length of at least 20 days for each year of the
cali-338
bration (Sect. 2.4.1) and verification period. If conditions are fulfilled for both
339
versions, the version leading to the highest verification correlation at the site
340
is kept. Based on these criteria, we retained 64 well-fitted sites (Fig. 2a).
341
For VS-Lite (Sect. 2.4.2 and 2.5; Figs. S7 and S8), the condition for
retain-342
ing a site is also to have a significant (at the 95% confidence level) calibration
343
(1950-2000) and verification (1901-1949) correlation ≥ 0.3. As for MAIDEN,
344
VS-Lite simulated time series were checked for consistency as correlation is
345
not able to account for all artefacts in simulated chronologies. Two sites were
346
considered as invalid since estimated tree-growth indexes were found constant
347
(no growth) for more than 10 successive years. Based on these criteria, we
348
retained 63 well-fitted sites (Fig. 2b).
349
Considering the loss of correlation from calibration to verification, VS-Lite
350
appears more stable than MAIDEN (Fig. 3, see Fig. S9 for by-site correlations).
351
Calibrating MAIDEN at the global scale without overfitting is indeed a
chal-352
lenge. The mean calibration and mean verification correlations for MAIDEN
353
are 0.68 (with a standard deviation of 0.10) and 0.43 (0.10) respectively, and
354
0.49 (0.14) and 0.43 (0.11) for VS-Lite. 18 well-fitted sites are in common
355
between VS-Lite and MAIDEN (Fig. 4). On average, verification correlations
356
are 0.47 for MAIDEN and 0.48 for VS-Lite with a standard deviation of 0.10
357
and 0.14 respectively. MAIDEN and VS-Lite are skillful at a similar
num-358
ber of mostly different sites, spread all over the globe. The reasons behind
359
their performance are consequently also different and will be addressed in the
360
next section. However, at the common sites, their respective performances are
361
equivalent.
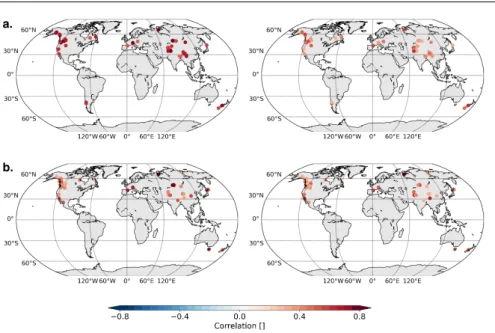
a.
b.
Fig. 2 (a) MAIDEN (64 sites) and (b) VS-Lite (63 sites) calibration (left) and verification (right) correlations for well-fitted sites (Sect. 3.1). All correlations are significant at the 95% confidence level. Background maps from Hunter (2007).
0.0 0.2 0.4 0.6 0.8 1.0 MAIDEN Correlation Calib. Valid. 0.0 0.2 0.4 0.6 0.8 1.0 VS−Lite Correlation Calib. Valid. a. b.
Fig. 3 (a) MAIDEN (64 sites) and (b) VS-Lite (63 sites) calibration (1950-2000) and ver-ification (1901-1949) correlations (all significant at the 95% confidence level) boxplots for well-fitted sites (Sect. 3.1).
Correlation
Arc_079 Asi_022 Asi_024 Asi_190 Asi_192 Asi_198 Asi_206 Aus_005 Eur_006 Eur_009
NAm_029 NAm_059 NAm_089 NAm_135 NAm_142 NAm_146 NAm_153 NAm_176
0 0.2 0.4 0.6 0.8 1 MAIDEN VS−Lite
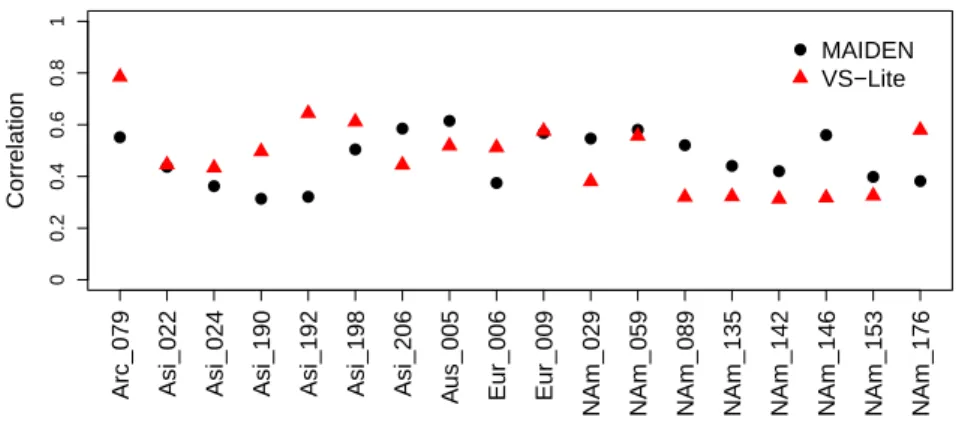
Fig. 4 MAIDEN and VS-Lite verification (1901-1949) correlations (all significant at the 95% confidence level) for common well-fitted sites (Sect. 3.1) (18 sites, with names from the PAGES2k database: NAm for North American sites; Asi for Asian sites; Eur for European sites; Arc for Arctic sites; Aus for Australian, Tasmanian or New Zealand sites; SAm for South American sites).
3.2 Explaining the performance of VS-Lite and MAIDEN
363
In this section, we want to understand the underlying factors driving the
per-364
formance of both models. We focus on two site characteristics: tree leaf traits
365
and climate. The relationship between models performance and altitude,
lati-366
tude or calibration period length (ranging from 30 to 51 years) was also checked
367
but none of these variables were found to be a significant driver of models skill.
368
We are here considering all calibrated sites (Sect. 2.4), irrespective of whether
369
they were identified as well-fitted in the previous section or not.
370
Verification correlations as a function of tree leaf traits (deciduous or
ev-371
ergreen) are shown on Fig. 5 for both versions of MAIDEN and for VS-Lite.
372
VS-Lite performance (Fig. 5c) does not seem to be influenced by leaf trait, with
373
an average correlation of 0.184 and 0.221 for deciduous and evergreen trees
374
respectively. 13 sites out of 63 well-fitted sites are deciduous which is
com-375
parable to the proportion of deciduous sites in the PAGES2k TRW database
376
(64 deciduous out of 302 sites, i.e. around 20%). For MAIDEN (Fig. 5a and
377
b), verification correlations are also very close on average for deciduous (0.073
378
for GI2015 and 0.101 for Ge2017) and evergreen trees (0.087 for GI2015 and
379
0.113 for Ge2017). However, there is a low proportion of deciduous trees for
380
Ge2017 (Fig. 5b) that passes the phenological criterion for the calibration
de-381
scribed in Sect. 2.4.1 (9 out of 64 sites) compared to evergreen trees (180 out
382
of 238 sites). Conversely, this proportion is far higher for GI2015 (36 sites out
383
of 64; Fig. 5a) and comparable to evergreen trees (124 sites out of 238).
Be-384
sides, seven sites out of 64 well-fitted sites are deciduous which is less than the
385
proportion of deciduous sites in the PAGES2k TRW database (64 out of 302
sites). Only one deciduous well-fitted site is simulated by Ge2017, and six by
387
GI2015. A possible reason is that only the version from Gea-Izquierdo et al.
388
(2015) has already been applied to deciduous trees sites (Quercus Pyrenaica;
389
Gea-Izquierdo et al., 2017). Consequently, we were able to use the
initializa-390
tion parameters already applied to deciduous trees in this version solely. The
391
version from Gennaretti et al. (2017) has never been specifically calibrated
392
for deciduous trees and some initialization parameters are likely not adapted
393
in that case. This exemplifies the fact that the calibration and initialization
394
of MAIDEN are probably the main obstacles for a better performance of the
395
model at the global scale.
396
To study the influence of climate on the performance of both models, we
397
focus on different climate indicators: cumulative October to September
pre-398
cipitation, annual mean temperature and mean July-August-September
tem-399
perature. In general, correlations of climate indicators with verification scores
400
at all sites are low and not significant for both VS-Lite and MAIDEN (Table
401
S6). This means that the performance of both models does not depend
primar-402
ily on the mean climate at a site. Another hypothesis to test is whether the
403
models perform better for sites where tree-ring growth is strongly controlled
404
by climate. To this end, we compare the correlations between climate
vari-405
ables and observed TRW to the verification correlations (Table 1). Since none
406
of the correlations in Table 1 are significant (p-value < 0.05) for MAIDEN,
407
its performance does not rely significantly on tree-growth correlation with
408
climate. On the contrary, VS-Lite performance shows a higher dependency
409
on tree-growth correlation with climate, especially temperature (Table 1).
In-410
deed, all correlations between the tree-growth relationship with climate and
411
verification scores for VS-Lite are significant and particularly high for annual
412
(0.467) and July-August-September (0.506) temperature. We obtain the same
413
result for VS-Lite when the analysis is restricted to the MAIDEN selected
414
sites (Sect. 2.4.1) (Table S7). This dependence of VS-Lite performance to the
415
presence of a strong climate driver of tree-growth is consistent with what has
416
been highlighted in Breitenmoser et al. (2014). It is likely due to the
struc-417
ture of VS-Lite on itself (Sect. 2.1.2), as tree-growth directly depends on the
418
identified limiting climatic factor (temperature or soil moisture) at the site
419
in the model. VS-Lite tends to be better where tree-growth is predominantly
420
driven by climate, which can be limiting for its application in many regions of
421
the world away from the treeline environments (for example high-altitude or
422
high-latitude environments), often not considered for paleoclimate
reconstruc-423
tion (Breitenmoser et al., 2014; Babst et al., 2018). Conversely, in MAIDEN,
424
multiple biological processes shape the links that exist between climate and
425
tree-growth. This potentially brings a better suitability of MAIDEN to work in
426
a larger range of environments than VS-Lite, where the relationship between
427
climate and tree-growth is more complex.
Correlation decid. evergr. − 0.5 0.0 0.5 1.0 28(64) 114(238) Correlation decid. evergr. − 0.5 0.0 0.5 1.0 55(64) 58(238) Correlation decid. evergr. − 0.5 0.0 0.5 1.0 a. b. c.
Fig. 5 Verification correlations, mean and standard deviation by tree types (deciduous or evergreen) for the MAIDEN version of GI2015 (a) and Ge2017 (b), for selected sites (160 sites for GI2015 and 189 for Ge2017, Sect. 2.4.1; others have been put to 1; the number of sites that have been put to 1 is indicated by category with the total number of sites in each category in brackets) and VS-Lite, for all 302 sites (c).
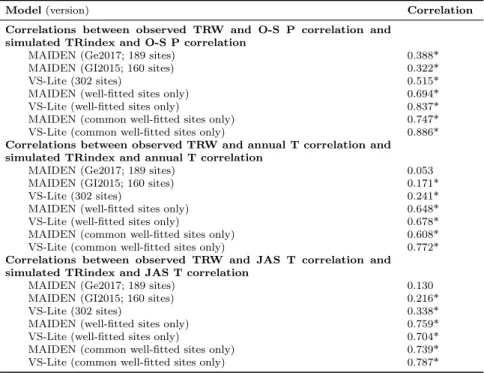
Table 1 Pearson correlations between correlations of observed TRW with different climate indicators and MAIDEN or VS-Lite verification correlations (1901-1949). O-S stands for the year starting from October (previous year) to September (current year); P for precipitation; JAS for July-August-September; T for temperature. Asterisks stand for significant corre-lations (p-value < 0.05). The difference in the number of sites on which correcorre-lations are computed is due to the phenological criterion that has been applied to MAIDEN calibrated sites (see Sect. 2.4.1 for more details).
Model (version) Correlation
Correlations between observed TRW and O-S P correlation and verification correlation
MAIDEN (Ge2017; 189 sites) 0.114
MAIDEN (GI2015; 160 sites) 0.155
VS-Lite (302 sites) 0.149*
Correlations between observed TRW and annual T correlation and verification correlation
MAIDEN (Ge2017; 189 sites) 0.074
MAIDEN (GI2015; 160 sites) 0.059
VS-Lite (302 sites) 0.467*
Correlations between observed TRW and JAS T correlation and verification correlation
MAIDEN (Ge2017; 189 sites) -0.039
MAIDEN (GI2015; 160 sites) -0.097
VS-Lite (302 sites) 0.506*
3.3 Assessing the ability of MAIDEN and VS-Lite to reproduce climate
429
relationship with tree-growth
430
One of the ultimate purposes of PSMs like VS-Lite and MAIDEN is to be
431
used to reconstruct past climates, for example by including them in a data
assimilation procedure (Evans et al., 2013; Dee et al., 2016). Therefore, we
433
have to assess if these models are able to reproduce well the climate signal
434
recorded in TRW. In the previous section, we established if the models ability
435
to reproduce tree-growth depends on the presence of a strong climate signal
436
recorded in the tree rings. In this section, we want to evaluate if the simulated
437
climate signal, whatever its predominance, is consistent with its recording by
438
tree-ring indexes. This is based on the comparison of the correlations of
dif-439
ferent climate indicators with tree-growth in simulations and in observations:
440
firstly, by means of scatterplots (Figs. 6, 7 and 8) and secondly, by means of
441
correlations (Table 2).
442
For MAIDEN (Figs. 6 and 7), over- and underestimations of the climate
443
dependencies of tree-growth are more balanced than for VS-Lite (Fig. 8) as
444
the dots in the scatterplots tend to spread more equally around and are closer
445
to the 1:1 line, particularly for temperature. Conversely, the scatterplots of
446
VS-Lite (Fig. 8) show a stronger overestimation of the climate dependency of
447
tree-growth at most sites, as most of the dots are far above the diagonal. This
448
bias is particularly large for temperature. Indeed, for VS-Lite, the correlation
449
for mean annual temperature is overestimated by more than 0.4 at 43% of
450
the sites (12% for GI2015 and 18% for Ge2017), at 47% of the sites for mean
451
July-August-September temperature (7% for GI2015 and 13% for Ge2017),
452
and at 28% of the sites for October-September cumulative precipitation (17%
453
for GI2015 and 12% for Ge2017). The same conclusion is still valid for VS-Lite
454
when we restrict the analysis to the MAIDEN selected sites (Sect. 2.4.1) (Figs.
455
S10–S15). This overestimation of the climate signal enhanced by the model is
456
a crucial feature to consider when using such PSMs in paleoclimatology, as
457
it can lead to biased climate reconstruction. Again, the structure of VS-Lite
458
is likely responsible for the overestimation of the climate influence on
tree-459
growth as tree-growth is not driven by any other internal or external drivers
460
than limiting climatic factors. The very high correlations (r>0.7) between the
461
VS-lite simulations and basic climate indicators on Fig. 8 at many sites
indi-462
cate the simplicity of the climate dependence of tree-growth in this PSM. In
463
MAIDEN, many biological processes are in play to frame the climate
depen-464
dence of tree-growth. MAIDEN uses different functional rules specific to the
465
ongoing phenological phase to allocate at a daily time step the available carbon
466
from photosynthesis and stored non-structural carbohydrates to different tree
467
compartments. The functional rules directly depend on climate factors, such
468
as growing degree days, soil water content or temperature, and are specific to
469
the phenological phase. Simultaneaously, the daily photosynthesis is simulated
470
following the biochemical model of Farquhar et al. (1980) and dynamically
in-471
teracts with the allocation module. The combination and interaction of these
472
processes may smooth out the direct climate signal on tree-ring growth.
473
Correlations between observed and simulated (MAIDEN or VS-Lite)
tree-474
growth dependency on climate at all sites are generally low (ranging from
475
0.053 to 0.515), particularly for temperature, even if mostly significant (Table
476
2). The correlations for VS-Lite when we restrict the analysis to the MAIDEN
477
selected sites (Sect. 2.4.1) are in Table S8 and are similar to the results for
all 302 sites. In other words, when considering all sites, both models have low
479
skill in reproducing correctly the actual climate signal observed in tree-rings.
480
However the well-fitted sites (Sect. 3.1) have better correlations, ranging from
481
0.648 (annual temperature) to 0.759 (July-August-September temperature)
482
for MAIDEN and 0.678 (annual temperature) to 0.837 (October-September
483
precipitation) for VS-Lite. Both models are thus able to accurately mimic
484
the climate signal in tree-ring observations if the sites are carefully selected
485
(Sect. 3.1). When focusing on the common well-fitted sites between VS-Lite
486
and MAIDEN, VS-Lite is slightly better at reproducing climate, specifically
487
for annual temperature (0.608 correlation for MAIDEN and 0.772 for VS-Lite)
488
and precipitation (0.747 for MAIDEN and 0.886 for VS-Lite).
489 ● ● ● ● ● ● ● ● ● ● ● ● ● ● ● ● ● ● ● ● ● ● ● ● ● ● ● ● ● ● ● ● ● ● ● ● ● ● ● ● ● ● ● ● ● ● ● ● ● ● ● ● ● ● ● ● ● ●● ● ● ● ● ● ● ● ● ● ● ● ● ● ● ● ● ● ● ● ● ● ● ● ● ● ● ● ● ● ● ● ● ● ● ● ● ● ● ● ● ● ● ● ● ● ● ● ● ● ● ● ● ● ● ● ● ● ● ● ● ● ● ● ● ● ● ● ● ● ● ● ● ● ● ● ● ● ● ● ● ● ● ● ● ● ● ● ● ● ● ● ● ● ● ● ● ● ● ● ● ● −1.0 −0.5 0.0 0.5 1.0 − 1.0 − 0.5 0.0 0.5 1.0 Observations Sim ulations ● ● ● ● ● ● ● ● ● ● ● ● ● ● ● ● ● ● ● ● ● ● ● ● ● ● ● ● ● ● ● ● ● ● ● ● ● ● ● ● ● ● ● ● ● ● ● ● ● ● ● ● ● ● ● ● ● ●● ● ● ● ● ● ● ● ● ● ● ● ● ● ● ● ● ● ● ● ● ● ● ● ● ● ● ● ● ● ● ● ●● ● ● ● ● ● ● ● ● ● ● ● ● ● ● ● ● ● ● ● ● ● ● ● ● ● ● ● ● ● ● ● ● ● ● ● ● ● ● ● ● ● ● ● ● ● ● ● ● ● ● ● ● ● ● ● ● ● ● ● ● ● ● ● ● ● ● ● ● −1.0 −0.5 0.0 0.5 1.0 − 1.0 − 0.5 0.0 0.5 1.0 Observations Sim ulations ● ● ● ● ● ● ● ● ● ● ● ● ● ● ● ● ● ● ● ● ● ● ● ● ● ● ● ● ● ● ● ● ● ● ● ● ● ● ● ● ● ● ● ● ● ● ● ● ● ● ● ●● ● ● ● ● ● ● ● ● ● ● ● ● ● ● ● ● ● ● ● ● ● ● ● ● ● ● ● ● ● ● ● ● ● ● ● ● ● ● ● ● ●● ● ● ● ● ● ● ● ● ● ● ● ● ● ● ● ● ● ● ● ● ● ● ● ● ● ● ● ● ● ● ● ● ● ● ● ● ● ● ● ● ● ● ● ● ● ● ● ● ● ● ● ● ● ● ● ● ● ● ● ● ● ● ● ● ● −1.0 −0.5 0.0 0.5 1.0 − 1.0 − 0.5 0.0 0.5 1.0 Observations Sim ulations a. b. c.
Fig. 6 Correlations between mean annual temperature (a), mean July-August-September temperature (b), October-September cumulative precipitation (c) and MAIDEN (GI2015) Dstem simulations as a function of correlations between the same climate indicators and TRW observations for selected sites (160 out of 302 sites; Sect. 2.4.1) over the 1901-1949 verification period. ● ● ● ● ● ● ● ● ● ● ● ● ● ● ● ● ● ● ● ● ● ● ● ● ● ● ● ● ● ● ● ● ● ● ● ● ● ●● ● ● ● ● ● ● ● ● ● ● ● ● ● ● ● ● ● ● ● ● ● ● ● ● ● ● ● ● ● ● ● ● ● ● ● ● ● ● ● ● ● ● ● ● ● ● ● ● ● ● ● ● ● ● ● ● ● ● ● ● ● ● ● ● ● ● ● ● ● ● ● ● ● ● ● ● ● ● ● ● ● ● ● ● ● ● ● ● ● ● ● ● ● ● ● ● ● ● ● ● ● ● ● ● ● ● ● ● ● ● ● ● ● ● ● ● ● ● ● ● ● ● ● ● ● ● ● ● ● ● ● ● ● ● ● ● ● ● ● ● ● ● ● ● ● ● ● ● ● ● −1.0 −0.5 0.0 0.5 1.0 − 1.0 − 0.5 0.0 0.5 1.0 Observations Sim ulations ● ● ● ● ● ●● ● ● ● ● ● ● ● ● ● ● ● ● ● ● ● ● ● ● ● ● ● ● ● ● ● ● ● ● ● ● ●● ● ● ● ● ● ● ● ● ● ● ● ● ● ● ● ● ● ● ● ● ● ● ● ● ● ● ● ● ● ● ● ● ● ● ● ● ● ● ● ● ● ● ● ● ● ● ● ● ● ● ● ● ● ● ● ● ● ● ● ● ● ●● ● ● ● ● ● ● ● ● ● ● ● ● ● ● ● ● ● ● ● ● ● ● ● ● ● ● ● ●●● ● ● ● ● ● ● ● ● ● ● ● ● ● ● ● ● ● ● ● ● ● ● ● ● ● ● ● ● ● ● ● ● ● ● ● ● ● ● ● ● ● ● ● ● ● ● ● ● ● ● ● ● ● ● ● ● ● −1.0 −0.5 0.0 0.5 1.0 − 1.0 − 0.5 0.0 0.5 1.0 Observations Sim ulations ● ● ● ● ● ● ● ● ● ● ● ●● ● ● ● ● ● ● ● ● ● ● ● ● ● ● ● ● ● ● ● ● ● ● ● ● ● ● ● ●● ● ● ● ● ● ● ● ● ● ● ● ● ● ● ● ● ● ● ● ● ●● ● ● ● ● ● ● ● ● ● ● ● ● ● ● ● ● ● ● ● ● ● ● ● ● ● ●● ● ● ● ● ● ● ● ● ● ● ● ● ● ● ● ● ● ● ● ● ● ● ● ● ● ● ● ● ● ● ● ● ● ● ● ● ● ● ● ● ● ● ● ● ● ● ● ● ● ● ● ● ● ● ● ● ● ● ● ● ● ● ● ●● ● ● ● ● ● ● ● ● ● ● ● ● ● ● ● ● ● ● ● ● ● ● ● ● ● ● ● ● ● ● ● ● ● −1.0 −0.5 0.0 0.5 1.0 − 1.0 − 0.5 0.0 0.5 1.0 Observations Sim ulations a. b. c.
Fig. 7 Correlations between mean annual temperature (a), mean July-August-September temperature (b), October-September cumulative precipitation (c) and MAIDEN (Ge2017) Dstem simulations as a function of correlations between the same climate indicators and TRW observations for selected sites (189 out of 302 sites; Sect. 2.4.1) over the 1901-1949 verification period.
● ● ● ● ● ● ● ● ● ● ● ● ● ● ●●● ● ● ● ● ●● ● ● ● ● ● ● ● ● ● ● ● ● ● ● ● ● ● ● ● ● ● ● ● ● ● ● ● ● ● ● ● ● ● ● ● ● ● ● ● ● ● ● ●● ● ● ● ● ●● ● ● ● ● ● ● ● ● ● ● ● ● ● ● ●● ● ● ● ● ● ● ● ● ● ● ● ● ● ● ● ● ● ●● ● ● ● ● ● ● ● ● ● ● ● ● ● ● ● ●● ● ● ● ● ● ● ● ● ● ● ● ● ● ● ● ● ● ● ● ● ● ● ● ● ● ● ● ● ● ● ● ● ● ● ● ● ● ● ● ● ●● ● ● ● ● ● ● ● ● ● ● ● ● ● ● ● ● ● ● ● ● ● ● ● ● ● ● ● ● ● ● ● ● ● ● ● ● ● ● ● ● ● ● ● ● ● ● ● ● ● ●● ● ● ● ● ● ● ● ● ● ● ● ● ● ● ● ● ● ●● ● ● ● ● ● ● ● ● ● ● ● ● ● ● ● ● ● ● ● ● ● ● ● ● ●● ● ● ● ● ● ● ● ● ● ● ● ● ● ● ● ● ● ● ● ● ● ● ● ● ● ● ● ● ● ● ● ● ● ● ● ● ● ● −1.0 −0.5 0.0 0.5 1.0 − 1.0 − 0.5 0.0 0.5 1.0 Observations Sim ulations ● ● ● ● ● ● ● ● ● ● ● ● ● ● ●● ● ● ● ● ● ● ● ● ●● ● ● ● ● ● ● ● ● ● ● ● ● ● ● ● ● ● ● ● ● ● ● ● ● ● ● ● ● ● ● ● ● ● ● ● ● ● ● ● ●● ● ● ● ● ●● ● ● ● ● ● ● ● ● ● ● ● ● ● ● ● ● ● ● ● ● ● ● ● ● ● ● ● ● ● ● ● ● ● ● ● ● ● ● ● ● ● ● ● ● ● ● ● ● ● ● ● ● ● ● ● ● ● ● ● ● ● ● ● ● ● ● ● ●●● ● ● ● ● ● ● ● ● ● ● ●●● ● ●● ● ● ● ● ● ● ● ● ● ●● ● ● ● ● ● ● ● ● ● ● ● ● ● ● ● ● ● ● ● ● ● ● ● ● ● ● ● ● ● ● ● ● ● ● ● ● ● ● ● ● ● ● ● ● ● ● ● ● ● ● ● ● ● ● ● ● ● ● ● ● ● ● ●● ● ● ●● ● ● ● ●● ● ● ● ● ● ● ●● ● ● ● ● ● ● ● ● ● ● ● ● ● ● ● ● ● ● ● ● ● ● ● ● ● ● ● ● ● ● ● ● ● ● ● ● ● ● ● ● ● ● ● ● ● ● ● ● ● ● −1.0 −0.5 0.0 0.5 1.0 − 1.0 − 0.5 0.0 0.5 1.0 Observations Sim ulations ● ● ● ● ● ● ● ● ● ● ● ● ● ● ●● ● ● ● ● ● ● ● ● ● ● ● ● ● ● ● ● ● ● ● ● ● ●● ● ● ● ● ● ● ● ● ● ● ● ● ● ● ●● ● ● ● ● ● ● ● ● ● ● ● ● ● ● ●● ● ● ● ● ● ● ● ● ● ● ● ● ● ● ● ● ● ● ● ● ● ● ● ● ● ● ● ● ● ● ● ● ● ● ● ● ● ● ● ● ● ● ● ● ● ● ● ● ● ● ● ● ● ● ● ● ● ● ● ● ● ● ● ● ● ● ● ● ● ● ● ● ● ● ● ● ● ● ● ● ● ●●● ● ● ● ● ● ● ● ● ● ● ● ● ● ●● ● ● ● ● ● ● ● ● ● ● ● ● ● ● ● ● ● ● ● ●● ● ● ● ● ● ● ● ● ● ● ● ● ● ● ● ● ● ● ● ● ● ● ● ● ● ● ● ● ● ● ● ● ● ● ● ● ● ● ● ● ● ●● ● ● ● ● ● ● ● ● ● ● ● ● ● ●● ● ● ● ● ● ● ● ● ● ●● ● ● ● ● ● ● ● ● ● ● ● ● ● ● ● ● ● ● ● ● ● ● ● ● ● ● ● ● ● ● ● ● ● ● ● ● ● ● ● ● ● −1.0 −0.5 0.0 0.5 1.0 − 1.0 − 0.5 0.0 0.5 1.0 Observations Sim ulations a. b. c.
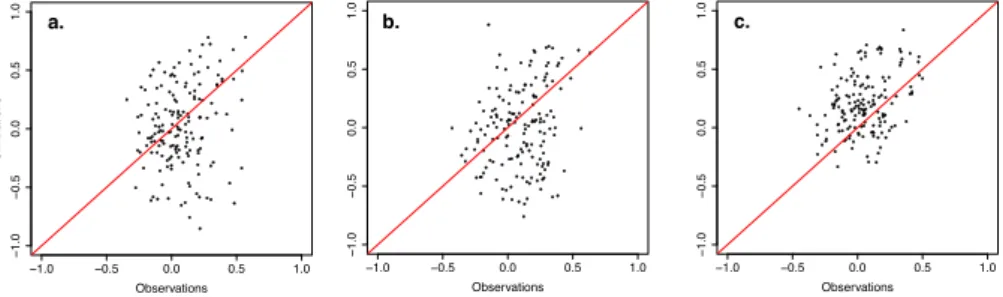
Fig. 8 Correlations between mean annual temperature (a), mean July-August-September temperature (middle), October-September cumulative precipitation (b) and VS-Lite tree-ring index simulations as a function of correlations between the same climate indicators and TRW observations for all sites (302) over the 1901-1949 verification period.
Table 2 Pearson correlations of correlations between different climate indicators and tree-ring width observations with correlations between the same climate indicators and MAIDEN or VS-Lite tree-growth simulations (1901-1949 verification period). O-S stands for the year starting from October (previous year) to September (current year); P for precipitation; JAS for July-August-September; T for temperature; TRindex for tree-ring index. Asterisks stand for significant correlations (p-value < 0.05). The difference in the number of sites on which correlations are computed is due to the phenological criterion that has been applied to MAIDEN calibrated sites (see Sect. 2.4.1 for more details).
Model (version) Correlation
Correlations between observed TRW and O-S P correlation and simulated TRindex and O-S P correlation
MAIDEN (Ge2017; 189 sites) 0.388*
MAIDEN (GI2015; 160 sites) 0.322*
VS-Lite (302 sites) 0.515*
MAIDEN (well-fitted sites only) 0.694*
VS-Lite (well-fitted sites only) 0.837*
MAIDEN (common well-fitted sites only) 0.747*
VS-Lite (common well-fitted sites only) 0.886*
Correlations between observed TRW and annual T correlation and simulated TRindex and annual T correlation
MAIDEN (Ge2017; 189 sites) 0.053
MAIDEN (GI2015; 160 sites) 0.171*
VS-Lite (302 sites) 0.241*
MAIDEN (well-fitted sites only) 0.648*
VS-Lite (well-fitted sites only) 0.678*
MAIDEN (common well-fitted sites only) 0.608*
VS-Lite (common well-fitted sites only) 0.772*
Correlations between observed TRW and JAS T correlation and simulated TRindex and JAS T correlation
MAIDEN (Ge2017; 189 sites) 0.130
MAIDEN (GI2015; 160 sites) 0.216*
VS-Lite (302 sites) 0.338*
MAIDEN (well-fitted sites only) 0.759*
VS-Lite (well-fitted sites only) 0.704*
MAIDEN (common well-fitted sites only) 0.739*
3.4 Sensitivity analysis of MAIDEN to atmospheric CO2concentration 490
In this section, we perform a sensitivity analysis of the MAIDEN model to
491
atmospheric CO2concentration. The CO2 concentration is a key driver of the
492
forest carbon fluxes but its actual effects are still difficult to consider and
493
evaluate in dendroecological studies (Körner et al., 2005; Silva et al., 2010;
494
Peñuelas et al., 2011; Lévesque et al., 2014; Van Der Sleen et al., 2015; Girardin
495
et al., 2016; Hararuk et al., 2019; Giguère-Croteau et al., 2019; Marchand et al.,
496
2020). Yet, the CO2concentration has increased by 30% over the last 50 years
497
and might increase up to 1000 ppm at the 2100 horizon (RCP 8.5; Myhre
498
et al., 2013) relative to the current 414.49 ppm (December 2020, https://
499
www.esrl.noaa.gov/gmd/ccgg/trends/global.html, last access: 19 March
500
2021), which will have an impact on the forest carbon fluxes. This effect should
501
be taken into account in dendroecological analysis (Babst et al., 2018). In
502
MAIDEN, the CO2 influences the forest carbon fluxes through the coupled
503
modelling of photosynthesis and stomatal conductance (Farquhar et al., 1980;
504
Leuning, 1995) with environmental dependencies related to temperature and
505
soil water content (Gea-Izquierdo et al., 2015; Gennaretti et al., 2017), and the
506
feedbacks between the coupled photosynthesis-stomatal conductance system
507
and the carbon allocation.
508
Here, we evaluate the influence of the inclusion of the CO2 concentration
509
increase in MAIDEN by comparing its performance in the standard
configu-510
ration with a sensitivity experiment in which the CO2 concentration is kept
511
constant, for the 64 well-fitted sites (Sect. 3.1), with parameters calibrated
512
based on the CO2 increasing scenario. The CO2 is fixed at its 1st January
513
1980 value for the Northern Hemisphere (339 ppm), and at its 1st July 1980
514
value for the Southern Hemisphere (340 ppm).
515
At each site, we computed the difference between normalized MAIDEN
516
tree-ring growth simulations and normalized TRW observations from 1990 with
517
increasing CO2 and constant CO2. We performed our analysis on the 60 sites
518
out of 64 well-fitted sites that end at least in 1990. Note that both simulations
519
were normalized over 1950-2000 based on the mean and standard deviation of
520
the original simulation, i.e. with increasing CO2, over the same time period.
521
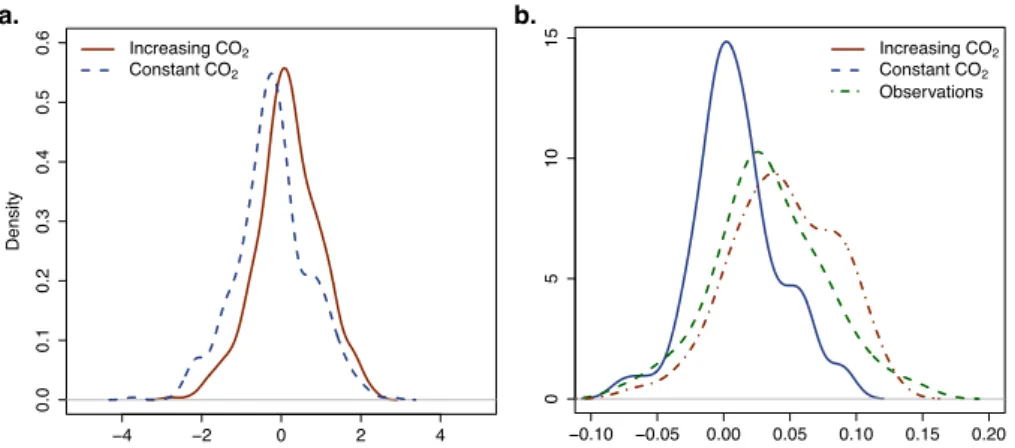
The density distributions of the difference for both experiments are shown
522
on Fig. 9a. The Pearson’s Chi-squared test indicates a significant difference
523
between the two experiments distributions (p-value < 0.05). The mean for both
524
experiments are -0.209 and 0.182 for the constant CO2 and increasing CO2
525
experiment, respectively. In other words, while not taking into account CO2
526
tends to underestimate the actual tree-growth on average, taking into account
527
the increase of CO2 in MAIDEN leads to overestimate it. Ecophysiological
528
models are indeed known to overestimate the actual effect of CO2 (Peñuelas
529
et al., 2011; Gea-Izquierdo et al., 2017). However, the CO2 concentration has
530
certainly an impact on the tree carbon assimilation (Marchand et al., 2020)
531
that should be properly considered to avoid potential biases in climate and
532
growth trend reconstructions derived from tree-ring data. This impact can be
533
taken into account by ecophysiological models such as MAIDEN, but potential
overestimations must be carefully envisaged due to the generic default of such
535
models.
536
The trend of simulated and observed tree-growth was also computed and
537
compared at each of the 60 sites. It corresponds to the coefficient of regression
538
of the normalized tree-growth simulations or observations from 1970 up to 1990
539
at least, versus the years. The simulated trend by MAIDEN may reproduce
540
the generally positive trend that is observed from 1970 in TRW time series
541
(Fig. 9b) in correlation with the increasing CO2 concentrations.
542
Consequently, our results show that the growth trends simulated by MAIDEN
543
are significantly influenced by the CO2increase and that MAIDEN simulated
544
tree-growth is closer to the observed TRW when including the CO2
concen-545
tration increase. This limited analysis is not sufficient to draw conclusions
546
regarding CO2 fertilization in trees but it highlights a potential CO2 effect
547
based on a model that takes into account a commonly used biochemical
for-548
mulation of photosynthesis (Farquhar et al., 1980). Including the effect of CO2
549
in a mechanistic model like MAIDEN is a potential advantage over statistical
550
and simple process-based models such as VS-Lite that are not able to account
551
for these processes strongly influencing the forest carbon fluxes. However,
be-552
cause of the remaining uncertainties on the associated processes, an improved
553
representation of the effect of CO2 in process-based dendroecological models
554
is needed to analyse past and future growth trends and variability.
555 −4 −2 0 2 4 0.0 0.1 0.2 0.3 0.4 0.5 0.6 Density Increasing CO2 Constant CO2 −0.10 −0.05 0.00 0.05 0.10 0.15 0.20 0 5 10 15 Density Increasing CO2 Constant CO2 Observations a. b.
Fig. 9 Density distributions of (a) the difference between normalized tree-ring index simu-lations by MAIDEN and observed tree-ring width from 1990 with increasing CO2
concentra-tion (in red, i.e. the original configuraconcentra-tion), and constant CO2concentration (in blue); (b)
the trend from 1970 of normalized tree-ring index simulations by MAIDEN with increasing CO2concentration (in red, i.e. the original configuration) or with constant CO2
concentra-tion (in blue), and of normalized tree-ring width observaconcentra-tions (in green); at 60 out of 64 well-fitted sites (Sect. 3.1).
4 Discussion and conclusions
556
In this paper, we have applied and compared two dendroclimatic
process-557
based models of different complexity levels, VS-Lite and MAIDEN, using the
558
global PAGES2k TRW database over the last century. We have evaluated their
559
respective abilities and advantages to be used at the global scale as PSMs for
560
paleoclimate data assimilation based reconstructions.
561
The models appear to be skillful for a similar number of mostly different
562
sites (63 sites for VS-Lite and 64 sites for MAIDEN, 18 sites in common),
563
spread over all continents. The performance of the models is comparable in
564
terms of calibration and verification correlations. VS-Lite generally results
565
in more stable correlations between the calibration and verification periods.
566
When focusing on the factors that can drive the performance of both
mod-567
els, VS-Lite displays a strong correlation between its verification scores and
568
tree-growth correlations with temperature, while MAIDEN does not. This
569
means that VS-Lite tends to perform better at sites where observed
tree-570
growth strongly correlates with temperature. In other words, the model’s
per-571
formance is improved in environments characterized by extreme temperatures.
572
This feature hampers its application in many regions of the world away from
573
the treeline, already rarely considered for paleoclimate reconstruction. In
con-574
trast, MAIDEN performance is less sensitive to the climate signal in TRW
575
time series. We presume that MAIDEN performance is mainly limited by the
576
lack of information needed to accurately calibrate and initialize the model at
577
each specific site. As mentioned above, the information needed to calibrate
578
MAIDEN is a key limitation of complex tree-growth models in general for use
579
at a broader scale. This lack of data (for example, the observed Gross Primary
580
Productivity data) also hinders a complete evaluation and identification of the
581
factors driving the performance of MAIDEN.
582
At the sites where each model works well in terms of calibration and
veri-583
fication correlations, both VS-Lite and MAIDEN are on average able to
suc-584
cessfully retrieve the climate signal in tree-rings. A careful selection of the
585
tree-ring sites provides the opportunity to focus on the most robust simulated
586
relationship between climate and tree-growth. However, VS-Lite appears to
587
predominantly overestimate the observed dependence of tree-growth on
cli-588
mate, while there is no systematic bias for MAIDEN. The overestimation of
589
the climate signal recorded in tree-rings has to be carefully taken into account
590
when using such tree-growth models for data assimilation based
reconstruc-591
tions as it can result in biases. This is a clear disadvantage when using less
592
complex dendroclimatic models, such as VS-Lite, in which the climate and
593
tree-growth relationship is simplified.
594
Consequently, we may recommend using MAIDEN especially when the
595
relationship between climate and tree-growth is complex with interacting
lim-596
iting factors. VS-Lite would be a good candidate if tree-growth is mostly
lim-597
ited by only one climatic factor (e.g. summer temperature), although it may
598
overestimate these climate dependences, particularly for temperature, leading
599
to overconfident reconstructions. In this case, MAIDEN should produce more