1
H NMR based metabolic pro
filing of eleven Algerian aromatic plants and
evaluation of their antioxidant and cytotoxic properties
Nabila Brahmi
a,b,1, Monica Scognamiglio
a,1, Severina Paci
fico
a,⁎
, Aida Mekhoukhe
b, Khodir Madani
b,
Antonio Fiorentino
a, Pietro Monaco
aa
Department of Environmental, Biological and Pharmaceutical Sciences and Technologies, Second University of Naples, Via Vivaldi 43, I-81100 Caserta, Italy
b
Laboratoire de Biomathématiques, Biophysique, Biochimie, et Scientométrie (L3BS), Faculté des Sciences de la Nature et de la Vie, Université de Bejaia, 06000 Bejaia, Algeria
a b s t r a c t
a r t i c l e i n f o
Article history: Received 7 February 2015
Received in revised form 29 June 2015 Accepted 2 July 2015
Available online xxxx
Keywords:
Algerian aromatic plants Metabolic profiling NMR analysis
Radical scavenging activity Antioxidant activity Cytotoxicity
Eleven Algerian medicinal and aromatic plants (Aloysia triphylla, Apium graveolens, Coriandrum sativum, Laurus nobilis, Lavandula officinalis, Marrubium vulgare, Mentha spicata, Inula viscosa, Petroselinum crispum, Salvia officinalis, and Thymus vulgaris) were selected and their hydroalcoholic extracts were screened for their antirad-ical and antioxidant properties in cell-free systems. In order to identify the main metabolites constituting the ex-tracts,1H NMR-based metabolic profiling was applied. Data obtained emphasized the antiradical properties of T. vulgaris, M. spicata and L. nobilis extracts (RACI 1.37, 0.97 and 0.93, respectively), whereas parsley was the less active as antioxidant (RACI−1.26). When the cytotoxic effects of low and antioxidant doses of each extract were evaluated towards SK-N-BE(2)C neuronal and HepG2 hepatic cell lines, it was observed that all the extracts weakly affected the metabolic redox activity of the tested cell lines. Overall, data strongly plead in favor of the use of these plants as potential food additives in replacement of synthetic compounds.
© 2015 Elsevier Ltd. All rights reserved.
1. Introduction
Plants used primarily for their medicinal or aromatic properties in pharmacy or perfumery are defined as medicinal and aromatic plants (MAPs). Many plants defined as MAPs are also used for cosmetic pur-poses, so that the definition medicinal, aromatic and cosmetic (MAC) plants would better describe such plants (Lubbe & Verpoorte, 2011). In terms of production of industrial products/fine chemicals from plants, some plants defined as MAPs and MACs can also be used in the produc-tion of dyes, colorants and crop protecproduc-tion products. Health products, nutraceuticals or dietary supplements based on medicinal and aromatic plants have also gained popularity. The beneficial properties of these plants seemed to be ascribed to their content in phytochemicals (Dias, Barros, Sousa, & Ferreira, 2012), and in particular to their richness in phenolic compounds (Guimarães et al., 2013).
Polyphenols are bioactive secondary metabolites, commonly found in both edible and inedible plants (Wojdyło, Oszmiański, & Czemerys, 2007; da Silva Port's, Chisté, Godoy, & Prado, 2013; Kaiser, Kammerer, & Carle, 2013), which, nowadays, attract special attention due to their health-promoting characteristics (Sumbul, Ahmad, & Mohd, 2011).
Phenolic compounds in plants are closely associated with their antioxi-dant activity, which is mainly due to their redox properties and their ca-pacity to counteract the over-production of reactive oxygen species (Sharma, Bhushan Jha, Shanker Dubey, & Pessarakli, 2012). These natu-ral products, with considerable diversity in their structure, contribute to flavor, color and sensory properties of plants. Cells respond to polyphe-nols mainly through direct interactions with receptors or enzymes in-volved in signal transduction, which may result in modification of the redox status of the cell and may trigger a series of redox-dependent re-actions (Scalbert, Johnson, & Saltmarsh, 2005). Both antioxidant and prooxidant effects of polyphenols have been described, with contrasting effects on cell physiologic processes. As antioxidants, polyphenols may improve cell survival; as prooxidants, they may induce apoptosis and prevent tumor growth. However, the biological effects of polyphenols may extend well beyond the modulation of oxidative stress (Scalbert et al., 2005). The high antioxidant power of herbal extract is of particular interest to food industry. In fact, oxidative deterioration of food prod-ucts during processing and storages produces off-flavor, which affects their marketability, and different oxidized metabolites, which seem to be involved in some disease conditions (Hossain, Brunton, Barry-Ryan, Martin-Diana, & Wilkinson, 2008). As the use of synthetic antioxidants, such as butyl hydroxyanisole (BHA), butylated hydroxytoluene (BHT) and tert-butylated hydroquinone (TBHQ) has been strongly regulated due to their toxic effects, medicinal and aromatic plants are thought to Food Research International xxx (2015) xxx–xxx
⁎ Corresponding author.
E-mail address:severina.pacifico@unina2.it(S. Pacifico).
1
These authors contributed equally to this work.
http://dx.doi.org/10.1016/j.foodres.2015.07.005
0963-9969/© 2015 Elsevier Ltd. All rights reserved.
Contents lists available atScienceDirect
Food Research International
j o u r n a l h o m e p a g e :w w w . e l s e v i e r . c o m / l o c a t e / f o o d r e sbe sources of natural antioxidants, which could potentially replace the synthetic antioxidants offering additional health benefits.
In Algeria, collection of medicinal and aromatic plants to extract, after distillation, essential oils for the manufacture of cosmetics, phar-maceuticals as well as flavors for food products, is a virgin field (Reguieg, 2011) but little is known about Algerian medicinal plants phenolic content and their potential as source of active antioxidant in-gredients (Djeridane et al., 2006; Atmani et al., 2009).
In this context, eleven Algerian medicinal and aromatic plants (Aloysia triphylla, Apium graveolens, Coriandrum sativum, Laurus nobilis, Lavandula officinalis, Marrubium vulgare, Mentha spicata, Inula viscosa, Petroselinum crispum, Salvia officinalis, and Thymus vulgaris) were select-ed and their hydroalcoholic extracts were analyzselect-ed through1H NMR spectroscopy, an effective technique for both metabolitefingerprinting and metabolite profiling applications in samples of plant origin. All the extracts were also screened for their antiradical and antioxidant proper-ties in cell-free systems. The cytotoxic effects of low doses of each ex-tract were evaluated towards neuronal and hepatic cell lines. The choice of our investigated plants is based on two criteria:first, in this do-main there is no study in Algeria that deals with these plants, and the second criterion is that these plants have ethnopharmacological data in-dicating their traditional utilization in the treatment of different dis-eases and disorders (Paula de Oliveira et al., 2011). In addition, some of them have been proved to be efficient in the treatment of various can-cerous lesions (Xavier, Lima, Fernandes-Ferreira, & Pereira-Wilson, 2009; Aissaoui, Zizi, Israili, & Lyoussi, 2011; Sertel, Eichhorn, Plinkert, & Efferth, 2011; Talib, Zarga, & Mahasneh, 2012) and as potential neuroprotectants (Vora, Patil, & Pillai, 2009; Kelsey, Wilkins, & Linseman, 2010; Pacifico et al., 2013; Pacifico et al., 2014). Due to their traditional utilization and active components, these plants are also con-sidered to be efficient for the treatment of free radical-related disorders. 2. Materials and methods
2.1. Reagents and chemicals
All of the solvents and reagents used for assessing antioxidant screening were purchased from Sigma-Aldrich Chemie (Buchs, Switzerland) except ABTS, which was from Roche Diagnostics (Roche Diagnostics, Mannheim, Germany). Cell culture medium and reagents for cytotoxicity testing were purchased from Invitrogen (Paisley, UK); MTT [3-(4,5-dimethyl-2-thiazolyl)-2,5-diphenyl-2H-tetrazolium bro-mide] was from Sigma-Aldrich Chemie. Deuterated solvents and inter-nal standard for NMR-based metabolic profiling analyses were purchased from Sigma-Aldrich Chemie.
2.2. Plant collection and fractionation
Leaves of the eleven selected plants were collected in October 2012 at Souk El Tenine Nature Reserve (Bejaia, Algeria) and identified by Dr. Ourabah of the Faculté des Sciences Université de Constantine (Algeria). Three replicate samples (10.0 g each) of leaves of each selected plant, cleaned, were dried in a ventilated thermostat at 40 °C for 72 h and ground to powder using a porcelain mortar and pestle, untilfine and ho-mogeneous particles were obtained. Aliquots of dried leaves (1.0 g) underwent ultrasound-assisted extraction (Dr. Hielsher UP 200S, Germany) using an hydro-alcoholic solution (10.0 mL; H2O:MeOH; 1:1, v:v) as extracting solvent. Four sonication cycles were performed (30 min each) in order to achieve the maximum recovery of the leaf me-tabolite content. At the end of each sonication cycle, samples were cen-trifuged at 2044 ×g for 10 min in a Beckman GS-15R centrifuge (Beckman Coulter, Milano, Italy)fitted with rotor S4180. Obtained su-pernatants were dried under vacuum by a rotary evaporator (Heidolph Hei-VAP Advantage, Germany) to yield crude extracts, which were stored at−20 °C until use.
2.3. NMR-based metabolic profiling
Algerian aromatic plants hydroalcoholic extracts (40.0 mg each) were dissolved in 1.0 mL of a solvent system made up of K2HPO4buffer (pH 6.0, 90 mM) in D2O (containing the internal standard) and methanol-d4(1:1 v/v). Trimethylsilylpropionic-2,2,3,3-d4acid sodium salt (TSP-d4, 0.1%, w/v) was used as internal standard. NMR spectra were recorded at 25 °C on a Varian Mercury Plus 300 Fourier transform NMR at 300.03 MHz for1H and at 75.45 MHz for13C. Spectra were cali-brated by setting the TSP peak at 0.00 ppm. Data acquisition parameters, for the1H NMR spectrum, were as follows: 0.16 Hz/point, acquisition time, number of scans (NS) = 256, relaxation delay (RD) = 1.5 s, 90 pulse width, number of data points (NP) = 4096, spectral width = 3065 Hz. A presaturation sequence was used to suppress the residual H2O signal. Line broadening of 0.3 Hz and zero-filling to 64 K were ap-plied prior to Fourier transform. FIDs were Fourier-transformed, and the resulting spectra were manually phased and baseline-corrected using an1H NMR processor (MestreNova 8.0). Plant extract composition has been defined by comparing NMR data with an in-house library, with databases (Cui et al., 2008) and with some literature data (Lubbe, Gude, Verpoorte, & Choi, 2013; Verpoorte, Choi, & Kim, 2007; Wolfender, Rudaz, Choi, & Kim, 2013). For some metabolites, the support of 2D-NMR techniques was needed.
2.4. Determination of total phenol content
Total phenol amount of both crude extracts was determined according to the Folin–Ciocalteau procedure (Pacifico et al., 2012). Analyzed sam-ples (1.0 mg/mL in DMSO) were mixed with 0.500 mL of Folin– Ciocalteau reagent (FCR) and 4.0 mL of Na2CO3(7.5% w/v). After stirring reaction mixture at room temperature for 3 h, the absorbance was read at 765 nm using a Shimadzu UV-1700 spectrophotometer (Shimadzu, Sa-lerno, Italy). The content of total phenols of the samples was expressed as milligram gallic acid equivalents (GAEs) per 100 g of fresh material.
2.5. Determination of totalflavonoid content
Theflavonoid content of methanolic extracts was measured using a colorimetric assay as reported inPiccolella et al. (2008). A known vol-ume (0.5 mL) of the extract or standard solution of catechin was added to a 10 mL volumetricflask. Distilled water was added to make a volume of 5 mL. At 0 time, 0.3 mL of NaNO2(5%, w/v) was added to theflask. After 5 min, 0.6 mL of AlCl3(10%, w/v) was added, and after 6 min, 2 mL of NaOH (1.0 M) was added to the mixture followed by the addition of 2.1 mL of distilled water. Absorbance was read at 510 nm against the blank (water), andflavonoid content was expressed as milligrams of catechin equivalents (CAT) per 100 g of fresh material.
2.6. Antioxidant activity assessment
Because multiple reaction characteristics and mechanisms as well as different phase localizations are usually involved, no single assay can ac-curately reflect all types of radical sources or antioxidants in a mixed or complex system. Thus,five different in vitro anti-radical assays were employed. Hydroalcoholic extracts from investigated Algerian aromatic plants, previously dissolved in DMSO as stock solutions of 12.5 mg/mL, were evaluated at different concentration levels (DMSOfinal concentra-tion was equal to 0.1% (v/v)). Tests were carried out performing three replicate measurements for three samples (n = 3) of each extract (in total, 3 × 3 measurements). Recorded activities were compared to a blank. Results are the mean ± SD values. Student t-test was applied in order to determine statistical significance (significance level was set at Pb 0.05).
2.6.1. Determination of 2,2-diphenyl-1-picrylhydrazyl (DPPH) radical scavenging capacity
In order to estimate the DPPH• scavenging capability, investigated extracts (0.625, 1.25, 2.5, 5.0, 12.5, and 25.0μg/mL, final concentration levels) were dissolved in a DPPH• methanol solution (9.4 × 10⁻⁵M; 1.0 mL) at room temperature. After 30 min, the absorption at 515 nm was measured by a Shimadzu UV-1700 spectrophotometer in reference to a blank. The results were expressed in terms of the percentage de-crease of the initial DPPH radical absorption by the test samples. 2.6.2. Determination of ABTS [2,2 ′-azinobis-(3-ethylbenzothiazolin-6-sulfonic acid)] radical cation scavenging capacity
The determination of ABTS•+solution scavenging capacity was esti-mated as previously reported (Di Maro et al., 2013). ABTS radical cation was generated by reacting ABTS (7.0 mM) and potassium persulfate (2.45 mM). The mixture was allowed to stand in the dark at room tem-perature for 12–16 h. Thus, the ABTS•+solution was diluted with PBS (pH 7.4) in order to reach an absorbance of 0.70 at 734 nm. Investigated extracts (0.625, 1.25, 2.5, 5.0, 12.5, and 25.0μg/mL, final concentration levels) were dissolved in 1.0 mL of diluted ABTS•+solution. After 6 min of incubation, the absorption at 734 nm was measured by a Shimadzu UV-1700 spectrophotometer in reference to a blank. The re-sults were expressed in terms of the percentage decrease of the initial ABTS•+absorption by the test samples.
2.6.3. Determination of OH• scavenging capacity
Fe(III)-EDTA-H2O2solutions were used as hydroxyl radical (OH•) gen-erating system (Fenton reaction), and the radical scavenging capabilities of aromatic plants extracts (0.625, 1.25, 2.5, 5.0, 12.5, and 25.0μg/mL, final concentration levels) were evaluated by determination of malondialdehyde (MDA) from the oxidative degradation of 2-deoxyribose. The reagent mixture, consisting of aqueous H2O2 (100.0μM), EDTA (100.0 μM), FeCl3 (100.0μM), and ascorbic acid (100.0 μM) in phosphate buffer (10 mM, pH 7.4, ionic strength 0.024 M), was incubated at 37 °C for 1 h. Then, 2-deoxyribose (28 mM) was added. The reaction mixture was allowed to stand at 37 °C for 5 min. Thus, 1.0 mL of diluted reagent mixture was added into tubes con-taining test samples, which were incubated at 37 °C for 1 h. To each tube 1.0 mL of a 1% TBA (thiobarbituric acid) in 50 mM NaOH and 1.0 mL of a solution at 2.8% of TCA (trichloroacetic acid) was added and placed in a water bath at 90 °C for 30 min, before taking the reading at 532 nm. 2.6.4. Determination of Fe(III) reducing power
Investigated extracts (0.625, 1.25, 2.5, 5.0, 12.5, and 25.0μg/mL, final concentration levels) were dissolved in potassium hexacyanoferrate (0.1 M, 2.5 mL) and phosphate buffer (0.2 M, pH 6.6, ionic strength 0.37 M, 2.5 mL). The mixture was incubated at 50 °C for 30 min. Then, an aqueous solution of trichloroacetic acid (100.0 mg/mL) was added. After 5 min, an aliquot of the reaction mixture (2.5 mL) was mixed with 2.5 mL of MilliQ water and 0.5 mL of ferric chloride (1.0 mg/mL). The absorbance was measured at 700 nm. The increase in absorbance with reference to the blank estimates the reducing power.
2.6.5. Relative antioxidant capacity index determination
RACI was calculated according to the method of Sun and Tanumihardjo (2007). The standard score was calculated as follows: (x− μ) / σ where x is the raw data, μ is the mean, and σ is the standard deviation. Standard scores have a mean of 0 and a standard deviation equal to 1.
2.7. Cytotoxicity assessment
Cytotoxicity assays which use different parameters associated with cell death and proliferation were performed. Samples of each extract were prepared as stock solutions of 12.5 mg/mL in DMSO. They were further diluted in cell culture medium to appropriatefinal dose levels
(DMSOfinal concentration was equal to 0.1% (v/v)). Tests were carried out performing twelve replicate (n = 12) measurements for three sam-ples of each extract (in total: 12 × 3 measurements). Recorded activities were compared to an untreated blank arranged in parallel to the sam-ples. Results are the mean ± SD values. Student t-test was applied in order to verify statistical significance (significance level was set at P b 0.05).
2.7.1. Cell cultures
SK-N-BE(2)-C human bone marrow neuroblastoma cells, and HepG2 human hepatoblastoma cell line were purchased from ICLC (Interlab Cell Line Collection) at Istituto Nazionale per la Ricerca sul Cancro, Genoa (Italy). SK-N-BE(2)-C and HepG2 cell lines were grown in RPMI 1640 medium supplemented with 10% fetal bovine serum, 50.0 U/mL penicillin, and 100.0μg/mL streptomycin, at 37 °C in a humidified atmo-sphere containing 5% CO2.
2.7.2. MTT cell viability test
SK-N-BE(2)-C, and HepG2 cell lines were seeded in 96-multiwell plates at a density of 1.0 × 10⁴cells/well. After 24 h of incubation, each cell line, previously carefully washed with PBS (100μl × 2) to re-move the maximum of potentially interfering phytochemicals (Bunel, Ouedraogo, Nguyen, Stévigny, & Duez, 2014), was treated with hydroalcoholic extracts from investigated Algerian aromatic plants at four dose levels (3.125, 6.25, 12.5 and 25.0μg/mL, final concentration levels). At 24, and 48 h of incubation, cells were treated with 150μL of MTT (0.50 mg/mL), dissolved in the culture medium, for 1 h at 37 °C in a 5% CO2humidified atmosphere. The MTT solution was then re-moved and 100μL of DMSO were added to dissolve the formazan
0 25 50 75 100 Ag Cs Ps Lo Ms Mv So Tv At Iv Ln TPC (m g GAE/g extr act) 0 5 10 15 20 Ag Cs Ps Lo Ms Mv So Tv At Iv Ln TFC (mg CAT/g extr act) Lamiacea Apiaceae Ve rb e n a c ea e A s tera ce ae Lau ra c e a e A B
Fig. 1. A) Total phenol content expressed as mg GAE/100 g DM; B) totalflavonoid content expressed as mg CAT/100 g DM. Ag = Apium graveolens; Cs = Coriandrum sativum; Ps = Petroselinum sativum; Lo = Lavandula officinalis; Ms = Mentha spicata; Mv = Marrubium vulgare; So = Salvia officinalis; Tv = Thymus vulgaris; At = Aloysia triphylla; Iv = Inula viscosa; Ln = Laurus nobilis.
originated. Finally, the absorbance at 570 nm of each well was deter-mined using a Tecan SpectraFluorfluorescence and absorbance reader. Cell viability was expressed as percentage of mitochondrial redox activ-ity of the cells treated with the extracts compared to the untreated con-trol (Pacifico et al., 2012).
3. Results and discussion
The results showed that the total phenolic (TPC) andflavonoid (TFC) contents in the selected Algerian medicinal and aromatic plants varied considerably (Fig. 1A and B). The highest total phenolic level was de-tected in T. vulgaris L. (81.5 mg GAE for 100 g DW (Dried Weight)),
followed by M. spicata L. (55.2 mg GAE for 100 g DW), whereas the low-est was found for parsley sample. Analogously, thyme plants seemed to contain aflavonoid amount higher than that of the other investigated plants. Indeed, considering the percentage rate between TFC and TPC values, it was observed that only the 13% of thyme phenols could belong toflavonoid class. In this context, L. officinalis (Lo) and I. viscosa (Iv) were the species with the highestflavonoid content. In fact, the amount of these metabolites accounted for the 27.5 and 27.9% of L. officinalis and I. viscosa total phenol content, respectively.
1H NMR analysis allowed us to identify the main compounds in the extracts (Table 1,Figs. 2and S1). Metabolites identification was mainly achieved comparing plant extracts NMR data with an in-house library,
Table 1
1H NMR data and presence of the main metabolites detected in the Algerian aromatic plant extracts.
Metabolites 1 H NMR data Ag Cs Ps Lo Ms Mvv So Tv At Iv Ln Flavonoids Apigenin-7-derivative 1 6.47 (H6, d J = 2.4); 6.67 (H3, s); 6.77 (H8, d J = 2.4); 6.98 (H3′/H5′, d J = 8.7); 7.88 (H2′/H6′, d J = 8.7) × Apigenin-7-derivative 2 6.42 (H6, d J = 2.4); 6.58 (H3, s); 6.67 (H8, d J = 2.4); 6.92 (H3′/H5′, d J = 8.7); 7.77 (H2′/H6′, d J = 8.7) × Apiin 5.20 (Glc H1, d J = 7.2); 5.42 (Api H1, d J = 2.0); 6.48 (H6, d J = 2.1); 6.67 (H3, s); 6.75 (H8, d J = 2.1); 6.99 (H3′/H5′, d J = 8.7); 7.88 (H2′/H6′, d J = 8.7) × ×
Catechin 2.52 (H4b, dd); 2.82 (H4a, dd); 5.95 (H6, d, J = 2.1 Hz); 6.03 (H8, d, J = 2.1); 6.94-6.96 (ring B, ov) × × Flavonoid 1 6.13 (H6, d J = 2.4); 6.35 (H8, d J = 2.4) × Flavonoid 2 6.16 (H6, d J = 2.4); 6.39 (H8, d J = 2.4) × Flavonoid 3 6.27 (H6, d J = 2.4); 6.48 (H8, d J = 2.4) × × Flavonoid 4 6.54 (H6, d J = 2.4); 6.72 (H8, d J = 2.4) × Flavonoid 5 6.34 (H6, d J = 2.4); 6.36 (H3, s) 6.37 (H8, d J = 2.4) × Genistein 6.31 (H6, d J = 2.0), 6.47 (H8, d J = 2.0), 7.05 (H3′/H5′, d J = 9.0); 7.44 (H2′/H6′, d J = 9.0); 8.21 (H2, s) × Kaempferol 6.35 (H6, d J = 2.1); 6.52 (H8, d J = 2.1); 7.00 (H2′/H6′, d J = 8.4); 8.09 (H3′/H5′, d J = 8.4) × × Kaempferol derivative 6.35 (H6, d J = 2.1); 6.52 (H8, d J = 2.1); 7.96 (H3′/H5′, d J = 8.4) × Quercetin 6.27 (H6, d J = 2.1); 6.48 (H8, d J = 2.1); 6.99 (H5′, d J = 8.5); 7.59 (H6′, dd J = 8.5, 2.1); 7.75 (H2′, d J = 2.1) ×
Other secondary metabolites
p-coumaric acid 6.35 (H8, d J = 15.9); 6.86 (H2/H6, d J = 8.1); 7.43 (H3/H5, d J = 8.1); 7.60 (H7, d J = 15.9) × Chlorogenic acid 1.84-2.20 (H2 and H6 quinic acid, m); 5.45 (H5, m); 6.37 (H8′, d, J = 15.9); 6.90 (H5′, d, J = 8.1);
7.07 (H6′, dd J = 8.4, 2.1); 7.15 (H2′, d J = 2.1); 7.62 (H7′, d J = 15.9)
×
Dicaffeoylquinic acid 6.30 (H8′, d J = 16.2); 6.48 (H8″, d J = 15.6); 7.65 (H7′, d J = 16.2); 7.66 (H7″, d J = 15.6) × Ferulic acid 3.89 (OCH3s); 6.42 (H8, d J = 15.9); 6.85 (H2, d J = 7.8); 7.05 (H6, dd J = 8.1, 2.1); 7.15
(H5, d J = 1.5); 7.60 (H7, d J = 15.9) × Forsythoside 1.06 (H6″′, d J = 6.3); 2.84 (H7′, t J = 6.9); 4.48 (H1″, d J = 7.8), 5.12 (H1″′, d J = 1.2); 6.35 (H8, d J = 15.9); 6.74 (H6′, dd J = 7.8, 2.1); 6.78 (H5, d J = 8.1); 6.79 (H2′, d J = 2.1); 6.87 (H5′, d J = 7.8); 7.06 (H6, dd J = 8.1, 1.8); 7.14 (H2, d J = 1.8); 7.64 (H7, d J = 15.9) × Marrubenol 0.97 (H17, d J = 6.3); 1.00 (H18, s); 1.32 (H20, s); 6.37 (H14, brs); 7.16 (H16, brs); 7.44 (H15, brs) × Neochlorogenic acid 6.39 (H8′, d J = 15.9); 7.52 (H7′, d J = 15.9) × Phenylpropanoid 1 6.19 (H8, d J = 15.9); 7.43 (H7, d J = 15.9) × Phenylpropanoid 2 6.12 (H8, d J = 15.9); 7.40 (H7, d J = 15.9) × Rosmarinic acid 3.00 (H7′a, dd J = 14.1, 9.6); 3.15 (H7′b, dd J = 14.1, 3.6); 6.30 (H8, d J = 15.9); 6.71
(H6′, dd J = 7.8, 2.1); 6.81 (H5′, d J = 7.8); 6.82 (H5, d J = 8.1); 6.89 (H2′, d J = 2.1); 7.00 (H6, dd J = 8.1, 1.8); 7.11 (H2, d J = 1.8); 7.50 (H7, d J = 15.9) × × × × Trigonelline 4.42 (Me, s); 8.10 (H4, dd J = 7.8, 6.0); 8.87 (H6, m); 9.15 (H2, s) × Primary metabolites Alanine 1.48 (H3, d J = 7.2) × × × × × × × × Asparagine 2.88 (H2a, dd J = 17.1, 8.1); 2.96 (H2b, dd J = 8.1, 3.9) × × × × × × Citric acid 2.59 (H2a, d J = 17.6); 2.72 (H2b, d J = 17.6) × × ×
Fumaric acid 6.56 (H2/H3, s) × GABA 1.92 (H3, m); 2.36 (H2, t J = 7.5); 3.01 (H4, t J = 7.5) × × × × × Glucose 4.59 (H1β, d J = 7.8); 5.19 (H1 α, d J = 3.8) × × × × × × × × × × × Glutamic acid 2.01 (H4, m); 2.11 (H3, m) × × × × Glutamine 2.21 (H3, m); 2.43 (H4, m) × × × × Isoleucine 1.01 (H6, d J = 6.9); 0.94 (H5, t J = 7.5) × × ×
Malic acid 2.39 (H3a, dd J = 15.6, 9.3); 2.78 (H3a, dd J = 15.6, 3.6); 4.31 (H2, dd J = 9.3, 3.6) × × × × × × × ×
Phenylalanine 7.33-7.42 (Ph, m) × × × Succinic acid 2.53 (H2/H3s) × × Sucrose 4.15 (H5′, d, J = 8.4); 5.38 (H1, d, J = 3.6) × × × × × × × × × × × Tryptophan 7.20 (H5′, t J = 7.4); 7.29 (H6′, t J = 7.4); 7.32 (H2′, s); 7.54 (H7′, d J = 8.1); 7.73 (H4′, d J = 7.9) × Tyrosine 6.83 (H3′/H5′, d J = 8.4); 7.16 (H2′/H4′, d J = 8.4); × × × Threonine 1.32 (H4, d, J = 6.6) × × × Valine 0.99 (H5, d, J = 6.9); 1.05 (H4, d, J = 6.9) × × × × ×
1H NMR data are measured in ppm and coupling constants (J) in Hertz; signal multiplicity indicated as: d = doublet, dd = doublet of doublets, m = multiplet, ov = overlapped,
databases (Cui et al., 2008) and literature data (Lubbe et al., 2013; Verpoorte et al., 2007; Wolfender et al., 2013).
A. graveolens and Petroselinum sativum were characterized by the presence of apigenin derivatives, while the other plant belonging to the Apiaceae family, C. sativum, contained the isoflavone genistein and ferulic acid. These extracts were also very rich in free amino acids and organic acids. The occurrence of isoflavonoid compounds in Apiaceae family was previously reported byAbdulmanea, Prokudina, Lanková, Zelený, and Lapčík (2012), who applying HPLC–MS techniques found the isoflavone glucoside daidzin as constituent of C. sativum seed.
The plants belonging to the Lamiaceae family showed rosmarinic acid as the main phenolic compound. Other phenylpropanoids were de-tected in these extracts, as well as an array offlavonoids as shown in Table 1, but the definitive structural elucidation of some of these compounds was hindered by severe signal overlapping. The species M. vulgare was an exception as the main metabolite was marrubenol, a furanic labdane diterpene.
A. triphylla contained forsythoside A as the main metabolite, while chlorogenic acids were the most abundant compounds in I. viscosa; sev-eralflavonoids were detected in L. nobilis.
Ag Cs Ps Lo Ms Mv So Tv At Iv Ln
Fig. 2.1H NMR spectra of plant extracts. Ag = Apium graveolens; Cs = Coriandrum sativum; Ps = Petroselinum sativum; Lo = Lavandula officinalis; Ms = Mentha spicata; Mv = Marrubium
The1H NMR spectra of the species L. officinalis, S. officinalis, I. viscosa and L. nobilis also showed signals belonging to terpenoid compounds.
When the investigated plants were tested for their scavenging ef-fects towards DPPH• and ABTS•+, all the samples were particularly ac-tive at very low doses. In particular, M. spicata sample exerted the strongest antiradical efficacy towards both the radicals, whereas laurel and thyme leaf extracts were able to massively reduce ABTS radical cat-ion. In fact, M. spicata hydroalcoholic extract exhibited a significant dose dependent inhibition of DPPH radical and ABTS cation one with 50% of inhibition (ID50) at dose of 1.57 and 1.29μg/mL, respectively. Calculated TEAC (Trolox® Equivalents Antioxidant Capacity) values highlighted the antiradical properties of investigated plant extracts (Table 2). Fur-thermore, the reductive ability of each extract was also measured through an electron transfer reaction (Fe3+–Fe2 +) using a ferric salt as oxidant agent. Also in this case, laurel and mint extracts exercised the strongest and dose-increasing reducing power (Table 2). The poten-tial antioxidative efficiency was also investigated by measuring the amount of thiobarbituric acid reactive species produced in several reac-tions having deoxyribose as oxidizable substrate. T. vulgaris extract strongly counteracted deoxyribose oxidation, followed by laurel and inula extracts (Table 2).
Data obtained from ABTS, DPPH, ORAC, Fe3+
RP and FCR tests were used to calculate RACI (Relative Antioxidant Capacity Index) value for each extract. The data obtained by applying ABTS method positively correlated to TPC values (0.801), whereas a particularly positive correla-tion was observed between the DPPH data and•OH radical scavenging (R = 0,.716), TPC (R = 0,.876) and TFC data (R = 0.803). A low corre-lation was found between•OH radical scavenging data and those calcu-lated for Fe3+RP method. RACI calculation represents the average of the standard scores obtained from the raw data for the various methods (Fig. 3). The index RACI allows us to compare the antioxidant activity of plant complexes estimated by different chemical methods providing a more comprehensive determination of the entire antioxidant capacity of the plant system. The results emphasized that T. vulgaris, M. spicata and L. nobilis were the most active extracts (RACI 1.37, 0.97 and 0.93, re-spectively), whereas parsley was the less active (RACI−1.26).
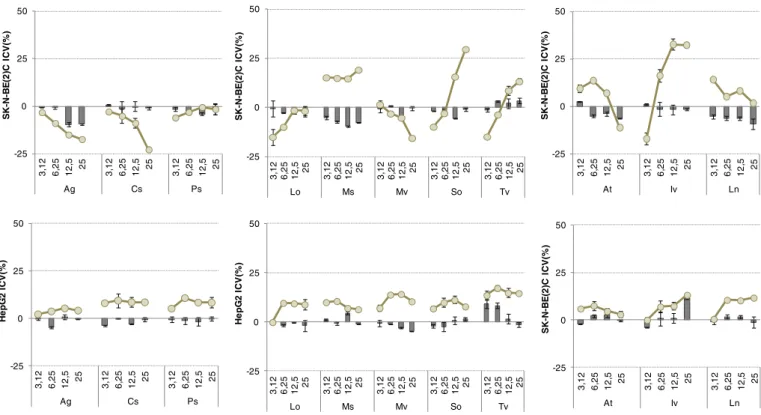
The evaluation of cytotoxicity was carried out by application of the MTT test that allows to estimate the number of metabolically active cells present in culture and then to evaluate the effect of treatment with an exogenously added agent on the viability of the cell population. The test is based on the ability of the compound MTT tetrazolium (yel-low colored) to be metabolized by the mitochondrial dehydrogenases, active in living cells, in a formazan derivative (violet colored). The viable
cells, unlike those of non-viable, reduce MTT and the amount of formazan product is proportional to the number of present cells. The use of low doses for each extract, chosen on the basis of antioxidant tests data, allowed us to observe that all the extracts weakly affected cell viability of the tested cell lines (Fig. 4). Detected activities were comparable to those exerted by Trolox®, used as antioxidant standard (data not shown). Indeed, it was observed that neuroblastoma cells were more responsive than hepatoblastoma cells. All the investigated extracts induced a mild cell viability increase towards SK-N-BE(2)C at 24 h exposure time, whereas some of them, mainly belonging to Lamiaceae family, were able to inhibit cell viability in percentage be-tween 10% and 25% after 48 h exposure time. While M. spicata hydroalcoholic extract exerted its weak effects in a similar manner at all the tested doses, S. officinalis and T. vulgaris showed dose-dependent cytotoxic effects. I. viscosa extract exhibited a behavior sim-ilar to sage and thyme extracts.
The results detailed in the present study demonstrate the antioxi-dant and free-radical scavenging capabilities of hydroalcoholic extracts from leaves of the eleven selected Algerian aromatic plants, suggesting they could be used as promising sources of natural antioxidants. Total phenol content and total antioxidant capacity differed significantly among the eleven prepared plant extracts. In particular, T. vulgaris hydroalcoholic extract was the most active one. The antioxidant capa-bility of thyme could be due to its high content in rosmarinic acid, an ester of caffeic acid and 3,4-dihydroxyphenyllactic acid, which was found as constituent of several species of Lamiaceae and Boraginaceae (Shekarchi, Hajimehdipoor, Saeidnia, Gohari, & Hamedani, 2012). This metabolite was also identified as one of the main constituents of the spearmint extract, which showed an antioxidant power slightly inferior to T. vulgaris hydroalcoholic extract.Shekarchi et al. (2012), analyzing rosmarinic acid content in plants belonging to different genus of Labiatae family, observed that the most rosmarinic acid contents were found in Mentha species and M. spicata showed the highest amount of rosmarinic acid. Recently,Fletcher, Slimmon, and Kott (2010)evaluated the changes in rosmarinic acid accumulation in different chemotypes of mint leaf tissue due to environmental effects (photoperiod, cold stress, soil type, year to year differences). They found that in order to maximize rosmarinic acid levels in spearmint and peppermint, the plants had to be harvested during their vegetative phase, prior toflowering. Further-more, it was crucial that the plants were grown in areas with long days exceeding 14 h. Among the selected plants, also L. nobilis provided en-couraging antioxidant data. Considering laurel leaf extract metabolic profiling, it was possible that the efficacy observed was due to its con-tent in catechin, and quercetin. Ourfindings are in line with those of Dall'Acqua et al. (2009)andDias et al. (2014), who identified several
-1.5 -1 -0.5 0 0.5 1 1.5 2 Ag Cs Ps Lo Ms Mv So Tv Iv Ln RACI
Fig. 3. Relative antioxidant capacity index (RACI) of investigated Algerian medicinal and aromatic plants. Ag = Apium graveolens; Cs = Coriandrum sativum; Ps = Petroselinum sativum; Lo = Lavandula officinalis; Ms = Mentha spicata; Mv = Marrubium vulgare; So = Salvia officinalis; Tv = Thymus vulgaris; At = Aloysia triphylla; Iv = Inula viscosa; Ln = Laurus nobilis.
Table 2
Antioxidant activity of hydroalcoholic extracts from Algerian medicinal and aromatic plants expressed as the mean of ID50(μg/mL) values ± SD vs DPPH•, ABTS•+and OH•
RSC (Radical Scavenging Capacity) and TEAC values (Trolox® Equivalents Antioxidant Ca-pacity, ID50Trolox/ID50campione× 100) ± SD. TEAC values from Fe3+RP (Reducing Power)
are also shown. ID50DPPH• ID50 ABTS•+ ID50 OH• RSC TEAC DPPH• TEAC ABTS•+ TEACOH• RSC TEAC Fe3+ RP Ag 9.11 ± 0.38 5.51 ± 0.61 0.46 ± 0.02 24.6 88.7 159.9 0.48 Cs 8.99 ± 0.51 6.81 ± 0.41 1.48 ± 0.02 24.9 71.7 49.7 6.28 Ps 2.69 ± 0.07 10.1 ± 0.70 1.54 ± 0.11 83.3 48.6 48.05 0.64 Lo 1.87 ± 0.03 2.72 ± 0.12 0.58 ± 0.01 119.8 179.12 127.6 5.24 Ms 1.57 ± 0.05 0.97 ± 0.06 0.48 ± 0.03 142.5 504.1 154.2 10.34 Mv 2.42 ± 0.02 0.64 ± 0.15 202.1 115.6 3.33 So 1.98 ± 0.11 4.79 ± 0.14 1.36 ± 0.31 113.13 102.1 54.01 4.66 Tv 1.78 ± 0.08 0.69 ± 0.11 0.24 ± 0.03 125.8 708.7 308.3 5.27 At 1.65 ± 0.07 1.33 ± 0.11 0.51 ± 0.09 135.8 364.9 145.1 4.61 Iv 1.9 ± 0.21 4.05 ± 0.20 0.31 ± 0.04 117 120.74 239.5 4.55 Ln 1.23 ± 0.01 1.1 ± 0.02 0.28 ± 0.01 181.1 425.22 255.2 6.99 Ag = Apium graveolens; Cs = Coriandrum sativum; Ps = Petroselinum sativum; Lo = Lavandula officinalis; Ms = Mentha spicata; Mv = Marrubium vulgaris; So = Salvia officinalis; Tv = Thymus vulgaris; At = Aloysia triphylla; Iv = Inula viscosa; Ln = Laurus nobilis.
flavonol and flavanol derivatives as antioxidant constituents in bay leaf preparations.
4. Conclusions
It seems reasonable that the daily consumption of plant-based prod-ucts, containing large amount of polyphenol phytochemicals, could pro-vide an important tool for counteracting the adverse effects of oxidative stress. In this study, it is shown that leaf hydroalcoholic extracts from eleven wild aromatic plants, collected in Algeria, exerted a strong anti-oxidant capability. T. vulgaris and M. spicata extracts were the most ac-tive ones.1H NMR based metabolic profiling analysis evidenced their rich content in rosmarinic acid. However, additional work is required to painstakingly explore the phytochemical composition of the investi-gated Algerian plants and to enhance knowledge on their nutritional and nutraceutical value.
Supplementary data to this article can be found online athttp://dx. doi.org/10.1016/j.foodres.2015.07.005.
References
Abdulmanea, K., Prokudina, E. A., Lanková, P., Zelený, V., & Lapčík, O. (2012). Immuno-chemical and HPLC identification of isoflavonoids in the Apiaceae family. Biochemical Systematics and Ecology, 45, 237–243.
Aissaoui, A., Zizi, S., Israili, Z. H., & Lyoussi, B. (2011).Hypoglycemic and hypolipidemic ef-fects of Coriandrum sativum L. in Meriones shawi rats. Journal of Ethnopharmacology, 137, 652–661.
Atmani, D., Chaher, N., Berboucha, M., Ayouni, K., Lounis, H., Boudaoud, H., et al. (2009).
Antioxidant capacity and phenol content of selected Algerian medicinal plants. Food Chemistry, 112, 303–309.
Bunel, V., Ouedraogo, M., Nguyen, A. T., Stévigny, C., & Duez, P. (2014).Methods applied to the in vitro primary toxicology testing of natural products: state of the art, strengths, and limits. Planta Medica, 80, 1210–1226.
Cui, Q., Lewis, I. A., Hegeman, A. D., Anderson, M. E., Li, J., Schulte, C. F., et al. (2008). Me-tabolite identification via the Madison Metabolomics Consortium Database. Nature Biotechnology, 26, 162–164.
da Silva Port's, P., Chisté, R. C., Godoy, H. T., & Prado, M. A. (2013).The phenolic com-pounds and the antioxidant potential of infusion of herbs from the Brazilian Amazo-nian region. Food Research International, 53, 875–881.
Dall'Acqua, S., Cervellatti, R., Speroni, E., Costa, S., Guerra, M. C., Stella, L., et al. (2009). Phy-tochemical composition and antioxidant activity of Laurus nobilis L. leaf infusion. Journal of Medicinal Food, 12, 869–876.
Dias, M. I., Barros, L., Dueñas, M., Alves, R. C., Oliveira, M. B., Santos-Buelga, C., et al. (2014).
Nutritional and antioxidant contributions of Laurus nobilis L. leaves: would be more suitable a wild or cultivated sample? Food Chemistry, 156, 339–346.
Dias, M. I., Barros, L., Sousa, M. J., & Ferreira, I. C. F. R. (2013).Systematic comparison of nutraceuticals and antioxidant potential of cultivated, in vitro cultured and commercial Melissa officinalis samples. Food and Chemical Toxicology, 50, 1866–1873.
Di Maro, A., Pacifico, S., Fiorentino, A., Galasso, S., Gallicchio, M., Guida, V., Severino, V., Monaco, P., & Parente, A. (2013).Raviscanina wild asparagus (Asparagus acutifolius L.): a nutritionally valuable crop with antioxidant and antiproliferative properties. Food Research International, 53, 180–188.
Djeridane, A., Yousfi, M., Nadjemi, B., Boutassouna, D., Stockerc, P., & Vidalc, N. (2006). An-tioxidant activity of some Algerian medicinal plants extracts containing phenolic compounds. Food Chemistry, 97, 654–660.
Fletcher, R. S., Slimmon, T., & Kott, L. S. (2010).Environmental factors affecting the accu-mulation of rosmarinic acid in spearmint (Mentha spicata L.) and peppermint (Mentha piperita L.). The Open Agriculture Journal, 4, 10–16.
Guimarães, R., Barros, L., Dueñas, M., Calhelha, R. C., Carvalho, A. M., Santos-Buelga, C., et al. (2013).Infusion and decoction of wild German chamomile: bioactivity and character-ization of organic acids and phenolic compounds. Food Chemistry, 136, 947–954.
Hossain, M. B., Brunton, N. P., Barry-Ryan, C., Martin-Diana, A. B., & Wilkinson, M. (2008).
Antioxidant activity of spice extracts and phenolics in comparison to synthetic anti-oxidants. Rasayan Journal of Chemistry, 1, 751–756.
Kaiser, A., Kammerer, D. R., & Carle, R. (2013).Impact of blanching on polyphenol stability and antioxidant capacity of innovative coriander (Coriandrum sativum L.) pastes. Food Chemistry, 140, 332–339.
Kelsey, N. A., Wilkins, H. M., & Linseman, D. A. (2010).Nutraceutical antioxidants as novel neuroprotective agents. Molecules, 15, 7792–7814.
Lubbe, A., Gude, H., Verpoorte, R., & Choi, Y. H. (2013).Seasonal accumulation of major al-kaloids in organs of pharmaceutical crop Narcissus Carlton. Phytochemistry, 88, 43–53.
Lubbe, A., & Verpoorte, R. (2011).Cultivation of medicinal and aromatic plants for special-ty industrial materials. Crops and Products, 34, 785–801.
Pacifico, S., Gallicchio, M., Fiorentino, A., Fischer, A., Meyer, U., & Stintzing, F. C. (2012). An-tioxidant properties and cytotoxic effects on human cancer cell lines of aqueous fermented and lipophilic quince (Cydonia oblonga Mill.) preparations. Food and Chemical Toxicology, 50, 4130–4135.
Pacifico, S., Gallicchio, M., Lorenz, P., Duckstein, S. M., Potenza, N., Galasso, S., et al. (2014).
Neuroprotective potential of Laurus nobilis antioxidant polyphenol-enriched leaf ex-tracts. Chemical Research in Toxicology, 27, 611–626.
-25 0 25 50 3, 12 6, 25 12, 5 25 3, 12 6, 25 12, 5 25 3, 12 6, 25 12, 5 25 Ag Cs Ps S K-N-B E (2 )C I C V (% ) -25 0 25 50 3, 12 6, 25 12, 5 25 3, 12 6, 25 12, 5 25 3, 12 6, 25 12, 5 25 Ag Cs Ps He p G 2 I C V (% ) -25 0 25 50 3, 12 6, 25 12, 5 25 3, 12 6, 25 12, 5 25 3, 12 6, 25 12, 5 25 3, 12 6, 25 12, 5 25 3, 12 6, 25 12, 5 25 Lo Ms Mv So Tv S K-N-B E (2 )C I C V (% ) -25 0 25 50 3, 12 6, 25 12, 5 25 3, 12 6, 25 12, 5 25 3, 12 6, 25 12, 5 25 3, 12 6, 25 12, 5 25 3, 12 6, 25 12, 5 25 Lo Ms Mv So Tv He p G 2 I C V (% ) -25 0 25 50 3, 12 6, 25 12, 5 25 3, 12 6, 25 12, 5 25 3, 12 6, 25 12, 5 25 At Iv Ln S K-N-B E (2 )C I C V (% ) -25 0 25 50 3, 12 6, 25 12, 5 25 3, 12 6, 25 12, 5 25 3, 12 6, 25 12, 5 25 At Iv Ln S K-N-B E (2 )C I C V (% )
Fig. 4. SK-N-BE(2)C and HepG2 cell lines Cell Viability Inhibition (CVI, %) at 24 h (■) and 48 h (●) exposure times by means of MTT test results. Values are the mean ± SD of measurements carried out on 3 samples (n = 3) analyzed twelve times. Ag = Apium graveolens; Cs = Coriandrum sativum; Ps = Petroselinum sativum; Lo = Lavandula officinalis; Ms = Mentha spicata; Mv = Marrubium vulgare; So = Salvia officinalis; Tv = Thymus vulgaris; At = Aloysia triphylla; Iv = Inula viscosa; Ln = Laurus nobilis.
Pacifico, S., Gallicchio, M., Lorenz, P., Potenza, N., Galasso, S., Marciano, S., et al. (2013).
Apolar Laurus nobilis leaf extracts induce cytotoxicity and apoptosis towards three nervous system cell lines. Food and Chemical Toxicology, 62, 628–637.
Paula de Oliveira, A., Santin, J. R., Lemos, M., Klein Júnior, L. C., Couto, A. G., da Silva, Meyre, et al. (2011).Gastroprotective activity of methanol extract and marrubiin obtained from leaves of Marrubium vulgare L. (Lamiaceae). Journal of Pharmacy and Pharmacology, 63, 1230–1237.
Piccolella, S., Fiorentino, A., Pacifico, S., D'Abrosca, B., Uzzo, P., & Monaco, P. (2008).
Antioxidant properties of sour cherries (Prunus cerasus L.): role of colorless phyto-chemicals from the methanolic extract of ripe fruits. Journal of Agricultural and Food Chemistry, 56, 1928–1935.
Reguieg, L. (2011).Using medicinal plants in Algeria. American Journal of Food and Nutri-tion, 1, 126–127.
Scalbert, A., Johnson, I. T., & Saltmarsh, M. (2005).Polyphenols: Antioxidants and beyond. The American Journal of Clinical Nutrition, 81, 215S–217S.
Sertel, S., Eichhorn, T., Plinkert, P. K., & Efferth, T. (2011).Cytotoxicity of Thymus vulgaris essential oil towards human oral cavity squamous cell carcinoma. Anticancer Research, 31, 81–87.
Sharma, P., Bhushan Jha, A., Shanker Dubey, R., & Pessarakli, M. (2012).Reactive oxygen species, oxidative damage, and antioxidative defense mechanism in plants under stressful conditions. Journal of Botany, 2012 Article ID 217037.
Shekarchi, M., Hajimehdipoor, H., Saeidnia, S., Gohari, A. R., & Hamedani, M. P. (2012).
Comparative study of rosmarinic acid content in some plants of Labiatae family. Pharmacognosy Magazine, 8, 37–41.
Sumbul, S., Ahmad, M. A., & Mohd, A. (2011).Role of phenolic compounds in peptic ulcer: An overview. Journal of Pharmacy and Bioallied Sciences, 3, 361–367.
Sun, T., & Tanumihardjo, S. A. (2007).An integrated approach to evaluate food antioxidant capacity. Journal of Food Science, 72, R159–R165.
Talib, W. H., Zarga, M. H., & Mahasneh, A. M. (2012).Antiproliferative, antimicrobial and apoptosis inducing effects of compounds isolated from Inula viscosa. Molecules, 17, 3291–3303.
Verpoorte, R., Choi, Y. H., & Kim, H. K. (2007).NMR-based metabolomics at work in phy-tochemistry. Phytochemistry Reviews, 6, 3–14.
Vora, S. R., Patil, R. B., & Pillai, M. M. (2009).Protective effects of Petroselinum crispum (Mill) Nyman ex A. W. Hill leaf extract onD-galactose-induced oxidative stress in mouse brain. Indian Journal of Experimental Biology, 47, 338–342.
Wojdyło, A., Oszmiański, J., & Czemerys, R. (2007).Antioxidant activity and phenolic compounds in 32 selected herbs. Food Chemistry, 105, 940–949.
Wolfender, J. L., Rudaz, S., Choi, Y. H., & Kim, H. K. (2013).Plant metabolomics: From holistic data to relevant biomarkers. Current Medicinal Chemistry, 20, 1056–1090.
Xavier, C. P., Lima, C. F., Fernandes-Ferreira, M., & Pereira-Wilson, C. (2009).Salvia fruticosa, Salvia officinalis, and rosmarinic acid induce apoptosis and inhibit prolifera-tion of human colorectal cell lines: The role in MAPK/ERK pathway. Nutriprolifera-tion and Cancer, 61, 564–571.