Università della Svizzera italiana Software Institute
Interaction-Aware
Development Environments
Recording, Mining, and Leveraging IDE Interactions
to Analyze and Support the Development Flow
Roberto Minelli
Doctoral Dissertation submitted to the
Faculty of Informatics of the Università della Svizzera italiana (USI) in partial fulfillment of the requirements for the degree of
Doctor of Philosophy
Research Advisor
Prof. Michele Lanza
Research Co-Advisor
Dissertation Committee
Prof. Serge Demeyer University of Antwerp, Belgium
Prof. Radu Marinescu “Politehnica” University of Timisoara, Romania Prof. Matthias Hauswirth Università della Svizzera italiana (USI), Switzerland Prof. Cesare Pautasso Università della Svizzera italiana (USI), Switzerland
Dissertation accepted on 13 November 2017
Research Advisor Research Co-Advisor
Prof. Michele Lanza Dr. Andrea Mocci
Ph.D. Program Co-Director Ph.D. Program Co-Director
Prof. Walter Binder Prof. Olaf Schenk
I certify that except where due acknowledgement has been given, the work presented in this thesis is that of the author alone; the work has not been submitted previously, in whole or in part, to qualify for any other academic award; and the content of the thesis is the result of work which has been carried out since the official commencement date of the approved research program.
Roberto Minelli
To those who have always been by my side.
“You can’t connect the dots looking forward; you can only connect them looking backwards... ...so you have to trust that the dots will somehow connect in your future.”
Abstract
Nowadays, software development is largely carried out using Integrated Development Environ-ments, or IDEs. An IDE is a collection of tools and facilities to support the most diverse software engineering activities, such as writing code, debugging, and program understanding. The fact that they are integrated enables developers to find all the tools needed for the development in the same place. Each activity is composed of many basic events, such as clicking on a menu item in the IDE, opening a new user interface to browse the source code of a method, or adding a new statement in the body of a method. While working, developers generate thousands of these interactions, that we call fine-grained IDE interaction data. We believe this data is a valuable source of information that can be leveraged to enable better analyses and to offer novel support to developers. However, this data is largely neglected by modern IDEs.
In this dissertation we propose the concept of “Interaction-Aware Development Environ-ments”: IDEs that collect, mine, and leverage the interactions of developers to support and simplify their workflow. We formulate our thesis as follows: Interaction-Aware Development En-vironments enable novel and in-depth analyses of the behavior of software developers and set the ground to provide developers with effective and actionable support for their activities inside the IDE. For example, by monitoring how developers navigate source code, the IDE could suggest the program entities that are potentially relevant for a particular task.
Our research focuses on three main directions:
1. Modeling and Persisting Interaction Data. The first step to make IDEs aware of interaction data is to overcome its ephemeral nature. To do so we have to model this new source of data and to persist it, making it available for further use.
2. Interpreting Interaction Data. One of the biggest challenges of our research is making sense of the millions of interactions generated by developers. We propose several models to interpret this data, for example, by reconstructing high-level development activities from interaction histories or measure the navigation efficiency of developers.
3. Supporting Developers with Interaction Data. Novel IDEs can use the potential of in-teraction data to support software development. For example, they can identify the UI components that are potentially unnecessary for the future and suggest developers to close them, reducing the visual cluttering of the IDE.
Acknowledgements
“The journey is more important than the end or the start.” — Linkin ParkBoth in everyday life and during a research doctorate, the journey is what really matters. My journey lasted 5 years, 2 months, 13 days and it was amazing. It carried me to Switzerland, Italy, the Netherlands, USA, Canada, Chile, and Japan. I devoted 18% of my lifespan to this trip. At this very moment, I am not sure I will do it again, but now it is over and it is time to take stock. For better or worse, this trip deeply changed me: I grew older, perhaps wiser, I left home, I lost touch with many people, I found a partner, and I have never stopped learning. I believe learning is the key to staying alive. Learning a new programming language, a new foreign language, or how to use the last API on the market. It makes no difference. It is important to learn, discover, and create. I spent almost every day of the last 5 years learning.
The first person who made this trip possible is my advisor, Prof. Michele Lanza. Back in 2007, being among your students for the “Programming Fundamentals 1 (PF1)” left a mark on me. Your expertise, talent, passion, and love for what you were teaching will always be unmatched. Thank you very much, I learned a lot from you. I ask you with my heart, please go back to teaching PF1. First-year students need you. It took time, but throughout the years, “Prof. Lanza” became “Michele” and REVEAL became a second family. Well, yes, I spent more time at the office than at home. I want to thank all the members of REVEAL. I learned something from each and every one of you, former and present members. Besides our very different personalities, I hope you also learned something from me. Special thanks go to Andrea Mocci, the postdoc of our research group, for all the constructive discussions over the last years.
I also want to thank the members of my dissertation committee: Prof. Serge Demeyer, Prof. Radu Marinescu, Prof. Matthias Hauswirth, and Prof. Cesare Pautasso. Thank you for the time you invested reading, understanding, and giving me insightful feedback on my dissertation. Against all expectations, I also want to thank you for the 80-minute long discussion we had during the defense. Justifying my ideas and reasoning together with you was challenging, but satisfying. I am really looking forward to meeting you again in the future.
During my Ph.D. I had the opportunity and pleasure to collaborate with Prof. Romain Robbes and Prof. Takashi Kobayashi. Thank you, I enjoyed our times together.
Thanks to Elisa Larghi, Danijela Milicevic, and Janine “Nina” Caggiano for being always re-sponsive and for supporting me with reimbursements, travel requests, and much other paperwork. Without your help, things would not have gone so smoothly.
In spite of everything, my journey would have been impossible without the unconditional love and support of my family. Thank you Gabriella Zingali and Sergio Minelli for always believing in and being proud of me. Regardless of all my choices, all the arguments between us, and my difficult personality, I always felt your wholehearted love to push me forward. Sincere thanks also go to Paola Ghedini and Roberto Laghi, I am glad to be part of our so-called “Big Family”. Last but—needless to say—not least, there are not enough words to thank Elena Laghi for staying close to me in the most difficult time of my life. In the last five years, I struggled to bear with myself. I can not imagine how difficult it must have been for you. Together we faced many challenges, from leaving the parents’ nest to organizing crazy trips around the world. I do not know what the future holds for us, but I will always be grateful for all we have been through together. Thank you, Piedino.
Roberto Minelli iii
Contents
Contents v Figures xi Tables xv I Prologue 1 1 Introduction 3 1.1 Our Thesis . . . 5 1.2 Contributions . . . 51.2.1 Modeling & Analyzing Interaction Histories . . . 5
1.2.2 Supporting Tools . . . 5
1.3 Outline . . . 6
2 IDEs and Interaction Data 9 2.1 From Punch Cards to Modern Development Environments . . . 10
2.1.1 From the 1980s to the Present Day . . . 12
2.1.2 Summing Up . . . 12
2.2 What is Interaction Data? Why is it Important? . . . 13
2.2.1 Interactions with the IDE . . . 14
2.3 Programmable looms, IDEs, and Interaction Data . . . 15
3 The Pharo IDE 17 3.1 What is Pharo? . . . 18
3.2 The Object Model of Pharo . . . 19
3.2.1 Source Code Organization . . . 19
3.3 The Most Used UIs in the Pharo IDE . . . 20
3.3.1 Code Browser . . . 20
3.3.2 Workspace and Playground . . . 20
3.3.3 Inspector . . . 21
3.3.4 Debugger . . . 22
3.3.5 Search User Interfaces: Finder and Spotter . . . 22
3.3.6 Senders and Implementors Browsers . . . 22
3.4 Why Pharo? . . . 23
3.4.1 Tab- vs. Window-based Environments . . . 25
4 State of the Art 27 4.1 Recording Software Development Data . . . 28
4.1.1 The 1990s: Early Development Data . . . 28
4.1.2 The 2000s: The Interaction Data Era . . . 28 v
vi Contents
4.2 Understanding the Behavior of Developers . . . 29
4.2.1 Understanding Source Code Navigation . . . 30
4.2.2 Understanding the Role of Program Comprehension . . . 31
4.2.3 Understanding Tasks and Work Fragmentation . . . 31
4.2.4 Leveraging Fine-Grained Source Code Changes and Biometric Data . . . 33
4.2.5 Visualizing Software Development . . . 33
4.3 Supporting Software Development Activities . . . 35
4.3.1 Supporting the (Re)construction of Working Sets . . . 35
4.3.2 Supporting Source Code Exploration and Navigation . . . 36
4.3.3 Towards the Next Generation of IDEs . . . 37
4.4 Privacy and Ethics . . . 39
4.4.1 The Case of Interaction Data . . . 39
4.4.2 Our Experience with DFlow and the Pharo IDE . . . 40
4.5 Reflections . . . 41
II Modeling, Recording, and Interpreting Interaction Data 43 5 DFlow: Our Interaction Profiler for the Pharo IDE 45 5.1 DFlow in a Nutshell . . . 46
5.2 A Model for Interaction Data . . . 46
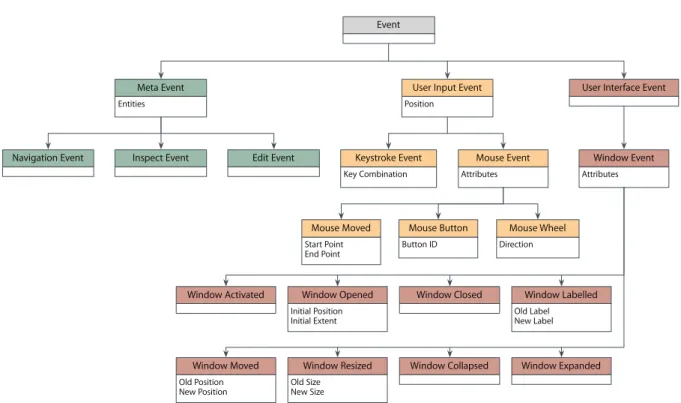
5.2.1 Meta Events . . . 46
5.2.2 User Input Events . . . 47
5.2.3 User Interface Events . . . 47
5.3 Evolution of DFlow . . . 48
5.3.1 A Manual Interface to Record Development Sessions . . . 48
5.3.2 Automatic Recording of Development Sessions . . . 49
5.3.3 DF2low: Automatically Observing, Filtering, and Propagating Interactions 50 5.4 Reflections . . . 52
6 A Naïve Model to Interpret Interaction Data 53 6.1 Datasets and Recording Tools . . . 54
6.1.1 Interaction Events and Sessions Meta-Information . . . 54
6.1.2 DFlow and Smalltalk Interaction Histories . . . 55
6.1.3 Plog and Java Interaction Histories . . . 56
6.2 Naïve Estimation Model . . . 57
6.2.1 Modeling DFlow Interaction Histories . . . 58
6.2.2 Modeling Plog Interaction Histories . . . 61
6.2.3 Discussion: The Degrees of Freedom of the Models . . . 63
6.3 Results . . . 64
6.3.1 Threats to Validity . . . 66
6.4 Reflections . . . 67
7 Inferring High-Level Development Activities from Interaction Histories 69 7.1 The Dataset . . . 70
7.1.1 More Than Meta Events . . . 70
7.1.2 Facts and Figures . . . 70
7.2 Inferring High-Level Development Activities . . . 73
Contents vii
7.2.2 Inference Model in Practice . . . 74
7.2.3 Decomposing Software Development . . . 75
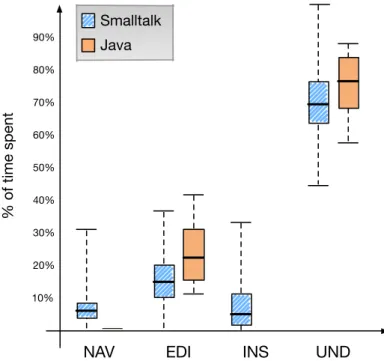
7.3 How Developers Spend Their Time . . . 77
7.3.1 The Components of Program Understanding . . . 78
7.3.2 Time Spent Outside the IDE . . . 79
7.3.3 The Impact of the UI, Navigation, and Editing . . . 80
7.4 Reflections . . . 81
7.4.1 Advocatus Diaboli . . . 81
7.4.2 Wrapping Up . . . 82
8 Measuring Navigation Efficiency in the IDE 83 8.1 Source Code Navigation in the Pharo IDE . . . 84
8.1.1 Structural Source Code Navigation in Pharo . . . 84
8.1.2 Dataset . . . 85
8.2 Modeling Navigation Efficiency with Interaction Data . . . 85
8.3 A Naïve Model for Navigation Efficiency . . . 87
8.3.1 A More Realistic Cost Model: The ∆-cost . . . 89
8.3.2 Limitations . . . 90
8.4 A Refined Model for Navigation Efficiency . . . 92
8.4.1 Navigation Beyond the Code Browser . . . 92
8.4.2 Refining Real Navigation . . . 92
8.4.3 Refining Ideal Navigation: The UI-Aware Model . . . 93
8.4.4 Results . . . 94
8.5 Reflections . . . 94
8.5.1 Developer diversity . . . 94
8.5.2 Outliers . . . 95
8.5.3 Significance of Edited Entities . . . 95
8.5.4 Contradicting Findings? . . . 95
8.5.5 Threats to Validity . . . 95
8.6 Summing Up . . . 96
III Visual Analytics of Development Sessions 97 9 Understanding How Developers Use the User Interface of the IDE 99 9.1 Visualizing UI Usage: Principles and Proportions . . . 100
9.2 Telling Development Stories with the UI View . . . 102
9.2.1 The Dataset . . . 102
9.2.2 Development Stories . . . 103
9.3 Categorizing Developers and Development Sessions . . . 108
9.4 Reflections . . . 109
10 Visualizing the Evolution of Working Sets 111 10.1 Visualizing the Working Set . . . 112
10.1.1 What is a Working Set? . . . 112
10.1.2 Visualization Principles: Nodes, Edges, and Layout . . . 113
10.1.3 Co-Evolution of Working Set and Visualization . . . 115
10.2 Visual Analysis: Dataset and Patterns . . . 117
viii Contents
10.2.2 Snapshot Patterns . . . 119
10.2.3 Evolutionary Patterns . . . 124
10.3 Reflections . . . 128
11 Other Visualizations and Storytelling 129 11.1 A Catalog of Visualizations for Development Sessions . . . 130
11.1.1 Activity Forest . . . 130
11.1.2 Activity Timeline . . . 131
11.1.3 Cumulative Activity . . . 131
11.1.4 Workspace View . . . 131
11.2 Telling Visual Development Stories . . . 133
11.3 DFloWeb: Visualizing Interaction Data in the Web . . . 137
11.3.1 Visualizing Development Sessions with DFloWeb . . . 138
11.3.2 Telling Development Stories with DFloWeb . . . 139
11.4 Reflections . . . 141
IV Supporting Developers with Interaction Data 143 12 The Plague Doctor: Curing the Window Plague 145 12.1 The Plague Doctor . . . 146
12.1.1 Models and Strategies . . . 147
12.1.2 Advocatus Diaboli . . . 148
12.2 The Future of the Plague Doctor . . . 149
12.3 Summing Up . . . 150
13 Taming the User Interface of the IDE 151 13.1 IDEs and Chaotic UIs . . . 152
13.1.1 Improving Management of Working Sets . . . 152
13.1.2 Evidence from Mylyn data . . . 153
13.1.3 Beyond Tab-based IDEs . . . 153
13.1.4 Strengthening the existing evidence . . . 154
13.2 Charactering and Measuring the Chaos . . . 155
13.2.1 DFlow Dataset . . . 155
13.2.2 Modeling Chaos . . . 156
13.2.3 Wrapping Up . . . 160
13.3 Make Code, not Chaos . . . 160
13.3.1 Strategies to Tame the UI of the IDE . . . 161
13.3.2 Impact of Elision and Layout Strategies . . . 162
13.3.3 Threats to Validity . . . 164
13.3.4 Wrapping up . . . 165
13.4 Reflections . . . 165
V Epilogue 167 14 Long-Term Vision 169 14.1 Eye: The “Mother” of All Interaction Profilers . . . 170
Contents ix
14.1.2 All that Glitters Ain’t Gold . . . 172
14.2 Recommender Systems Based on IDE Interactions . . . 172
14.3 Live and Adaptive Visualizations . . . 173
14.4 Adaptive User Interfaces . . . 174
14.5 Crowdsourced Holistic Mental Models . . . 176
14.6 Wrapping Up . . . 176
15 Conclusions 177 15.1 Modeling, Recording, and Interpreting Interaction Data . . . 178
15.1.1 DFlow: Our Interaction Profiler for the Pharo IDE . . . 178
15.1.2 A Naïve Model to Interpret Interaction Data . . . 178
15.1.3 Inferring High-Level Development Activities from Interaction Histories . . . 178
15.1.4 Measuring Navigation Efficiency in the IDE . . . 179
15.2 Visual Analytics of Development Sessions . . . 179
15.2.1 Understanding How Developers Use the User Interface of the IDE . . . 179
15.2.2 Visualizing the Evolution of Working Sets . . . 179
15.2.3 Other Visualizations and Storytelling . . . 179
15.3 Supporting Developers with Interaction Data . . . 180
15.3.1 The Plague Doctor: Curing the Window Plague . . . 180
15.3.2 Taming the User Interface of the IDE . . . 180
15.4 Our Vision for the Future . . . 180
15.5 Closing Words . . . 181
Bibliography 183 Online Resources 197 VI Appendices 199 A Blended, not Stirred: Multi-Concern Visualization of Large Software Systems 201 A.1 The Ingredients . . . 202
A.1.1 Source Code Changes . . . 202
A.1.2 ShoreLine Reporter and Stack Traces . . . 203
A.1.3 DFlow and IDE Interaction Data . . . 203
A.2 Visualization Principles . . . 204
A.2.1 The City Metaphor: Layout and Metrics . . . 206
A.2.2 Color Harmonies and Blends . . . 206
A.2.3 Under the Hood . . . 207
A.3 Telling Development Stories with the Visualization . . . 208
A.4 Reflections . . . 215
B Gamifying Software Engineering with Interaction Data 217 B.1 A Gamification Layer for the IDE . . . 218
B.1.1 Our vision . . . 218
B.2 Session Digest: Free Hugs for Developers . . . 218
B.3 Extending the Session Digest . . . 221
B.3.1 How Can We Evaluate a Gamification System? . . . 222
Figures
2.1 Interactions between the developer and different sources . . . 13
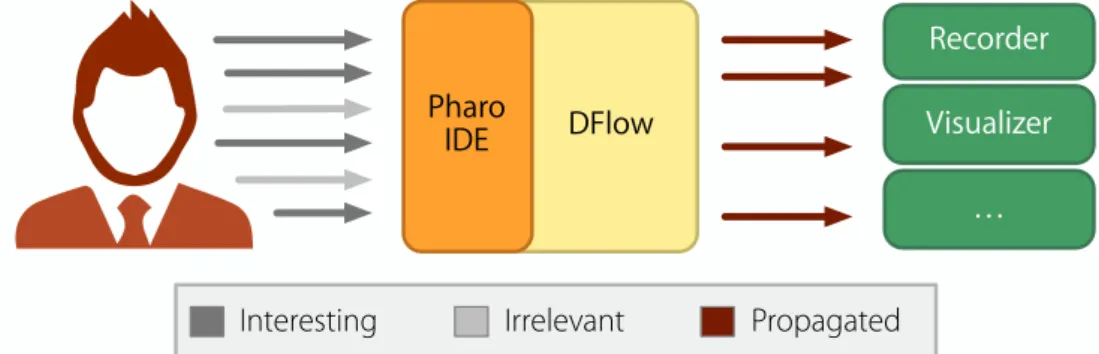
2.2 The flow of interactions between the developer and the IDE . . . 14
3.1 The Pharo Main Window and its UIs: (A) Playground, (B) Code Browser (or Code Editor), (C) Inspector, (D) Spotter Search Interface, (E) Finder UI, and (F) Debugger 18 3.2 The Code Browser of the Pharo IDE . . . 20
3.3 The Workspace (3.3a) and the Playground (3.3b) of the Pharo IDE . . . 21
3.4 The Inspector of the Pharo IDE . . . 22
3.5 The Debugger of the Pharo IDE . . . 23
3.6 Two search user interfaces of the Pharo IDE: Finder (3.6a) and Spotter (3.6b) . . . . 24
3.7 The Senders (3.7a) and Implementors (3.7b) Browsers of the Pharo IDE . . . 24
3.8 The window-based UI of Pharo (3.8a) and the tab-based UI of Eclipse (3.8b) . . . 25
4.1 An example of the Ownership Map exhibiting different behavioral patterns . . . 34
4.2 Code Flow: From the source code to the visualization . . . 34
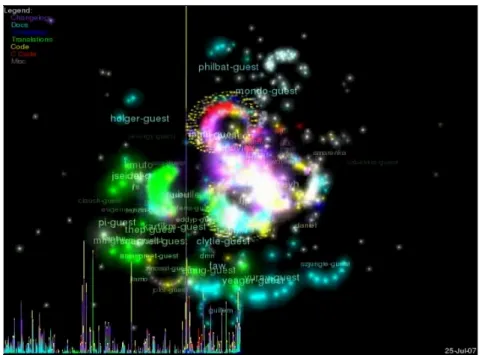
4.3 The code_swarm visualization: an experiment in organic software visualization . . . 35
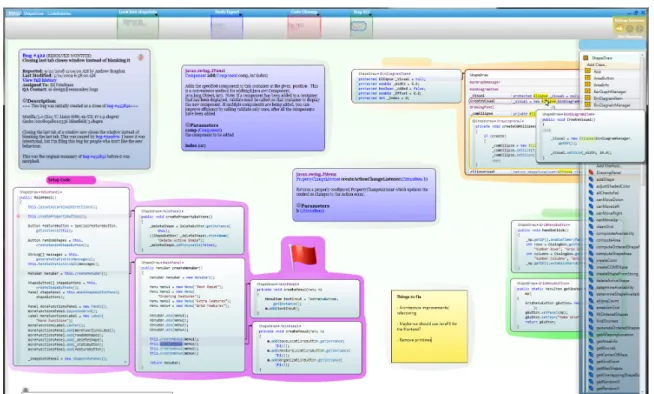
4.4 A screenshot of Code Bubbles . . . 38
5.1 DFlow: Observing, filtering, and propagating IDE interactions . . . 46
5.2 The model for interaction data of DFlow . . . 47
5.3 The UI of the manual version of DFlow . . . 49
5.4 The functioning of the manual version of DFlow . . . 49
5.5 The functioning of the automatic version of DFlow . . . 49
5.6 The functioning of DF2low, the most recent version of DFlow . . . 50
5.7 Partial behavioral reflection realized with sub-method reflection . . . 51
6.1 A development session at a glance . . . 55
6.2 Visualizing Java development activities . . . 58
6.3 Visualizing Smalltalk development activities . . . 58
6.4 A raw interaction history recorded with DFlow . . . 59
6.5 DFlow interaction history with Navigation Activities . . . 59
6.6 DFlow interaction history with Navigation and Editing Activities . . . 59
6.7 DFlow interaction history with Navigation, Editing, and Inspecting Activities . . . 60
6.8 DFlow interaction history with all the Activities . . . 60
6.9 The case of editing after inspection . . . 60
6.10 A raw interaction history recorded with Plog . . . 62
6.11 Plog interaction history with Navigation Activities . . . 62
6.12 Plog interaction history with Navigation and Editing Activities . . . 62
6.13 Plog interaction history with Navigation and Editing Activities . . . 63
6.14 Development activities for all sessions . . . 64
7.1 Sprees and Activities from fine-grained interaction histories . . . 74 xi
xii Figures
7.2 How do developers spend their time? . . . 77
8.1 The Code Browser: The main UI to Navigate and modify code in the Pharo IDE . . 84
8.2 Navigating source code in the Pharo Code Browser: (a) Selecting a Package, (b) a Class, (c) a Protocol, and (d) a Method . . . 87
8.3 Sorting entities to minimize the∆-cost . . . 89
8.4 Navigation Efficiency per developer [∆-cost + sequence] . . . 91
8.5 The Pharo Debugger UI . . . 91
8.6 The Senders UI (a) and the Implementors UI (b) for the method size . . . 92
8.7 Navigation Efficiency considering Navigations outside the Code Browser . . . 93
8.8 Results – UI-Aware Navigation Efficiency per developer . . . 94
9.1 Principles and proportions of the visualization . . . 100
9.2 Visualizing the same session (a) before and (b) after the removal of pauses . . . 102
9.3 Development story for D5: “The Inspection Valley” . . . 104
9.4 Development story for D3: “Implement First, Verify Later” . . . 105
9.5 Development story for D3: “Home Sweet Home” . . . 106
9.6 Development story for D5: “Curing the Window Plague” . . . 107
10.1 Visualizing working sets: visualization principles . . . 112
10.2 The principles of the force-based layout . . . 114
10.3 Example of the “U Can’t Touch This” pattern . . . 119
10.4 Two examples of the “Past: To Edit or Not To Edit” pattern . . . 120
10.5 Example of the “The Guiding Star” pattern . . . 121
10.6 Example of the “Stay Focused, Stay Foolish!” pattern . . . 122
10.7 Two examples of the “Moving in Circles” pattern . . . 123
10.8 Example of the “The Past Awakens” pattern . . . 124
10.9 Example of the “Multi-Part Session” pattern . . . 125
10.10 Example of the “Thirst for Knowledge” pattern . . . 126
10.11 Example of the “The Working Funnel” pattern . . . 127
10.12 Another example of the “The Working Funnel” pattern . . . 128
11.1 An example of the “Activity Forest” view . . . 130
11.2 An example of the “Activity Timeline” view . . . 131
11.3 An example of the “Cumulative Activity” view . . . 131
11.4 An example of the “Workspace View” . . . 132
11.5 Subsequent moments visualized through the “Workspace View” . . . 132
11.6 Cumulative Activity View for a bug-fixing session of Alice . . . 133
11.7 Part of the Activity Forest for a bug-fixing session of Alice . . . 133
11.8 Combined UI View and Activity Timeline for a bug-fixing session of Alice . . . 134
11.9 Two Workspace Views of the bug-fixing session of Alice . . . 134
11.10 Cumulative Activity View of the enhancement session of Bob . . . 135
11.11 Part of the Activity Forest of the enhancement session of Bob . . . 136
11.12 Three Workspace Views of the enhancement session of Bob . . . 136
11.13 The UI View of the enhancement session of Bob . . . 136
11.14 DFloWeb composed of (1) a Navigation Bar, (2) a Session Log, (3) a Timeline, and (4) the Visualization Canvas . . . 137
11.15 Visualization principles of DFloWeb . . . 138
Figures xiii
11.17 A Fraction of an Enhancement Session Depicted with DFloWeb . . . 140
11.18 The Same Session of Figure 11.17 at a Later Time . . . 140
11.19 DFloWeb Depicting a Bug-Fixing Session . . . 141
12.1 A screenshot of Pharo IDE manifesting the Window Plague (top left) and the same environment after enabling the Plague Doctor (bottom right) . . . 146
12.2 The Settings of the Plague Doctor . . . 148
13.1 Main UIs to display code: (a) Browsers, (b) Debuggers, and (c) Message Lists . . . . 154
13.2 Visualizing a snapshot of a session (left) and the corresponding screen regions used to measure the chaos (right) . . . 157
13.3 Session snapshots explained . . . 158
13.4 Elision and Layout Strategies in a nutshell . . . 161
13.5 Elision strategy for (a) Code Browsers, (b) Debuggers, and (c) Message Lists . . . 162
14.1 Potential architecture for the infrastructure of Eye . . . 170
14.2 Treemap of IDE interactions . . . 173
14.3 The UI of the Smalltalk-80 IDE (1983) compared with the Pharo IDE (2017) . . . 174
14.4 The UI of Eclipse 1.0 (2001) compared with Eclipse Oxygen (2017) . . . 174
A.1 The Blended City – Visualization principles and proportions . . . 204
A.2 The same view of Figure A.1 with different ingredients (0% - 100% - 50%) . . . 205
A.3 Color wheel and triadic color scheme . . . 206
A.4 Linear color blend on triadic color scheme . . . 207
A.5 Aging process: example in the Timeline . . . 207
A.6 The architecture of the Blended City . . . 208
A.7 View of the City with all the Activities . . . 209
A.8 Spec and Morphic Market Districts . . . 211
A.9 Changes in the Pharo system . . . 212
A.10 The changes of GT-Tools Packages . . . 213
A.11 A view of the system highlighting only stack traces and developer interactions . . . . 214
B.1 Session Digest: How have you spent your time? What did you do? . . . 219
B.2 Activities and time components in a sunburst visualization . . . 220
Tables
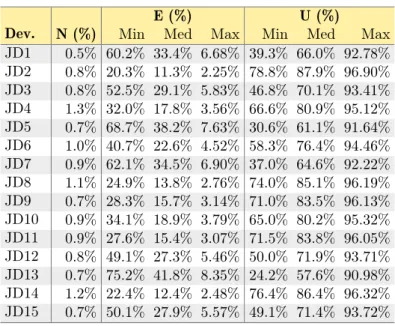
5.1 List of interaction data events recorded by DFlow . . . 48 6.1 Dataset – Smalltalk sessions data per type . . . 55 6.2 Dataset – Smalltalk sessions data per developer . . . 56 6.3 Dataset – Java sessions data per developer . . . 57 6.4 Results – Amount of Understanding in Smalltalk sessions varying PE and PI . . . 63 6.5 Results – Amount of Understanding in Java sessions varying the estimate of PE . . . 64 6.6 Results – Development activities per session type . . . 65 6.7 Results – Smalltalk development activities per developer . . . 65 6.8 Results – Java development activities per developer . . . 66 7.1 Dataset – Total values grouped by developer . . . 71 7.2 Dataset – Average values grouped by developer . . . 71 7.3 Dataset – Demographics of developers . . . 72 7.4 Results – Time components aggregated per developer . . . 78 7.5 Results – Correlation of Understanding time (UND) with the number of OI events
(NOI) and the Duration of the time spent Outside the IDE (DOI) . . . 80 8.1 Dataset – Study on the Navigation Efficiency . . . 86 8.2 Results – Preliminary estimates for Navigation Efficiency . . . 88 8.3 Results – Navigation Efficiency with ∆-cost . . . 90 8.4 Results – Navigation Efficiency with UI-Aware navigation cost . . . 94 8.5 Results – An upper bound for Navigation Efficiency: UI-Aware Navigation Efficiency
considering all the entities involved in a development session . . . 95 9.1 Dataset – Sessions statistics grouped by developer . . . 102 9.2 Dataset – Development events grouped by developer . . . 103 9.3 Dataset – Window information grouped by developer . . . 103 9.4 Results – Track and Flow characterization of developer session . . . 109 10.1 Dataset – Totals values and values aggregated per session . . . 117 13.1 Dataset – DFlow dataset to characterize and measure chaos . . . 155 13.2 Space Occupancy Metrics . . . 157 13.3 Results – Distribution of Space Occupancy Metrics across all sessions . . . 158 13.4 Chaos-Levels: Comfy, Ok, Mess, and Hell . . . 159 13.5 Results – Average time spent per chaos-level . . . 159 13.6 Results – Chaos, UI, and Understanding Time . . . 160 13.7 Results – Percentage gain of Space Occupancy Metrics . . . 163 13.8 Results – Percentage gain and delta time . . . 164 13.9 Results – Average Weighted Overlapping per chaos-level . . . 164 A.1 Dataset – Source code changes in the considered period . . . 202
xvi Tables
A.2 Dataset – Stack traces data in the considered period . . . 203 A.3 Dataset – IDE interaction data in the considered period . . . 204
Part
I
1
Introduction
O
nce upon a time people used punch cards to input data and sequences of instructions in programmable machines. The first programmable machine, the “Jacquard loom”, was invented in 1801 [McC99]. This revolutionary loom “reads” patterns from a punch card and automatically weaves them into the silk. Physical motion was replaced with electrical signals with the advent of the first electronic general-purpose computer: the ENIAC [HHG46]. Starting from the 1950s several programming languages were created. Notable examples include assembly that first appeared in 1949, FORTRAN (1957), LISP and ALGOL (1957), and COBOL (1959). Early computer programs, similar to the instructions of the Jacquard loom, were stored on punched cards. At this time programming was achieved by physical motion. When there was an error, for example, programmers used physical patches to correct wrong holes in punched cards by covering them. With the advent of modern programming languages, developers replaced punch cards with source code files. Programming became more and more an activity related to text files and compilers (or interpreters, depending on the language). After the Compiler Era, the next big revolution happens with the development of Integrated Development Environments, also known as IDEs.An IDE is “a large collection of integrated tools, each accessed through a uniform user in-terface” [Seb12]. The early IDEs are Dartmouth BASIC (1964) with its interactive command line, Smalltalk-80 (1980) with the first graphical user interface (GUI), and Turbo Pascal (1983). Since then, a plethora of different IDEs has been developed. Some IDEs are very specific for a language, while others provide efficient multi-language support. The birth of the Java program-ming language, for example, originated a fight between Eclipse1 and IntelliJ IDEA2to determine
the dominant Java IDE [Gee05]. Eclipse, originally developed by IBM and handed over to the Eclipse Foundation in 2001, turned out to be the most appreciated Java IDE [Gee05]. One of the main reasons for success was its plug-in architecture that enables developers to develop tools to extend the current IDE capabilities [Gee05]. However, developers have plenty of other IDEs to choose from. According to the Top IDE Index [Car16], the most used IDEs are Visual Studio, Eclipse, Android Studio, Vim, and NetBeans. The 5 most used languages in 2017 are Java, C, C++, C#, and Python [TIO17].
Today, most developers use their favorite IDE to manipulate source code and to perform the vast majority of their software development activities [GLD05, GGD07, Seb12]. Codeanywhere, Inc.,3 for example, collected answers from two thousand developers and reported that the most
1Seehttps://www.eclipse.org 2
Seehttps://www.jetbrains.com/idea
3Seehttp://codeanywhere.com
4 Introduction
popular tools used by developers are Notepad++, Sublime Text, Eclipse, NetBeans, IntelliJ IDEA, and Vim [COD15]. Among them, there are IDEs and highly configurable stand-alone text editors. Text editor aficionados, in fact, use tools such as Vim or Emacs, instead of IDEs. Our conjecture is that these developers reached such a high level of efficiency in manipulating source code with text editors that they do not need the tools and facilities offered by IDEs. Even though it would be interesting to investigate why some developers prefer text editors to IDEs, we only focus on developers using IDEs to support their development activities.
IDEs aim at easing the development and maintenance of software systems by providing dif-ferent tools and facilities to support various kinds of activities [KMCA06, SMDV08]. Developers use IDEs to read, understand, and write source code. For reading and writing, the most used tool is the code editor (or code browser). To understand code—in addition to reading it—developers also take advantage of tools such as the debugger, the package explorer, or the reference browser. It has been showed that developers spend more time reading code than writing it [VMV95]. Reading code is the building block of program comprehension which has been estimated to oc-cupy more than half of the working time of a developer, e.g., [ZSG79, FH83, Cor89, MML15b]. In addition to being time consuming, program comprehension is also one of the most challeng-ing tasks performed by developers [LVD06]. To understand source code, developers need to navigate the software space [KM05]. In this process, they construct a mental model of the sys-tem [SLVA97, Wal03, RCM04, KMCA06], i.e., a link between the source code and their mental representation [FGS11], which is essential to support source code comprehension.
Navigating, reading, understanding, and writing source code inside the IDE are high-level activities which are composed of several low-level events, known as “IDE interaction data” [KM05, MKF06]. Examples include opening a code editor on a method, inspecting an object while debugging, moving the cursor of the mouse, or writing a new line of code in the body of a method. IDE interactions capture the intentions of developers and manifest their mental models [GSBS14]. For this reason, we believe that leveraging this information inside the IDE can provide benefits to different phases of the development process. In addition, this data can be analyzed retrospectively to better understand the behavior of developers inside the IDE. Existing research already showed the importance of interaction data. Frey et al., for example, claimed that future program investigation tools need to track the way developers navigate code to support software engineering activities [FGS11]. According to Murphy et al., interaction data can be used to evolve IDEs according to user needs [MKF06]. Following this intuition, IDEs need to be aware of interaction data and intensively exploit it to support the development workflow.
However, creating an “Interaction-Aware IDE” is a very demanding goal. In the first place, since IDEs neglect this information, the first step of our research consists in modeling and persisting interaction data. For this purpose we developed DFlow: A framework to model, profile, and persist IDE interactions [ML13a, Min14, MML15b]. Interaction data is a largely unexplored source of information. In its raw form, it is a long stream of events and developers daily generate thousands of such events. The second challenge of our research is therefore to interpret these streams of events. To this aim we devised various models to reconstruct, for example, high-level programming activities from interaction histories or measure how efficient are developers in navigating the software space. The last, and probably the most challenging, part of our research consists in supporting software development with interaction data. Examples include visualizations to ease the navigation of previously interacted program entities and means to adapt the user interface of the IDE.
1.1 Our Thesis 5
1.1 Our Thesis
We formulate our thesis as follows:
“Interaction-Aware Development Environments enable novel and in-depth analyses of the behavior of software developers and set the ground to provide developers with effective and actionable support for their activities inside the IDE.”
Roberto Minelli, 2017 To validate our thesis we implemented DFlow, a framework to model and record the inter-action data events happening inside the IDE [ML13a, Min14, MML15b]. On top of DFlow we devised various approaches to interpret and leverage this novel source of information.
1.2 Contributions
The contributions of our research can be grouped in two high-level categories: i) modeling & analyzing interaction histories and ii) supporting tools.
1.2.1 Modeling & Analyzing Interaction Histories
• We devised models to reconstruct development activities from interaction data to under-stand how developers spend their time inside the IDE [MMLK14, MML15b];
• We devised approaches to model source code navigation efficiency in the IDE and applied them on a large dataset of development sessions [MML16a];
• We devised visual approaches to understand different aspects of developers interactions, such as the workflow of developers and how they use the GUI of the IDE [ML13b, MMLB14, MBML14];
• We devised an approach to visualize the evolution of the working set, i.e., the program entities involved in a development session [MML16b];
• We studied how the entropy of the user interface of an IDE evolves and we proposed a mechanism to tame it [MMRL16];
• We defined the concept of “Self-Adaptive IDEs” and envisioned how they can leverage inter-actions with different information sources to support the workflow of developers [Min14]; • We devised an approach to visualize three data sources at once: interaction data,
fine-grained source code changes, and stack traces [SMML15];
• We envisioned how to use interaction data to introduce a gamification layer on top of the IDE [MML15a].
1.2.2 Supporting Tools
• We developed DFlow, a non-intrusive profiler that records IDE interactions and makes them available for further use [ML13a, Min14, MML15b];
• On top of DFlow, we developed The Plague Doctor [MML15c], a tool that leverages interaction data to reduce the so called window plague [RND09].
6 Introduction
1.3 Outline
This section presents the outline of our dissertation, which is structured in 5 parts.
Part I: Prologue. The first part of our dissertation sets the ground for our research by introducing interaction data and the related fields.
Chapter 2 (p. 9) introduces interaction data, the main source of information of our research,
and traces the history of programming, from punch cards to IDEs.
Chapter 3 (p. 17)details the Pharo IDE, the target IDE for our research. A reader familiar with
this IDE can safely avoid reading this chapter. The chapter details the object model of Pharo, its UIs, and explains why we chose Pharo.
Chapter 4 (p. 27)presents an overview of the research fields interested by this dissertation. This
includes existing approaches to record and to analyze interaction data, fine-grained source code changes, biometric data, and approaches to support developers inside the IDE. Finally, the chapter addresses ethical issues arising from the collection of development data. Part II: Modeling, Recording, and Interpreting Interaction Data(p. 45). This part describes how to record and interpret interaction data, which is the key to make it available for further use.
Chapter 5 (p. 45) discusses the contributions of our research in recording interaction data
in-side the IDE. In particular the chapter presents DFlow, the IDE interaction profiler we developed to support our research.
Chapter 6 (p. 53) describes how we can use interaction histories to estimate how developers
spend their time. In particular, the chapter focuses on the case of program comprehension, one of the core activities of software development.
Chapter 7(p. 69)refines the model introduced in Chapter 6 and explains how to use interaction
histories to reconstruct high-level development activities.
Chapter 8 (p. 83) focuses on the use of interaction data to model and measure how efficiently
developers navigate source code.
Part III: Visual Analytics of Development Sessions (p. 99). The third part of our dissertation describes a number of visual approaches to gather further insights from interaction histories.
Chapter 9(p. 99)illustrates a visual approach to better understand how developers use the user
interface of the Pharo IDE.
Chapter 10(p. 111)presents a visual approach to understand the evolution of working sets during
development sessions.
Chapter 11 (p. 129)illustrates a catalog of visualizations to support visual storytelling of
devel-opment sessions.
Part IV: Supporting Developers with Interaction Data(p. 145). The fourth part of our dissertation describes how to leverage interaction data to support software development inside the IDE.
1.3 Outline 7
Chapter 12(p. 145)presents the Plague Doctor: A tool built on top of DFlow that support
developers by mitigating the so-called window plague [RND09].
Chapter 13 (p. 151)explains how to use interaction data to characterize and quantify the “level
of chaos” in an IDE and proposes an approach to tame it.
Part V: Epilogue(p. 169). The fifth part concludes our dissertation by summarizing the work and highlighting future directions for our research.
Chapter 14 (p. 169)outlines possible research directions for the future.
Chapter 15 (p. 177)summarizes and concludes our work.
Appendices (p. 201). At the end of this dissertation we include two side works we carried on during our research.
Appendix A (p. 201) details a visual approach that depicts multiple concerns concurrently by
blending them together. Our approach considers interaction data, source code changes, and stack traces.
Appendix B (p. 217) presents a vision that uses interaction data to introduce a gamification
2
IDEs and Interaction Data
T
his chapter introduces the context of our research: Integrated Development Environ-ments and interaction data, i.e., all the events that programmers carry out during devel-opment. Nowadays most developers use an IDE as their main vehicle to develop software systems. At the beginning of this chapter we take a step back and trace the history of program-ming, explaining how we moved from punch cards to modern development environments.During development, programmers interact with a number of facilities and tools: web browsers, bug trackers, IDEs, mail clients, etc. In practice, all these activities generate thousands of events that we can group under the name of interaction data. In this chapter we briefly describe why and how we believe in the importance of this largely unexplored source of information to both retrospectively analyze the behavior of developers and provide them with effective and actionable support inside and outside the IDE. Our research focuses on the interactions happening inside the IDE. For this reason, this chapter emphasizes and details this specific type of interactions. Structure of the Chapter
Section 2.1 traces the history of programming, from programmable looms to IDEs. In Section 2.2 we introduce interaction data and refine the scope to the interactions happening inside the IDE, the real core of our research. Finally, Section 2.3 summarizes and concludes the chapter.
10 IDEs and Interaction Data
2.1 From Punch Cards to Modern Development Environments
O
nce upon a time people used punch cards (or perforated cards) to input data and se-quences of instructions in programmable machines. In 1801, Joseph-Marie Jacquard devised a programmable loom, known as “Jacquard loom”, to automatically weave silk by reading patterns from a series of punch cards [McC99].“We use the term ‘standing on the shoulders of giants.’ They aren’t making components but they use existing components. So, if anything, [IDEs] made great programmers greater, but also made good programmers better.”
— David “I” Intersimone Delphi Evangelist
Inspired by the work of Joseph-Marie Jacquard, in 1837 Charles Babbage designed the “An-alytical Engine” considered the first general-purpose programmable computing engine [Swa16]. According to its design, developers would use punch cards to input data in the machine, the same mechanism of the Jacquard loom. Babbage never managed to complete the construction of this machine at his time. A few years later, Ada Lovelace specified a method for calculat-ing Bernoulli numbers with the Analytical Engine. This is often recognized as the world’s first computer program [FF03].
The first form of programming, thus, was performed through physical motion: punched cards, knobs, and switches. In 1942 physical motion was replaced by the electrical signals when the US Government built the so-called ENIAC: the first electronic general-purpose computer [HHG46]. In the same period John von Neumann developed two concepts that shaped the development of programming languages: shared-program technique and conditional control transfer [CCH17]. The former states that hardware should be simple and not tailored to every single program. Instead, the complexity should be in the instructions to control the hardware. Conditional branching, or conditional control transfer, states that instructions should not be necessarily executed in sequential order, i.e., the execution of a program can be altered by logical branches (e.g., If-then expressions). John von Neumann is also known for the stored-program digital computer (or Von Neumann Architecture) [CCH17]. In this model, program instructions and data are stored in the same memory location enabling instructions and data to be modified in the same way. The first machine implementing this concept was the EDVAC (Electronic Discrete Variable Automatic Computer), developed by John Mauchly and Presper Eckert, who previously designed the ENIAC [vN93].
Programming with assembly languages was very tedious and error prone. For this reason, the 1950s see the birth of more practical alternatives to assemblers: the so-called high-level program-ming languages. Short Code, developed by John Mauchly in 1949, was the first such language [Seb12]. Unlike assembler, in which there is a strong correlation between the language and ma-chine code instructions, in Short Code each statement represents a mathematical expression in human-readable form. This language, however, has to be translated to machine code and, as a result, was significantly slower than machine code. In the same period, Alick Glennie developed Autocode, often considered as the first language to use a compiler1 to automatically convert the
1
The answer to “Who wrote the first compiler? ” is very controversial: In 1952 Alick Glennie developed Autocode with its compiler and Grace Hopper finished her compiler for the A-0 System.
2.1 From Punch Cards to Modern Development Environments 11
language into machine code [Ben12]. In 1957 it was the turn of FORTRAN, a high-level gen-eral purpose imperative programming language designed and developed by John Backus at IBM [Bac78]. Thanks to its performance for computationally intensive applications, FORTRAN is still used today in cutting-edge research [Phi14]. Examples include atmospheric modeling and weather prediction carried out by the National Center for Atmospheric Research (NCAR), clas-sified nuclear weapons and laser fusion codes at Los Alamos & Lawrence Livermore National Labs, and NASA models of global climate change [Phi14].
A few years later, a team led by Grace Hopper developed FLOW-MATIC, recognized as the first programming language to use English-like statements to express operations [Sam69]. In the same period John McCarthy (MIT) developed LISP and a consortium called CODASYL2
developed COBOL. As the expansion of the acronym suggests (i.e., “LISt Processor”), LISP was invented to efficiently manipulate lists, COBOL, instead, was intended for business use. LISP pioneered many of the concepts that are now considered the foundations of software engineer-ing, such as tree data structures, automatic storage management, dynamic typengineer-ing, higher-order functions, and recursion [Dal17]. In the following years were defined most of the fundamental programming paradigms that are still in use today. ML was the father of all the statically-typed functional programming language, Prolog was the first logic programming language, and Smalltalk sets the ground for object-oriented languages [Kay93]. Smalltalk’s development started in 1969 by Alan Kay, Dan Ingalls and Adele Goldberg at Xerox Palo Alto Research Center (PARC). The first public version, Smalltalk-80, appeared only after ten years. A peculiarity of Smalltalk is that it provides a live development environment featuring powerful debugging and inspection tools.
“A programming environment is the collection of tools used in the development of software. This collection may consist of only a file system, a text editor, a linker, and a compiler. Or it may include a large collection of integrated tools, each accessed through a uniform user interface.
In the latter case, the development and maintenance of software is greatly enhanced.” — Robert W. Sebesta [Seb12]
A “programming environment” is a set of tools to support software development. For example, the UNIX environment released in the 1970s, includes tools to create, run, and maintain software. Essential tools are a text editor and a compiler (or interpreter, depending on the language). The “large collection of integrated tools, each accessed through a uniform user interface” is better known as “Integrated Development Environment” or IDE. Together with Smalltalk, also other languages started to provide similar environments. In a broader sense, the very first language that implemented an IDE was Dartmouth BASIC back in 1964. It provided an interactive command line interface (CLI) that integrates editing, compilation, debugging, execution, and file management comparable to modern IDEs. The advent of the Graphical User Interface (GUI), however, changed everything. The Alto personal computer, developed at Xerox PARC in 1973, was the first computer to implement the desktop metaphor and to provide a GUI controlled with a mouse. A few years after, Steve Jobs and Jef Raskin evolved these ideas to realize their Apple
2
CODASYL stands for “Conference on Data Systems Languages”. It was an organization founded in 1957 by the U.S. Department of Defense aimed at developing programming languages.
12 IDEs and Interaction Data
Lisa, in 1983. In the same year, Borland Ltd. launched Turbo Pascal: An IDE for Pascal that lets developers write, compile, and debug code. In 1985 Microsoft launched the first version of its Windows operating system. However, we have to wait until the early 90s to have a stable and usable version (Windows 3.0 and 3.1). In the same period, Microsoft released Visual Basic (VB), sometimes wrongly credited as the first IDE.
2.1.1 From the 1980s to the Present Day
The 1980s and 1990s see the rise of IDEs. With its Graphical User Interface (GUI), powerful debugger and inspection tools, Smalltalk-80 is often recognized as the first IDE. Other two examples of early IDEs were Turbo Pascal developed in 1983 and Visual Basic in 1991.
“If Visual Basic hadn’t happened, Delphi wouldn’t have happened,
and Visual Studio wouldn’t have happened, and PC guys would be pounding out forms textually.”
— Jeff Duntemann [Pat13] Former Employee at Xerox Corporation
In 1995 Borland—that previously developed Turbo Pascal—released Delphi, an IDE aimed at building applications rapidly by visually dragging and dropping components. In 1997 Microsoft released its new IDE called Visual Studio. This IDE evolved until the present day and today is one of the most used IDEs worldwide. Eclipse and JetBrains IntelliJ IDEA, both released in the early 2000s, evolved until the present day, and are among today’s most used IDEs.
According to the Top IDE index [Car16], a ranking created by analyzing data coming from Google Trends,3 today the five most popular IDEs worldwide are Microsoft Visual Studio,4
Eclipse, Android Studio,5 Vim,6 and NetBeans.7 Codeanywhere, Inc.,8 surveyed more than 10,000 developers to discover the most popular tools and IDEs in practice [COD15]. Notepad++,9
Sublime Text,10 Eclipse, NetBeans, and IntelliJ IDEA are the five most used tools employed to develop source code. It is interesting to notice that in both studies emerge the fact that some developers prefer to use a highly configurable text editor, such as Vim or Sublime Text, instead of a full fledged IDE to develop source code. Even though this would be an interesting phenomena to investigate, in our dissertation we only focus on developers using IDEs to support their development activities.
2.1.2 Summing Up
In the last 200 years programmable looms and punch-cards evolved into full-fledged integrated development environments. Nowadays developers have all the tools and facilities to develop
3Seehttps://www.google.com/trends 4Seehttps://www.visualstudio.com 5Seehttps://developer.android.com/studio 6Seehttp://www.vim.org 7Seehttps://netbeans.org 8Seehttp://codeanywhere.com 9 Seehttps://notepad-plus-plus.org 10Seehttps://www.sublimetext.com
2.2 What is Interaction Data? Why is it Important? 13
software systems at their fingertips. While developing software system, developers perform dif-ferent kinds of high-level activities in the IDE, such as navigating, reading, and understanding code. These activities are composed of several low-level events, known as “IDE interaction data” [KM05, MKF06], that are the essence of our research.
The following section provides more details on interaction data and explains why we believe in the importance of this largely unexplored source of information.
2.2 What is Interaction Data? Why is it Important?
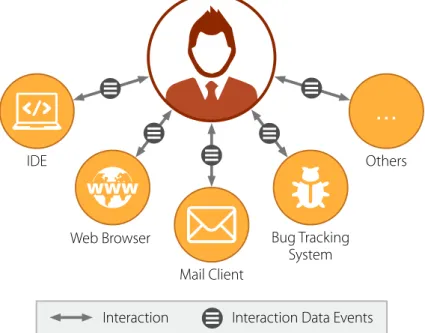
We call “interaction data” the information encapsulated in an interaction between two subjects. In our context, one of the two subjects is represented by the developer sitting in front of her workstation carrying on her development activities. The other subject, however, can be of heterogeneous nature. In a workday, developers interact with various tools and facilities, such as IDEs, web browsers, mail clients, bug trackers, etc. as depicted in Figure 2.1.
…
Mail Client IDE Bug Tracking System Web BrowserInteraction Interaction Data Events Others
Figure 2.1. Interactions between the developer and different sources
Interacting with these sources generates thousands of events, that we call interaction data events. If we consider the web browser, for example, users perform interactions such as open-ing a new tab, typopen-ing a website in the address bar, addopen-ing a website to bookmarks, etc. In essence, these events precisely capture the actual behavior of developers (or users). By leverag-ing this source of information we can better understand the habits of developers and potentially supporting them by finding, and isolating, the bottlenecks in their ordinary workflow.
Unfortunately, interaction data is hardly available and largely unexplored. For example, IDEs do not record the interactions of developers while carrying out their development activities. To overcome this limitation, researchers developed tools and plug-ins to partially keep track of interaction data, such as Mylyn [KM05]. The interactions between users and tools are of ephemeral nature, making it hard to directly exploit their potential. Thus, the first challenge for our research is to persist these interactions, as discussed in Chapter 5.
14 IDEs and Interaction Data
Considering the interactions with all the available sources of information makes interaction data an extremely broad domain. To restrict the field, we concentrate our research only on the interactions happening inside the IDE, or IDE interaction data,11as detailed in the next section.
2.2.1 Interactions with the IDE
IDEs ease the development and maintenance of software systems by offering tools and facilities to support different development activities [KMCA06, SMDV08]. Developers use the IDE to navigate, read, understand, and ultimately write source code. To do so, they have to interact with various user interfaces such as the code editor (or code browser), the debugger, and the package browser. For example, when a developer modifies the source code of a method, she will press a sequence of keystrokes to change the body of the method and she may also re-arrange the user interfaces of the IDE to better support code editing activities. We distinguish different types of events in a taxonomy, detailed in Chapter 5, that includes meta and low-level events. Figure 2.2 depicts the flow of interactions between the developer and the IDE.
Developer IDE Navigation Edit UI Inspect User Input
Interaction Flow IDE Interactions IDE Feedback Events Meta Events Low-Level Events
Figure 2.2. The flow of interactions between the developer and the IDE
A development session is made of a continuous feedback-loop between the developer and the IDE: The developer “asks” something to the IDE and receives an “answer” from it. All the requests that a developer forwards to the IDE are, in essence, interaction data. We call the answers supplied by the IDE “feedback events”. For example consider a scenario where Alice wants to edit the source code of a method. In the first place she has to reach the method of interest. To do so, she can either jump directly to the method (i.e., by using the search capabilities of the IDE) or perform a sequence of navigations, likely following structural relationships between code entities (i.e., in Eclipse, for example, she can use the “Package Explorer”). In both cases, these two high-level activities, are composed of several low-level events, that are known as “IDE interaction data” [KM05, MKF06]. For example, to trigger the search interface, she can either press a keyboard shortcut (e.g., +‘F’) or click on an entry in a contextual menu in the IDE
window (e.g., Edit . Find). In both cases, Alice will perform sequences of mouse movements, 11
For the sake of readability, from now we may omit the term “IDE” and use the general expression “interaction data” to indicate all the interactions happening inside the IDE.
2.3 Programmable looms, IDEs, and Interaction Data 15
clicks, and keystrokes (or keyboard shortcuts). In turn, the IDE will provide her with answers, for example, by popping out the search user interface when requested. Then she types in the query, by means of a series of keystrokes, and the IDE answers by opening a user interface with the results. To complete her tasks, Alice will continue to interact with the IDE generating, by the end of the day, thousands of interaction events. These events are the core of our research.
2.3 Programmable looms, IDEs, and Interaction Data
This chapter summarized the history of programming, from the Jacquard loom to the first general-purpose programmable computing engine, until the raise of modern IDEs.
Nowadays most developers use an IDE to develop software systems. While doing so they generate millions of interaction events that precisely capture their behavior. In this chapter we introduced this largely unexplored source of information and explained why we believe it is important. The aim of our research is to study and leverage the flow of interactions between developers and IDEs. However, as discussed in the chapter, developers have many different IDEs to choose from. In our research, we decided to target the Pharo IDE, an open-source IDE that supports a language inspired by Smalltalk. The next chapter details this IDE and explain how it differs from mainstream IDEs.
3
The Pharo IDE
T
his chapter details Pharo, the target environment for our research, which is both an object-oriented programming language inspired by Smalltalk and an open-source IDE. Throughout the chapter we discuss what is an “image”, explain the rules underlying the Pharo object model, and introduce some terminology. Later we detail the various user interfaces offered by this IDE to support development activities. Examples include the code browser, the playground, and the debugger. We conclude the chapter by motivating why we carried out our research in Pharo.This chapter presents the Pharo IDE to ease the comprehension of the rest of this dissertation. A reader familiar with this IDE can safely skip this chapter.
Structure of the Chapter
Section 3.1 introduces the Pharo IDE and its image-based architecture. Section 3.2 details its object model and source code organization. In Section 3.3 we discuss the most used user interfaces of the Pharo IDE while in Section 3.4 we explain why we decided to work in Pharo.
18 The Pharo IDE
3.1 What is Pharo?
Pharo is both a programming language and a development environment.1 The Pharo language is inspired by Smalltalk—the father of all object-oriented programming languages [Kay93]. Its user interface is a window-based environment focused on simplicity and immediate feedback. The example depicted in Figure 3.1 shows the Pharo Main Window with 6 different user interfaces (i.e., windows) opened. In a development session, on average, developers interact with 24 win-dows [MMRL16]. At any given moment, only one of these winwin-dows is in focus and acts as target for all user interactions (Window D in Figure 3.1).
A B D C E F
Figure 3.1. The Pharo Main Window and its UIs: (A) Playground, (B) Code Browser (or Code Editor), (C) Inspector, (D) Spotter Search Interface, (E) Finder UI, and (F) Debugger
Pharo is Image-Based: It combines code and data in a single cross-platform file known as “Image”. An Image is a snapshot of an entire running system at any given point in time. It contains the state of all the objects of the system at that moment, including classes and methods, since they are also objects. Every time a developer closes the Image, Pharo freezes the state of all the objects. When the developer opens the Pharo image again, the system restores all the objects with their state.
Besides the Image file, there is another file that composes the Pharo environment: the Changes file. This file logs all the source code changes happening in the system.
3.2 The Object Model of Pharo 19
3.2 The Object Model of Pharo
Pharo is an object-oriented language and, as such, to combine state and behavior, developers use high-level constructs called objects. The Pharo language is inspired by Smalltalk. Its object model relies on 10 simple rules [DZHC17]. For example, Rules 1 and 2 say that “everything is an object” and that “every object is an instance of a class”. This captures the “pure” essence of object-oriented programming being lean, simple, elegant, and uniform [DZHC17]. Primitive values such as integers, booleans, and characters are also instances of their corresponding classes, i.e., objects. Classes are no exception: They are also objects, thus instances of other classes: “Every class is an instance of a metaclass” (Rule 6). In Pharo, “the metaclass hierarchy parallels the class hierarchy” (Rule 7).
Except for a few syntactic elements, “everything happens by sending messages” (Rule 4). Messages are similar to methods in other object-oriented languages. A message is composed of i) a selector and ii) some (optional) message arguments. A message is sent to a receiver. The combination of a message and its receiver is called “message send”. There are three types of messages: unary, binary, and keyword. Unary messages do not take parameters, e.g., Object
new. Binary messages always involve two objects, e.g.,100 + 20.2 Keyword messages consist of one or more keywords, each ending with a colon and taking an argument, e.g.,aPoint x: 10 y: 32. Message sends can be chained: For example, to initialize a new Personcalled Roberto that is 29 years old one can invoke the constructor (i.e., new) followed by the message name:age:as
follows: Person new name: ’Roberto’ age: 29.
3.2.1 Source Code Organization
Pharo organizes source code in packages, classes, metaclasses, methods, and protocols. • A package is a group of related classes and methods.
• A class defines the structure (i.e., variables) and the behavior (i.e., methods) of its in-stances. Classes are objects and thus instances of a class (Rules 1 and 6).
– In Pharo, each class is the unique instance of its metaclass. In the object model there is a metaclass hierarchy parallel to the standard class hierarchy. The developer has full access to the so called “class side”, thus she can and navigate and modify metaclasses and their methods. A common use of a metaclass is to create custom constructors, instead of using the ordinary new method to create a new instance of a class.
• A protocol (or category) is a group of methods sharing the same intent. It is mostly used for documentation purposes. A common established protocol is called “accessing” and groups all the accessors (i.e., getters and setters) of a class.
• Message, selector, or method are terms used interchangeably to indicate an operation that can be performed by an object. A common notation to identify a message isP1.Foo»#bar
which denotes the messagebar of classFoo, contained in packageP1.
• Finally, Pharo provides local and shared variables. Local variables belong to an object while shared variables can be shared globally, between a class, its subclasses, and its instances (i.e., class variables), or between a group of classes (i.e., pool variables).
20 The Pharo IDE
3.3 The Most Used UIs in the Pharo IDE
Pharo provides developers with different kinds of windows that support one or more development activities. This section lists the principal UIs of Pharo and explains their main functionalities. 3.3.1 Code Browser
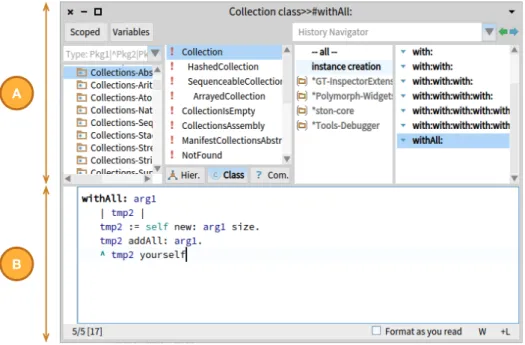
The Code Browser, depicted in Figure 3.2, lets the user perform the most essential development activities: navigating, reading, and writing code [GGD07]. This user interface is composed of an upper and a lower part, each aimed at different purposes.
A
B
Figure 3.2. The Code Browser of the Pharo IDE
The upper half of the code browser (see Fig. 3.2-A) features four columns that let the user perform structural source code navigation. To navigate to the source code of a method a de-veloper first selects the package that contains the class of interest in the first column. Then she selects the class in the second column, and finally the method on the last column of the browser. We detail the mechanics of navigation in Chapter 8, where we discuss how to measure the navigation efficiency of developers. The example in Figure 3.2 depicts a code browser after the navigation to the method#withAll: belonging to theCollectionclass, that is contained in
the Collections-Abstract package. The third column lists the so-called protocols (or method
categories). Its purpose is grouping related methods together. In the example, the method
#withAll: has been categorized as “instance creation” because this method is responsible to
instantiate a new Collectionobject. The selection of the protocol is optional.
Once the developer selects a method, the lower part of the code browser (see Fig. 3.2-B) displays its source code. The developer can use this text area to read and modify source code. 3.3.2 Workspace and Playground
Figure 3.3b depicts a Workspace (see Fig. 3.3b-A) and a Playground (see Fig. 3.3b-B). This UIs enable developers to run snippets of code. A common usage scenario for these UIs is to instantiate
3.3 The Most Used UIs in the Pharo IDE 21
a new object on-the-fly. In the example of Figure 3.3b, the developer uses a Workspace (and a Playground) to initialize a new OrderedCollection from the elements of anArray.3
A B
(a)
(b)
Figure 3.3. The Workspace (3.3a) and the Playground (3.3b) of the Pharo IDE
The Workspace has been almost completely replaced by the Playground in the Pharo IDE. The Playground, in fact, has the same capabilities of the Workspace and provides also additional features. For example, it remembers all the code snippets written by the developer and it enables developers to navigate them. However, when we carried on our research and data collection, developers had only the Workspace at their disposal. For this reason, the majority of our data only considers interactions with the Workspace and not with the Playground.
3.3.3 Inspector
Another key UI in the Pharo IDE is the Inspector, depicted in Figure 3.4. As the name suggests, this UI enables developers to inspect instances of objects. In the example below we are inspecting the object resulting from evaluating the code in Figure 3.3b that initializes anOrderedCollection
with fourIntegers: 1, 2, 3, and 4.
In Pharo everything is live, thus there is no distinction between compile- and run-time. This enables the developer to open an Inspector on every object and interacting with it (e.g., by adding elements to an array on-the-fly). The top part of this UI (see Fig. 3.4-A) lets developers browse the contents of the inspected object, similar to what other IDEs offer in their debug mode (or perspective). In this example, the inspectedOrderedCollectioncontains 4 items (internally
represented by an Arrayobject and two variables: firstIndex and lastIndex).4
The lower part of the Inspector (see Fig. 3.4-B) can be used to query the inspected object. To do so the developer can write any snippet of code that will be executed on the currently inspected object, i.e., self is bound to it. Queries can serve two purposes: Developers can
either perform general inquiries to gather a better understanding of the object or execute code that modifies the current object on the fly. In the example in Figure 3.4, the developer wants to remove the element at index 5 from the currently inspectedOrderedCollection.
3
The Smalltalk expression#(1 2 3 4)initializes anArraycontaining fourIntegers1, 2, 3, and 4.
22 The Pharo IDE
A
B
Figure 3.4. The Inspector of the Pharo IDE
3.3.4 Debugger
Buffer overflows are among the most common errors encountered by programmers. In Figure 3.4 the developer attempted to remove the fifth element from a collection of size 4. This triggers a
SubscriptOutOfBounds error, displayed in a Debugger window, shown in Figure 3.5.
The upper part (see Fig. 3.5-A) lets the user browse the methods on the call stack, the middle part (see Fig. 3.5-B) displays the code of the method selected in the call stack and enables the user to modify it on-the-fly, and the lower part acts as a simplified inspector (see Fig. 3.5-C). 3.3.5 Search User Interfaces: Finder and Spotter
The Finder, depicted in Figure 3.6a, is one of the two UIs offered by developers to search for code artifacts. This UI lets developers find code entities by performing a search among selectors (i.e., methods), classes, pragmas (i.e., code annotations), or all the source code present in the Pharo image. The user can also enter regular expressions to perform more advanced queries. The Finder also enables developers to restrict the scope of the search to a subset of Packages.
Figure 3.6b shows Spotter, the other search UI of the Pharo IDE [SCG+15]. It is a unified
search interface that combines different search tools into one. Spotter was introduced in a recent restyling of the Pharo IDE and aims at replacing the Finder UI. Spotter is a new tool and our dataset does not contain data about its usage. Kubelka et al. conducted a study to understand how developers use this tool [KBC+15].
3.3.6 Senders and Implementors Browsers
Figure 3.7 depicts the Senders (3.7a) and Implementors Browsers (3.7b) of the Pharo IDE for the methodwithAll:. Developers use these two UIs to browse references of methods. The structure
of these two UIs is similar: The top part provides a list of all the senders (or implementors) of a method, while the bottom part lets the user read and eventually modify the code of the method selected from the list above. Pharo follows a message passing strategy. Thus, in Pharo jargon, the senders of a method are all the methods in the system that invoke that method, or send that message. Implementors, are all the methods in the system with the same name.