Changes in balance coordination and transfer to an unlearned
balance task after slackline training: a self-organizing map
analysis
Ben Serrien1 · Erich Hohenauer1,2,3 · Ron Clijsen1,2,3 · Wolfgang Taube4 · Jean-Pierre Baeyens1,3,5 · Ursula Küng3
effect size was more than three times larger in the slackline. The SOM analysis, followed by a k-means clustering and marginal homogeneity test, showed that the balance coordi-nation pattern was significantly different between pre- and post-test for the slackline task only (χ2 = 82.247; p < 0.001). The shift in balance coordination on the slackline could be characterized by an increase in range of motion and a decrease in velocity and frequency in nearly all degrees of freedom simultaneously. The observation of low transfer of coordination strategies to the flamingo task adds further evi-dence for the task-specificity principle of balance training, meaning that slackline training alone will be insufficient to increase postural control in other challenging situations. Keywords Balance training · Coordination · Transfer · Slackline · Self-organizing map
Introduction
In children as well as in young and older adults, slackline training was shown to improve the ability to balance on the slackline (Granacher et al. 2010; Donath et al. 2013; Pfuster-schmied et al. 2013; Gabel et al. 2015; Donath et al. 2016). Based on these positive results and the relatively low costs and large variety of possible exercises, slackline-based train-ing is findtrain-ing its way into fitness and therapeutic setttrain-ings (Gabel et al. 2013). A slackline is basically a narrow nylon rope stretched between two anchor points upon which peo-ple try to maintain their balance on one or two feet or try to walk, turn, jump or perform other functional exercises. By adjusting the length and tension in the slackline, the exer-cises can be made easier or harder. Although positive results of slackline training have been described for improving pos-tural control on the slackline, a recent meta-analysis revealed Abstract How humans maintain balance and change
pos-tural control due to age, injury, immobility or training is one of the basic questions in motor control. One of the problems in understanding postural control is the large set of degrees of freedom in the human motor system. Therefore, a self-organizing map (SOM), a type of artificial neural network, was used in the present study to extract and visualize infor-mation about high-dimensional balance strategies before and after a 6-week slackline training intervention. Thirteen subjects performed a flamingo and slackline balance task before and after the training while full body kinematics were measured. Range of motion, velocity and frequency of the center of mass and joint angles from the pelvis, trunk and lower leg (45 variables) were calculated and subsequently analyzed with an SOM. Subjects increased their standing time significantly on the flamingo (average +2.93 s, Cohen’s
d = 1.04) and slackline (+9.55 s, d = 3.28) tasks, but the
* Ben Serrien [email protected]
1 Faculty of Physical Education and Physiotherapy, Vrije
Universiteit Brussel, Pleinlaan 2, 1050 Brussels, Belgium
2
Scuola Universitaria Professionale della Svizzera Italiana, Weststrasse 8, 7302 Landquart, Switzerland
3 THIM – University of Applied Sciences in Physiotherapy,
Weststrasse 8, 7302 Landquart, Switzerland
4
Department of Medicine, Movement and Sport Sciences, University of Fribourg, Boulevard de Pérolles 90, 1700 Fribourg, Switzerland
5 Department of Electronics and ICT, Universiteit Antwerpen,
Groenenborgerlaan 171, 2020 Antwerp, Belgium
http://doc.rero.ch
Published in "Experimental Brain Research 235 (11): 3427–3436, 2017"
which should be cited to refer to this work.
only moderate transfer effects toward other dynamic balance tasks and low transfer effects toward static balance tasks that were sometimes even in favor of the control group (Donath et al. 2017). Similar observations have been made for other types of balance training (Kümmel et al. 2016).
When people make their first attempts on a slackline, the standing leg and rope swing uncontrollably and assistance is almost always necessary (Keller et al. 2012). The slight instabilities that cause no problem in normal stance are amplified on the slackline, and in this way the person cre-ates a strong impulse on which his/her neuromuscular sys-tem must respond to stay on the slackline. In most subjects, control of the slackline and maintenance of upright posture on the slackline evolve rapidly. The underlying neuromus-cular learning mechanisms are, however, barely understood. From a computational point of view, it has been shown that an ‘optimal control model’ can improve postural control when the model knows the slackline mechanics and receives adequate neurobiological feedback (Paoletti and Mahadevan
2012). From measurements in humans, it is known that train-ing on the slackline leads to reduced soleus H-reflexes (Kel-ler et al. 2012). Keller and colleagues argued that reducing this spinal reflex mechanism can prevent the overshoot of joint repositioning and, thus, the buildup of uncontrollable joint oscillations. They speculated that supraspinal structures were responsible for inhibiting the spinal reflex contribu-tion by choosing an appropriate reflex setting when enter-ing the slackline. Hüfner et al. (2011) further showed that the structure of the hippocampus is different in experienced slackliners and dancers compared to recreational athletes. Magon et al. (2016) showed increased efficiency in the stri-atal network in a subgroup of elder subjects who responded well to a slackline training program. These observations hint toward an improved supraspinal control in experienced slackliners when controlling the several degrees of freedom while standing or moving on the slackline. So far, kinematics of postural reactions have most often been studied in stand-ardized balance tasks. Simplified models like the inverted pendulum were often applied (e.g., Paoletti and Mahadevan
2012). However, while these approaches constitute useful first approximations, they ignore the complex interactions between the large numbers of degrees of freedom of the human body. Every degree of freedom in its turn can be studied at multiple levels (joint angle, velocity, accelera-tion, frequency domain) and each level provides important information because the sensorimotor subsystems (proprio-ception, vestibular, visual) rely on these different types of kinematic information, although it is not exactly known how these inputs are weighted and integrated (Stepan and Kollar
2000; Peterka 2002; Stepan 2009).
Non-linear data reduction and pattern recognition tech-niques in the form of neural networks are becoming more and more common in gait analysis (Barton et al. 2006, 2007,
2012; Lamb et al. 2011; Bartlett et al. 2014) and sport sci-ence (Lamb et al. 2014; Serrien et al. 2016) and provide a means to examine a large number of degrees of freedom at multiple levels simultaneously. In balance tasks, neural networks have been used to quantify movement variability and discriminate coordination strategies of young and older subjects (van Diest et al. 2015) and to model muscle syner-gies from electromyography data (Milosevic et al. 2012). The aim of this research project was to analyze the effects of a slackline intervention on kinematic variables during a slackline balance task and to see if transfer to another pos-tural task, i.e., the flamingo balance task, occurred by using a special type of neural network, namely self-organizing maps (SOM, Kohonen 2001). This approach may provide new insights into the mechanisms behind the motor learn-ing process of complex balance tasks and their transfer to unlearned balance tasks.
Methodology
Subjects
Fifteen subjects volunteered to take part in this study. How-ever, one subject dropped out due to injury and another participant did not complete the training. The remaining 13 subjects (11 female, 2 male) had a mean (±SD) age, height and weight of 22.2 (1.9) years, 168.8 (5.1) cm and 61.6 (8.7) kg. All subjects reported at enrollment in the study that they were free of any injury or balance-distorting conditions. None of them has had more than 1 h of slacklining experi-ence prior to the experiment. All participants were informed about the procedure of the study and signed informed con-sent forms. The study protocol followed the Declaration of Helsinki and was approved by the ethics committee of Zürich, Switzerland (KEK-ZH-Nr. 2014-0107).
Training
All subjects participated in a 6-week training program with a total of nine 30-min sessions of supervised slack-line exercises. Slackslack-line training was performed under supervision of a staff member for safety and to make sure that subjects practiced throughout the 30 min. However, no further instructions were made than the goal will be to stand for a longer time on your preferred leg (defined by the first measurement) on the slackline. The middle of the 4 m slackline was marked and the tension was adjusted daily to 980 ± 10 N. Subjects started their first training session a few days (max. 9) after the pre-measurements and there was a gap of maximum 5 days between the last training session and post-measurements.
Tasks and measurements
Subjects had to perform two balance tasks: the slackline (SL) and flamingo (FL) balance task. In both tasks, subjects were instructed to maintain single-stance balance for 15 s. For the SL task, subjects were instructed to place their pre-ferred foot at the midpoint of the slackline (length = 4 m, width = 5 cm, tension = 980 ± 10 N). Subjects were allowed to hold the hand of an assistant to get on the slackline. When the subject released the hand, measurements were started until they reached 15 s or set their foot on the ground or placed the other foot on the slackline. Motions of the arms and non-standing leg were not restricted by specific instruc-tions. For the FL, the same protocol but without assistance was performed on a static balance bar (width = 4 cm). Both tasks were performed three times in series. FL as the com-paring standard balance task always had to be performed first to avoid bias on that standard task (otherwise, the FL might be experienced as too easy when descending from the SL). During both tasks, we recorded full body kinematics with a six-camera VICON system at 250 Hz. Retroreflective markers were placed bilateral at the anterior and posterior superior iliac spine, trochanter major, acromion, humeral epicondylus lateralis, ulnar styloid process, femoral epicon-dylus lateralis and medialis, tibial tuberosity, medial and lat-eral malleolus, back side of the calcaneus and dorsal head of metatarsal 2. Unilateral markers were placed at the seventh cervical and tenth thoracic vertebrae, manubrium sterni, pro-cessus xiphoideus and forehead. Two markers were placed on the slackline, 1 m before and 1 m after the midpoint. Data processing
Marker trajectories were reconstructed and labeled and gaps were filled in VICON Nexus software. The coordi-nates from all markers were imported into a custom-made script in Mathcad for calculation of several kinematic vari-ables. The definitions of these variables are displayed in Table 1. Joint and segment angles were calculated based
on local orthogonal coordinate systems and a Cardan rota-tion sequence based on the ISB guidelines (Wu et al. 2002,
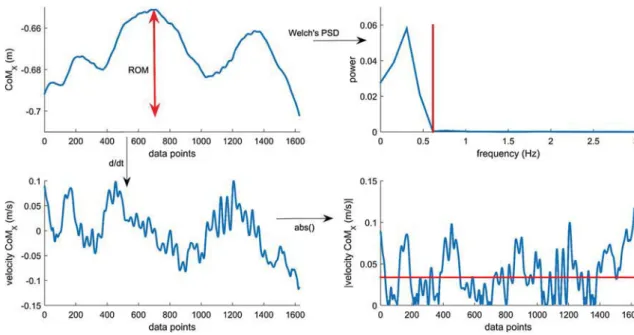
2005). The location of the center of mass was estimated using the parameters of de Leva (1996). The time series of these variables were exported into Matlab for extraction of discrete kinematic variables. The time series were too variable in shape and length both within and between sub-jects and tasks to be used directly within the SOM. From all kinematic variables displayed in Table 1, the total range of motion (ROM), median absolute velocity (VEL) and 95% of the frequency spectrum (FREQ, Welch’s power spectral den-sity) were calculated (see Fig. 1). The 95th percentile was chosen instead of the peak power because the latter was not always clearly defined (double peaks) and includes mostly the major component and not the small corrections made during the large motions. For the head variables, we addi-tionally calculated the acceleration values as the vestibular system is most sensitive to changes in velocity.
Self-organizing map analysis
This gave us a dataset of a total of 45 kinematic variables per trial and subject resulting in 156 trials in total (13 [subjects] × 2 [tasks] × 3 [trials per task] × 2 [measure-ment sessions] = 156 trials). The entire 156 × 45 dataset was used to train a neural network in recognizing the over-all strategies that were used by the subjects. The network takes all variables into account simultaneously to induce an overall pattern. Each row of the dataset is an input vec-tor v =(ROM1, … VEL1, … FREQ1, …) that was fed to the network. The neural network that we used in this study was an SOM, a class of vector learning algorithms with a high capacity for topological preservation of high-dimensional datasets and useful visualization techniques. More techni-cal information and mathematitechni-cal definitions can be found in Vesanto et al. (2000) and Kohonen (2001). Data were analyzed with the open-source SOM-Toolbox for Mat-lab (Vesanto et al. 2000) (see Supplemental file 1 for the options that we used for the SOM training parameters and
Table 1 Definition of
kinematic variables used in the SOM analysis
Variable Definition
CoM_xyz Center of mass in the global coordinate system (x: left/right, y: anterior/pos-terior, z: up/down)
rotP, rotT Rotation angles of the pelvis and trunk (in the transverse plane) latP, latT Lateral tilt angles of the pelvis and trunk (in the frontal plane) sagP, sagT Forward/backward tilt angles of pelvis and trunk (in the sagittal plane) hipfl, hipabad Hip flexion/extension and ab/adduction angles of the stance leg kneefl Knee flexion/extension angle of the stance leg
anklefl, ankleps Ankle dorsal/plantar flexion and pronation/supination angles of the stance leg head_xyz Acceleration of the head in the global coordinate system (x: left/right, y:
anterior/posterior, z: up/down)
a sensitivity analysis thereof). Basically, an SOM consists of input and output units that are all connected to each other. Each output unit (hexagons in Figs. 2, 3, 4, 5) is associated with a weight vector that has the same dimen-sion as the input vectors (45 dimendimen-sions in this study, i.e., number of variables). Each output unit thus represents a prototype motion pattern consisting of the several ROM, VEL and FREQ variables. The number of output units on the map is smaller than the number of input vectors (rows of the dataset), forcing the SOM algorithm to map simi-lar input vectors into simisimi-lar units. Through an iterative
training process and a neighborhood function, the weight vectors are updated to make the best possible representa-tion of the input vectors without confounding the topo-logical relations of the original data. The training process forces similar prototype motion patterns (and thus the measured trials represented by them) to be mapped close together on the SOM. Various visualization options allow to qualitatively interpret the data for meaningful patterns. Every (sub)figure in “Results” shows the same SOM with its 63 units. Hit histograms per experimental condition allow identifying overall regions of the map related to that
Fig. 1 Example of the calculation of kinematic parameters for the
CoMx: ROM (left upper panel), median absolute velocity (right lower
panel, VEL: red horizontal line) and the 95% of the frequency
spec-trum (right upper panel, FREQ: red vertical line). This figure gives an example of a trial with a total length of 6.528 s
Fig. 2 SOM visualizations. Left: result of the k-means cluster
algo-rithm showing the five different clusters of the SOM units. Middle and right: hit histograms for flamingo and slackline trials,
respec-tively (blue indicates trials from the pre-test; red indicates trials from the post-test). The size of the colored hexagons is proportional to the number of trials that are mapped on the specific units
condition (Fig. 2). These histograms represent the num-ber of input vectors (trials) mapped into each unit. Larger colored hexagons indicate units with more trials mapped into them. Inspection of the corresponding component planes (Figs. 3, 4, 5) allows to qualitatively interpret and
visualize these patterns in terms of the original variables. Component planes for each variable show the value of each dimension’s prototype motion pattern (Lamb 2012). Further statistical analysis based on this SOM is described below.
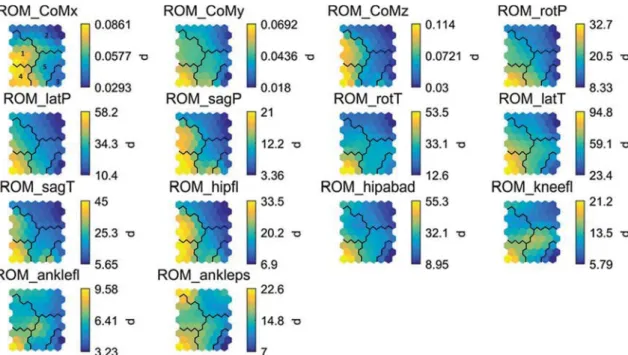
Fig. 3 SOM component planes for the ROM variables. The values of
the variables are given on a color scale in the original non-normal-ized units (CoM-variables: m, angle variables: °). See Table 1 for the
abbreviations. The black lines show the cluster borders as revealed by the k-means algorithm. Clusters 1 and 4 represent patterns with the highest ROM in nearly all degrees of freedom
Fig. 4 SOM component planes for the VEL variables (except for the
head, where we used accelerations). The values of the variables are given on a color scale in the original non-normalized units (CoM-variables: m/s, angle (CoM-variables: °/s, head (CoM-variables: m/s2). See Table 1
for the abbreviations. The black lines show the cluster borders as revealed by the k-means algorithm. Clusters 3 and 5 represent pat-terns with the highest VEL in nearly all degrees of freedom
Statistics
Postural control (standing time) was evaluated with a two-way repeated measures ANOVA with task and training as main factors. The level of significance was set at α = 0.05. In case of a significant interaction effect, Bonferroni-corrected post hoc paired samples t tests were calculated (αc = 0.025). Normality was assessed with the Shapiro–Wilk test and the presence of outliers was tested with box plots. To quantify the shift in coordination patterns on the SOM, we used a k-means cluster algorithm of the SOM units and a non-parametric marginal homogeneity test for paired nominal count data (Stuart–Maxwell test). The k-means algorithm was used to define clusters of SOM units that were qualita-tively different from each other, i.e., the clusters represent qualitatively different balance coordination patterns. SOM units within each cluster are more similar to each other than they are to SOM units of other clusters. The Davies–Bouldin index was used to define the appropriate number of clusters for the k-means algorithm (Davies and Bouldin 1979). This index shows for which number of clusters the ratio of aver-age within-to-between cluster distances is minimal, i.e., how many clusters are optimal for the dataset. The mapping of the trials into these clusters (count data) was then compared between pre- and post-test with a marginal homogeneity test for each task separately. A contingency table was made to show the change in distribution of trials over the clusters. A significant test result indicates a significant change in the
distribution of trials over the clusters for that task (i.e., off-diagonal counts in the contingency table), meaning that a motor learning effect took place.
Results
The postural control in FL (pre: 8.78 ± 2.38 s; post: 11.71 ± 3.37 s) and SL (pre: 4.58 ± 2.76 s; post: 14.13 ± 2.10 s) was normally distributed (p > 0.130 in all conditions) and no outliers were present. The ANOVA on postural control revealed an interaction effect between task and training (F = 56.14, p < 0.001, η2partial = 0.812, 1-β ~ 1). Follow-up post hoc tests revealed that postural control increased significantly (p < αc) in both tasks, but the effect
size (Cohen’s d) was more than three times larger on the slackline (FL: t = 3.896, p = 0.002, d = 1.04; SL: t = 12.26,
p < 0.001, d = 3.28).
Figure 2 shows the results of the k-means cluster algorithm on the SOM units and the hit histograms for the FL and SL tasks. The lowest Davies–Bouldin index was calculated for five clusters. The interpretation of the clusters in terms of the original variables may be done with the component planes which visualize each dimen-sion (variable) of the weight vectors across the map. All variables that formed the input vectors fed to the map are visualized in a component plane (Figs. 3, 4, 5, see “ Dis-cussion” for interpretation). Table 2 shows the counts of
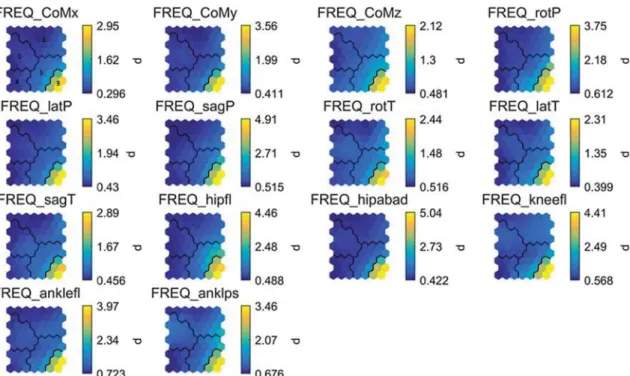
Fig. 5 SOM component planes for the FREQ variables (except for
the head, where we used accelerations). The values of the variables are given on a color scale in the original non-normalized units (Hz).
See Table 1 for the abbreviations. The black lines show the cluster borders as revealed by the k-means algorithm. Clusters 3 and 5 repre-sent patterns with the highest FREQ in nearly all degrees of freedom
pre–post combinations of trials for the FL and SL tasks. Each cell cij shows the number of trials that were mapped in cluster i at the pre-test and in cluster j at the post-test. Each subject contributed nine pre–post combinations to both contingency tables (see Supplementary file 3 for an example). Diagonal cells show the counts of no change between pre- and post-test, while the off-diagonal cells show the counts for changes between clusters. Marginal counts per cluster at pre/post-test are shown in the total row/column cells, respectively. The Stuart–Maxwell test for the SL task was significant (SM χ2-statistic = 82.247,
p < 0.001), but for the FL task it was not significant (SM χ2-statistic = 2.934, p = 0.431). This change in balance coordination for the SL task is observed to be a shift mainly from clusters 3 and 5 toward clusters 1, 2 and 4 as visualized on the hit histogram.
Discussion
This study described the results from a slackline-learning experiment. We observed significant increases in postural control (standing time) in both an SL standing task and in an unlearned FL standing task. However, there was a significant interaction effect between training and task, as shown by the more than three times larger effect size for the SL task. This observation of a low transfer effect to an unlearned task further contributes evidence to the task-specificity principle of balance training (Kümmel et al. 2016; Donath et al. 2017). The SOM analysis of the kinematic data during both tasks highlights that one rea-son for this low transfer of standing time might be that the coordination strategy, which was acquired for the SL task, cannot be transferred to the FL task. The newly acquired SL balance pattern is likely dependent on the expectation of an unstable moving surface, which would not be useful to apply in a task on stable surface.
Self-organizing map: cluster interpretation
The main findings from the SOM analysis are that subjects learned to increase their postural control on the slackline by adopting a strategy consisting of higher range of motion and lower velocity and frequency in most degrees of freedom. The k-means cluster analysis followed by the Stuart–Max-well test of marginal homogeneity confirmed that this shift between pre- and post-test was statistically significant. On their first attempts on the SL, participants showed motion patterns characterized by clusters 3 and 5. At the post-test, a significant shift toward the units of clusters 1, 2 and 4 occurred. By visual inspection of the units in the compo-nent planes corresponding to the same units in the k-means cluster and hit histograms, the shift between pre- and post-test may be interpreted qualitatively. The values of all units’ components are visualized on a color scale (Figs. 3, 4,
5). The relation between variables is easy to interpret on these maps. For instance, the ROM, VEL and FREQ vari-ables show gradients in mostly a left–right, upward and left-upward direction, respectively. This common gradient indicates a strong covariance between the variables within a level of analysis, but a smaller (negative) covariance between variables from different levels. If a component dif-fers greatly between clusters, but not within clusters, then the corresponding variable can be considered influential in the separation of those SOM clusters. For example, ROM of hip flexion has a strong loading on the difference between clusters 1 and 4 [high values; range (20°–33°)] and clusters 2, 3 and 5 [low values; range (7°–20°)]. Differences between clusters 1 and 4 are better distinguished by ROM of hip ab/ adduction, trunk rotation and lateral trunk tilt. Not one varia-ble at any level of analysis is avaria-ble to discriminate between all pairs of clusters, demonstrating the added value of an SOM analysis in high-dimensional complex motions. Because the Stuart–Maxwell test showed a change from clusters 3 and 5 toward clusters 1, 2 and 4, it is important to observe what variables are linked to their difference.
Table 2 Contingency tables
with the counts of pre–post combinations for the flamingo task (left) and slackline task (right)
Clusters Flamingo Clusters Slackline
Post-test Post-test
Pre test 1 2 3 4 5 Total Pre test 1 2 3 4 5 Total
1 6 15 0 3 0 24 1 6 3 0 3 0 12 2 18 33 0 3 12 66 2 9 3 0 3 0 15 3 0 0 0 0 0 0 3 9 9 0 6 3 27 4 9 6 0 3 0 18 4 0 3 0 0 0 3 5 3 3 0 3 0 9 5 9 36 0 12 3 60 Total 36 57 0 12 12 Total 33 54 0 24 6
http://doc.rero.ch
Overall, the units of cluster 3 are mainly characterized by very large FREQ values for all degrees of freedom. Both clusters 3 and 5 share balance strategies with relatively low ROM and high VEL values. The main difference between both clusters is that cluster 5 represents more moderate FREQ values. Looking at the hit histograms and Table 2, it is clear that clusters 3 and 5 are mainly representative for the SL trials at the pre-test (Fig. 2, right: blue hexagons). Clus-ters 1, 2 and 4 are mainly representative for all the other tri-als with no clear visual distinction between the pre, FL-post and SL-FL-post conditions on the hit histograms, meaning that the SOM was not able to discern qualitatively distinct patterns between these conditions. These clusters are charac-terized by low FREQ values for all degrees of freedom. Also for the VEL variables, these clusters show strong similarities of relatively low to moderate values (lowest VEL values are mainly in cluster 2). The only exception is ankle pro/supi-nation velocity which shows high values for these clusters. Cluster 2 shows moderate to low ROM values (again with an exception for ankle pro/supination), while clusters 1 and 4 characterize moderate to high ROM values.
This qualitative cluster analysis and visual inspection is a great advantage of the SOM methodology compared to looking at a large table with all the variables’ descriptive data and possible accompanying multivariate statistics (Sup-plemental file 2). Other SOM visualizations are possible too, allowing for identification of individual learning strategies (Supplemental file 3).
Motor learning effects
The slackline causes movements mostly in the mediolateral direction. However, not only the kinematics in this plane (lateral pelvis and trunk tilt, hip ab/adduction, ankle pro/ supination) were changed after training, but also the degrees of freedom in the anteroposterior plane (sagittal pelvis and trunk tilt, hip flex/extension, knee flex/extension, ankle flex/ extension) and transverse plane (pelvis and trunk rotation) were adapted in a similar manner.
The change toward higher ROM may be seen as the result of an exploratory strategy that participants applied during training. The role of exploratory body sway has been shown in other balance tasks before (Carpenter et al. 2010; Honeg-ger et al. 2013) and can also be interpreted as unfreezing of the degrees of freedom. In normal stance, body sway is limited to a small range by mainly reflex-based commands and this might be the standard response of the CNS dur-ing the first slackline attempts. We saw that the increase in ROM between pre- and post-test in all degrees of freedom occurred relatively simultaneously (as shown by the strong covariance between them). It might therefore be argued that the sway of the slackline is too fast and unpredictable to con-trol with mainly reflex pathways and the CNS might instead
choose to increase the ROM in all degrees of freedom simul-taneously; each joint motion compensating for other joint motions to keep the CoM within a stable region.
The adaptations in the FREQ domain are opposed to those in the ROM domain, indicating that subjects made less corrections to the ongoing movements. This observation also fits very well with the assumption that subjects changed their strategy from more reflex-guided to a more centrally con-trolled one (Hüfner et al. 2011; Keller et al. 2012). As a con-sequence of the larger ROM and lower FREQ, the motion is slower (decrease in VEL) and over longer and smoother trajectories. This allows not only more time to react and plan ahead, it also reduces the kinetic energy (~VEL2,
espe-cially in the trunk rotations) that needs to be counteracted when they reach the outer range of stability. An exception to this overall decrease in VEL is seen in hip ab/adduction and ankle pro/supination. These two component planes are slightly different from the overall pattern. This can mean that these degrees of freedom (combining an ankle–hip strategy in the mediolateral direction) are better able to maintain the balance under the constraints of the new overall balance coordination.
Transfer to an unlearned balance task
A second important conclusion concerns the weak trans-fer of motor coordination patterns from the SL to the FL, indicating that the strategy that is being learned is strongly dependent on the task at hand. Although the standing time on the FL increased significantly, the effect size was three times lower than on the SL. In addition, the Stuart–Maxwell test revealed no significant difference in the distribution over the clusters between pre- and post-test, indicating that no change occurred in the overall balance coordination strategy on the FL task. If the learned response on the SL would have been transferred to the FL task, the SOM and k-means clus-ter algorithm should have been able to discern this by map-ping the FL-post-trials into clusters of units with even higher ROM, lower VEL and FREQ than the ones from clusters 1, 2 and 4. Giboin et al. (2015) hypothesized that depending on the type of task, different semi-autonomous subsystems of the sensorimotor control are more or less recruited and that the control of these systems by supraspinal structures may be different. Training a specific balance task would thus induce adaptations only in the subsystems required for that task and in the control systems responsible for them (Giboin et al. 2015). In the present study, subjects may have a different neural (reflex) setting when entering the slackline (Keller et al. 2012) compared to a task on a stable surface. This weak transfer implies that slackline training should not be used as the single type of balance training for subjects that wish to improve postural control in more general terms. Also in elder subjects, slackline training showed only weak
transfer effects to other tasks (Donath et al. 2016). A variety of challenging balance situations should be applied during training as it seems that the neural response is highly specific to the task at hand and the external stimulus/perturbation exerted on the movement system (Giboin et al. 2015). Strengths and limitations
The major strength of this study, compared to classical sta-tistical methods, is the qualitative analysis with a self-organ-izing map that allowed examining a large number of degrees of freedom simultaneously at multiple levels of analysis in two balance tasks. This would cause a great multiple-testing problem with typical hypothesis testing techniques. In a gen-eral sense, the SOM-based marginal homogeneity test may be considered analogous to a qualitative non-linear version of a multivariate ANOVA with the visual inspection of the component planes’ relation to the clusters as the post hoc tests (univariate ANOVAs or discriminant analyses), thus combining quantitative and qualitative methods. Limitations to the present study are the low sample size, gender bias, lack of a control group and only two measurement sessions. Intermediate measurements after 2 and 4 weeks would have enabled us to track the changes after short- and middle-term learning periods. Also a follow-up measurement a number of weeks after the intervention would be necessary to establish the permanency of the newly acquired balance pattern. A limitation with respect to the included variables is the lack of separate data for the arm motions and non-standing leg. These data were incorporated into the center-of-mass loca-tion, but may also provide important information as indi-vidual components. A final limitation is a possible learn-ing effect on the flamlearn-ingo task on the post-test, which may explain the significant increase thereof. Future studies may include a familiarization of this task before the pre-test to control for this.
Conclusions
After a 6-week slackline training program, subjects showed increased postural control in both a slackline and flamingo balance task. The transfer effect to the unlearned flamingo task was, however, three times smaller than the learning effect on the slackline task. A self-organizing map was used to assess changes in the coordination of balance and showed significant pre–post differences for the slackline task (char-acterized by higher range of motion and lower velocities and frequencies in nearly all degrees of freedom). In contrast, the SOM showed no pre–post differences in balance coor-dination for the flamingo task. This observation provides further evidence to the task-specificity principle of balance training and extends previous knowledge by showing that
the acquired motor coordination patterns are task specific. Despite the large number of degrees of freedom, the usage of a self-organizing map allowed to differentiate different motor coordination patters and shifts between patterns (clus-ters) from pre- to post-measurement.
Acknowledgements We like to thank Medi-Lines for providing the
Slackbase free of charge to conduct the experiments and the training, and Thomas Konzett for assisting at the measurements.
Compliance with ethical standards
Conflict of interest All authors declare that they have no conflict of
interest that may have biased the findings in this article.
References
Bartlett RM, Lamb PF, O’Donovan D, Kennedy G (2014) Use of self-organizing maps for exploring coordination variability in the transition between walking and running. Int J Comp Psychol 27:123–137. doi:10.5811/westjem.2011.5.6700
Barton G, Lees A, Lisboa P, Attfield S (2006) Visualisation of gait data with Kohonen self-organising neural maps. Gait Posture 24:46–53. doi:10.1016/j.gaitpost.2005.07.005
Barton G, Lisboa P, Lees A, Attfield S (2007) Gait quality assess-ment using self-organising artificial neural networks. Gait Posture 25:374–379. doi:10.1016/j.gaitpost.2006.05.003
Barton GJ, Hawken MB, Scott MA, Schwartz MH (2012) Movement deviation profile: a measure of distance from normality using a self-organizing neural network. Hum Mov Sci 31:284–294. doi:10.1016/j.humov.2010.06.003
Carpenter MG, Murnaghan CD, Inglis JT (2010) Shifting the balance: evidence of an exploratory role for postural sway. Neuroscience 171:196–204. doi:10.1016/j.neuroscience.2010.08.030
Davies DL, Bouldin DW (1979) A cluster separation measure. IEEE Trans Pattern Anal Mach Intell 1:224–227. doi:10.1109/ TPAMI.1979.4766909
de Leva P (1996) Adjustments to Zatiorsky–Seluyanov’s segment iner-tia parameters. J Biomech 29:1223–1230
Donath L, Roth R, Rueegge A et al (2013) Effects of slackline training on balance, jump performance & muscle activity in young children. Int J Sports Med 34:1093–1098. doi:10.105 5/s-0033-1337949
Donath L, Roth R, Zahner L, Faude O (2016) Slackline training and neuromuscular performance in seniors: a randomized controlled trial. Scand J Med Sci Sport 26:275–283. doi:10.1111/sms.12423
Donath L, Roth R, Zahner L, Faude O (2017) Slackline training (bal-ancing over narrow nylon ribbons) and balance performance: a meta-analytical review. Sport Med 47:1075–1086. doi:10.1007/ s40279-016-0631-9
Gabel CP, Coast S, Beach C (2013) Slacklining for lower extrem-ity rehabilitation and injury prevention. Int J Athl Ther Train 18:14–19
Gabel CP, Osborne J, Burkett B (2015) The influence of “Slacklining” on quadriceps rehabilitation, activation and intensity. J Sci Med Sport 18:62–66. doi:10.1016/j.jsams.2013.11.007
Giboin LS, Gruber M, Kramer A (2015) Task-specificity of bal-ance training. Hum Mov Sci 44:22–31. doi:10.1016/j. humov.2015.08.012
Granacher U, Iten N, Roth R, Gollhofer A (2010) Slackline training for balance and strength promotion. Int J Sports Med 31:717–723. doi :10.1055/s-0030-1261936
Honegger F, Tielkens RJM, Allum JHJ (2013) Movement strategies and sensory reweighting in tandem stance: differences between trained tightrope walkers and untrained subjects. Neuroscience 254:285–300. doi:10.1016/j.neuroscience.2013.09.041
Hüfner K, Binetti C, Hamilton DA et al (2011) Structural and func-tional plasticity of the hippocampal formation in professional dancers and slackliners. Hippocampus 21:855–865. doi:10.1002/ hipo.20801
Keller M, Pfusterschmied J, Buchecker M et al (2012) Improved postural control after slackline training is accompanied by reduced H-reflexes. Scand J Med Sci Sports 22:471–477. doi:10.1111/j.1600-0838.2010.01268.x
Kohonen T (2001) Self-organizing maps, 3rd edn. Springer, Berlin Kümmel J, Kramer A, Giboin L-S, Gruber M (2016) Specificity of
balance training in healthy individuals: a systematic review and meta-analysis. Sport Med 46:1261–1271. doi:10.1007/ s40279-016-0515-z
Lamb PF (2012) Understanding the relationship among launch vari-ables in the golf drive using neural network visualisations. Sport Biomech 11:249–261. doi:10.1080/14763141.2011.638389
Lamb PF, Mündermann A, Bartlett RM, Robins A (2011) Visualiz-ing changes in lower body coordination with different types of foot orthoses using self-organizing maps (SOM). Gait Posture 34:485–489. doi:10.1016/j.gaitpost.2011.06.024
Lamb PF, Bartlett RM, Lindinger S, Kennedy G (2014) Multi-dimensional coordination in cross-country skiing analyzed using self-organizing maps. Hum Mov Sci 33:54–69. doi:10.1016/j. humov.2013.08.005
Magon S, Donath L, Gaetano L et al (2016) Striatal functional con-nectivity changes following specific balance training in elderly people: MRI results of a randomized controlled pilot study. Gait Posture 49:334–339. doi:10.1016/j.gaitpost.2016.07.016
Milosevic M, McConville KMV, Sejdic E et al (2012) Visualization of trunk muscle synergies during sitting perturbations using
Self-Organizing Maps (SOM). IEEE Trans Biomed Eng 59:2516– 2523. doi:10.1109/TBME.2012.2205577
Paoletti P, Mahadevan L (2012) Balancing on tightropes and slacklines. J R Soc Interface 9:2097–2108. doi:10.1098/rsif.2012.0077
Peterka RJ (2002) Sensorimotor integration in human postural control. J Neurophysiol 88:1097–1118
Pfusterschmied J, Buchecker M, Keller M et al (2013) Supervised slackline training improves postural stability. Eur J Sport Sci 13:49–57
Serrien B, Clijsen R, Anders S et al (2016) Intra-seasonal variability of ball speed and coordination of two team-handball throwing techniques in elite male adolescent players. Int J Comput Sci Sport 15:1–29. doi:10.1515/ijcss-2016-0001
Stepan G (2009) Delay effects in the human sensory system during balancing. Philos Trans R Soc A 367:1195–1212. doi:10.1098/ rsta.2008.0278
Stepan G, Kollar L (2000) Balancing with reflex delay. Math Comput Model 31:199–205. doi:10.1016/S0895-7177(00)00039-X
van Diest M, Stegenga J, Wörtche HJ et al (2015) Quantifying pos-tural control during exergaming using multivariate whole-body movement data: a self-organizing maps approach. PLoS ONE. doi:10.1371/journal.pone.0134350
Vesanto J, Himberg J, Alhoniemi E, Parhankangas J (2000) SOM tool-box for Matlab 5
Wu G, Siegler S, Allard P et al (2002) ISB recommendation on defini-tions of joint coordinate system of various joints for the reporting of human joint motion—part I: ankle, hip and spine. J Biomech 35:543–548. doi:10.1006/rtph.2002.1549
Wu G, van der Helm FCT, Veeger HEJDJ et al (2005) ISB recom-mendation on definitions of joint coordinate systems of various joints for the reporting of human joint motion—Part II: shoulder, elbow, wrist and hand. J Biomech 38:981–992. doi:10.1016/j. jbiomech.2004.05.042