Publisher’s version / Version de l'éditeur:
Vous avez des questions? Nous pouvons vous aider. Pour communiquer directement avec un auteur, consultez la première page de la revue dans laquelle son article a été publié afin de trouver ses coordonnées. Si vous n’arrivez pas à les repérer, communiquez avec nous à PublicationsArchive-ArchivesPublications@nrc-cnrc.gc.ca.
Questions? Contact the NRC Publications Archive team at
PublicationsArchive-ArchivesPublications@nrc-cnrc.gc.ca. If you wish to email the authors directly, please see the first page of the publication for their contact information.
https://publications-cnrc.canada.ca/fra/droits
L’accès à ce site Web et l’utilisation de son contenu sont assujettis aux conditions présentées dans le site LISEZ CES CONDITIONS ATTENTIVEMENT AVANT D’UTILISER CE SITE WEB.
Paper (National Research Council of Canada. Division of Building Research); no. DBR-P-947, 1980-10
READ THESE TERMS AND CONDITIONS CAREFULLY BEFORE USING THIS WEBSITE. https://nrc-publications.canada.ca/eng/copyright
NRC Publications Archive Record / Notice des Archives des publications du CNRC : https://nrc-publications.canada.ca/eng/view/object/?id=ebbc6f0f-4ace-4d14-9252-1ae2961bb106 https://publications-cnrc.canada.ca/fra/voir/objet/?id=ebbc6f0f-4ace-4d14-9252-1ae2961bb106
NRC Publications Archive
Archives des publications du CNRC
This publication could be one of several versions: author’s original, accepted manuscript or the publisher’s version. / La version de cette publication peut être l’une des suivantes : la version prépublication de l’auteur, la version acceptée du manuscrit ou la version de l’éditeur.
Access and use of this website and the material on it are subject to the Terms and Conditions set forth at
NRC Ice Property Measurements During the Canmar Kogoriak Trials in the Beaufort Sea Winter 1979-80
N A T I O N A L RLSEARCH COUNCIL O F CANADA
DlVlSION O F BUILDING RESEARCH
N R C ICE P R O P E R T Y MEASUREMENTS
DURING
T H ECANMAR KIGORIAK TRIALS IN T H E B E A U F O R T S E A
WINTER 1979-80 R. M. W. Frederking and G. W . T i m c o DBR Paper No. 947 of the Division of Building R e s e a r c h OTTAWA, October 1980
NKC I C E P R O P E R T Y MEASUREMENTS DURING T H E CANMAR KIGORIAK T R l A L S IN T H E B E A U F O R T S E A
-
WINTER 1979-80 A B S T R A C T T h i s p a p e r s e t s f o r t h the r e s u l t s of i c e p r o p e r t i e s m e a s u r e m e n t s c a r r i e d out d u r i n g t h e i c e b r e a k i n g t r i a l s of t h e "CANMAR KIGORIAK" in t h e w i n t e r of 1979-80. T h e m e a s u r e m e n t s included c r y s t a l - l o g r a p h i c a n a l y s i s to e s t a b l i s h i c e type and s t r u c - t u r e , t e m p e r a t u r e and s a l i n i t y p r o f i l i n g of i c e c o r e s , and u n i a x i a l c o m p r e s s i o n and " B r a z i l " s t r e n g t h t e s t s . T h e s e m e a s u r e m e n t s w e r e a l l p e r f o r m e d o n b o a r d s h i p a t the t i m e of the t r i a l s . T h e i c e a n a l y z e d i n c l u d e d s a m p l e s f r o m both f i r s t - y e a r i c e c o v e r s and m u l t i - y e a r p r e s s u r e r i d g e s . S t r e n g t h r e s u l t s w e r e found t o g e n e r a l l y a g r e e w i t h v a l u e s i n the l i t e r a t u r e . MESURES SUR L E S P R O P R I ~ T ~ S D E L A G L A C E E F F E C T U ~ E S AUCOURS DES ESSAIS DU CANMAR KIGORIAK DANS LA MER D E BEAUFORT HIVER 1979-80 Nous a v o n s s o u m i s d e s e c h a n t i l l o n s de g l a c e 'a d e s e s s a i s e n r u p t u r e 'a b o r d d u l ' C A N M A R KIGORIAK" 5 l ' h i v e r 1979-80, a f i n d e m e s u r e r l e s p r o p r i k t i l s d e l a g l a c e . Ce d o c u m e n t p r k s e n t e l e s r k s u l t a t s d e c e s m e s u r e s q u i c o m p o r t a i e n t , e n t r e a u t r e s , une a n a l y s e c r y s t a l l o g r a p h i q u e p e r m e t t a n t d ' k t a b l i r l e type e t l a s t r u c t u r e d e l a g l a c e , l a t e m p k r a t u r e e t l e p r o f i l d e salinitil d e s e c h a n t i l l o n s c o n s i d k r e s a i n s i q u e d e s e s s a i s e n c o m p r e s s i o n u n i a x i a l e e t d e s e s s a i s d e r k s i s t a n c e " B r a z i l " . C e s m e s u r e s ont t o u t e s ilte p r i s e s 'a b o r d , a u m o m e n t d e s e s s a i s . L ' a n a l y s e p o r t a i t s u r d e s k c h a n t i l l o n s d e g l a c e e x - t r a i t s d e c o u v e r t u r e s de g l a c e v i e i l l e s d ' u n a n e t d e c r 6 t e s d e p o u s s k e v i e i l l e s d e p l u s i e u r s a n n k e s . D e f a e o n g k n k r a l e , l e s r k s u l t a t s d e s e s s a i s d e r e s i s - t a n c e c o n c o r d a i e n t a v e c l e s v a l e u r s q u e l ' o n t r o u v e & 1 1 i n t 6 r i e u r de l a d o c u m e n t a t i o n 6 c r i t e .
NRC ICE PROPERTY MEASUREMENTS DURING THE CANMAR KIGORIAK TRIALS IN THE BEAUFORT SEA
WINTER 1979-80 by
R.M.W. Frederking* and G.W. Timco**
FOREWORD
In the spring of 1979 the National Research Council of Canada was contacted by Canmar concerning measurements of ice properties during the ice breaking trials of the "CANMAR KIGORIAK" which had been planned for the winter of 1979-80. As a result of these discussions NRC was invited to participate in the ice measurements part of the trials program. This report sets forth the results of measurements made on ice cores collected in October 1979 and in January and February 1980.
The actual measurements included crystallographic analysis to establish ice type and structure, temperature and salinity profiling of ice cores, and uniaxial compression and "Brazil" strength tests. Most of this work was performed on board ship during the January 1980 trials. Data reduction was done later.
*
Division of Building Research, National Research Council of Canada,Ottawa, Ontario KIA OR6
** Division of Mechanical Engineering, National Research Council of Canada, Ottawa, Ontario K1A OR6
INTRODUCTION
Complete knowledge o f i c e p r o p e r t i e s i s i m p o r t a n t i n a s s e s s i n g t h e i c e b r e a k i n g performance o f v e s s e l s . The o b j e c t i v e o f t h e NRC program was t o supplement t h e i c e d a t a o b t a i n e d by Canmar and t h e r e b y p r o v i d e a more complete b a s i s f o r a s s e s s i n g t h e i c e b r e a k i n g performance o f t h e KIGORIAK. Canmar c o l l e c t e d and s t o r e d m u l t i - y e a r i c e c o r e s from t h e October 1979 probe i n t o t h e p o l a r pack and f i r s t - y e a r c o r e s from t h e e a r l y p a r t o f t h e J a n u a r y 1980 t r i a l s . These c o r e s , t o g e t h e r w i t h some t a k e n by t h e a u t h o r s d u r i n g t h e l a t t e r p a r t o f t h e J a n u a r y t r i a l s p e r i o d , were a n a l y s e d by them on board t h e v e s s e l .
The program c a r r i e d o u t by NRC i n c l u d e d c r y s t a l l o g r a p h i c a n a l y s i s t o d e t e r m i n e i c e s t r u c t u r e , t y p e , g r a i n s i z e and o r i e n t a t i o n ; i c e
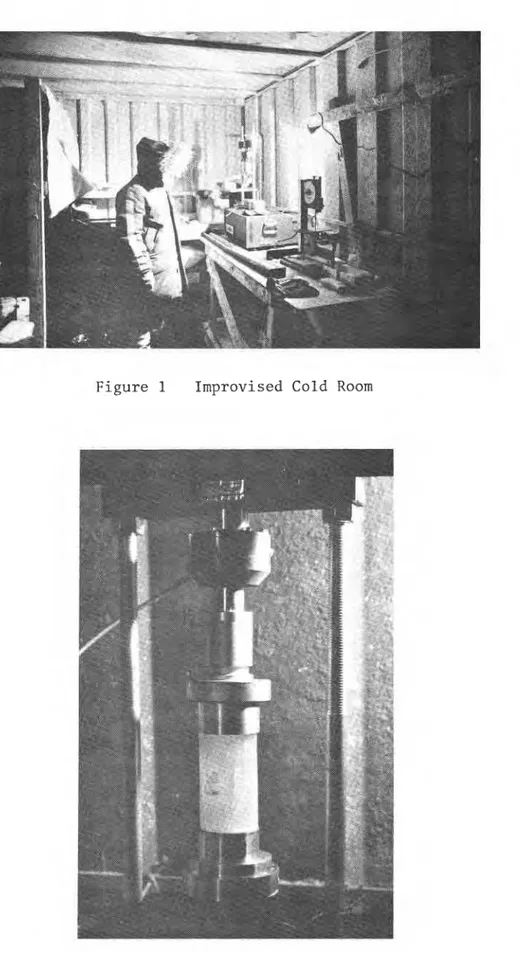
t e m p e r a t u r e and s a l i n i t y f o r b r i n e volume d e t e r m i n a t i o n s ; and compressive and " B r a z i l " ( t e n s i l e ) s t r e n g t h t e s t s . T h i s work was done i n a c o l d room improvised i n a s t a n d a r d u n i n s u l a t e d 2 0 - f t s h i p p i n g c o n t a i n e r l o c a t e d on t h e a f t e r deck o f t h e v e s s e l . The t e s t temperatures were s l i g h t l y warmer
(< ~ O C ) , t h a n t h e o u t s i d e ambient t e m p e r a t u r e . While t h e a u t h o r s were on board t h e v e s s e l , 12 t o 21 J a n u a r y 1980, t h e r e were about 6 h o u r s of day- l i g h t p e r day. I n i t i a l l y t h e weather was c o l d and calm, -30" t o -40°C w i t h winds l e s s t h a n 5 k n o t s , b u t i t g r a d u a l l y changed t o about - 2 5 ' ~ w i t h winds o f up t o 20 k n o t s .
The J a n u a r y 1980 t r i a l s were c a r r i e d o u t i n t h e l a n d - f a s t i c e of t h e s o u t h e r n Beaufort S e a , o f f t h e Tuktoyaktuk P e n i n s u l a , between Summers Harbour and McKinley Bay. During t h e e a r l y p a r t o f t h e w i n t e r (approxi- mately t h e end o f December) t h e i c e i n t h i s a r e a was f a i r l y dynamic, s u b j e c t t o f r e q u e n t movements.
T h i s r e p o r t mainly c a t a l o g u e s t h e r e s u l t s . The d a t a a r e p r e s e n t e d i n c h r o n o l o g i c a l o r d e r by l o c a t i o n f o r e a s y comparison w i t h performance measurements o f t h e v e s s e l . No a t t e m p t h a s been made t o a s s e s s i c e p r o p e r t i e s i n r e l a t i o n t o v e s s e l performance; some g e n e r a l o b s e r v a t i o n s have been made, however, on a p p a r e n t t r e n d s i n t h e r e s u l t s .
EXPERIMENTAL PROCEDURES Sample A c q u i s i t i o n
The i c e samples s t u d i e d i n t h i s i n v e s t i g a t i o n were o b t a i n e d from c o r e s t a k e n from t h e i c e b e f o r e , d u r i n g , and a f t e r t h e a u t h o r s were on b o a r d , i n t h e p e r i o d from October 1979 t o February 1980. The samples t a k e n b e f o r e t h e a u t h o r s boarded t h e s h i p were o b t a i n e d by E . Banke o f Canmar a t s e v e r a l l o c a t i o n s i n t h e Beaufort Sea. These c o r e s were i d e n t i f i e d , l a b e l l e d and packaged i n 3 - i n . i n s i d e d i a m e t e r ABS t u b e s o r p l a s t i c bags and s t o r e d i n a c o n v e n t i o n a l f r e e z e r (T
-
-15°C) o r i n a l a r g e , u n i n s u l a t e d m e t a l c o n t a i n e r n e a r t h e s t e r n o f t h e v e s s e l . During t h e time t h e a u t h o r s were a b o a r d , c o r e s were t a k e n a t s e v e r a l l o c a t i o n s a l o n g s i d e t h e s h i p w h i l e i t was s t o p p e d . Some o f t h e s e c o r e s were immediately c u t i n t o d i s c r e t e segments, l a b e l l e d and bagged f o r l a t e r s a l i n i t y measurements. O t h e r s were i d e n t i f i e d , p l a c e d i n ABS t u b e s and s t o r e d a t t e m p e r a t u r e s below - 2 5 " ~ u n t i l t h e y could be s t u d i e d . For somec o r e s , temperature p r o f i l e s were t a k e n along t h e l e n g t h o f t h e c o r e a s q u i c k l y a s p o s s i b l e a f t e r removal from t h e i c e s h e e t . I n a d d i t i o n , FENCO jack t e s t s were performed i n s e v e r a l of t h e r e s u l t a n t b o r e h o l e s . In a l l c a s e s , t h e c o r e s broke i n t o segments d u r i n g t h e c o r i n g procedure. Typi- c a l l y a 70 cm long c o r e might be comprised of t h r e e s e p a r a t e s e c t i o n s , b u t i n most c a s e s t h e s e could be pieced t o g e t h e r t o form a f u l l c o r e . The samples taken a f t e r t h e a u t h o r s had l e f t t h e s h i p were cored by E . Banke and s e n t t o one of t h e a u t h o r s f o r a n a l y s i s when he was a t P u l l e n I s l a n d l a t e r .
I n t h i s p r e s e n t study each c o r e was given a l e t t e r d e s i g n a t i o n i n t h e o r d e r i n which it was analysed. Thus, t h r e e c o r e s from t h e same a r e a would n o t n e c e s s a r i l y be l e t t e r e d c o n s e c u t i v e l y . In a l l , 24 c o r e s were s t u d i e d (Cores A t o X ) . I n i t i a l Analysis of Cores I n i t i a l a n a l y s i s involved p l a c i n g each c o r e i n a c o r e h o l d e r , p i e c i n g it t o g e t h e r , measuring i t s l e n g t h and n o t i n g t h e p o s i t i o n o f c o r e b r e a k s . A v i s u a l d e s c r i p t i o n of t h e c o r e was made i n c l u d i n g t h e i c e c o l o u r , a i r bubble c o n t e n t , b r i n e d r a i n a g e channels and sediment bands. Following t h i s , t h e t y p e s o f t e s t s t o be performed on t h e c o r e were
s p e c i f i e d . The c o r e s were marked and c u t i n t o t h e a p p r o p r i a t e s i z e d p i e c e s u s i n g a small band saw loaned by J . Spedding of Imperial O i l Co. The c o r e p i e c e s were i d e n t i f i e d and l a b e l l e d and, depending on t h e t e s t t y p e , were e i t h e r s t o r e d a t temperatures below - 2 . 5 " ~ o r placed i n p l a s t i c c o n t a i n e r s t o melt f o r s a l i n i t y measurements which were performed u s i n g a c o n d u c t i v i t y c e l l (Yellow Springs Co., Model 33) o r , f o r small samples, a r e f r a c t o m e t e r (Endeco, Type 102).
Thin S e c t i o n i n g Technique f o r Determination of I c e S t r u c t u r e
Thin s e c t i o n s were made t o determine t h e g e n e r a l s i z e and o r i e n t a - t i o n o f t h e i n d i v i d u a l c r y s t a l g r a i n s . This work was done i n t h e improvised c o l d room on t h e Kigoriak. The following procedure was used: The sample was o r i e n t e d and trimmed on t h e band saw t o produce a f l a t f a c e . T h i s f a c e was then sanded t o a smooth f i n i s h and placed on a g l a s s s l i d e which was warmed with a hot p l a t e . The r e s u l t i n g ( s l i g h t ) m e l t i n g o f t h e i c e a t t h e i n t e r f a c e and subsequent r e f r e e z i n g of t h e water produced a c l e a n bond o f i c e t o t h e g l a s s s l i d e . Using t h e band saw and an a n g l e - i r o n guide, t h e i c e was trimmed t o a t h i c k n e s s o f -2 t o 3 mm. Following t h i s , t h e i c e was f i l e d and/or sanded t o f u r t h e r reduce t h e t h i c k n e s s . A f i n a l g e n t l e warming with t h e h o t p l a t e produced a f l a t and o p t i c a l l y t r a n s p a r e n t s u r f a c e . F i n a l t h i c k n e s s of t h e t h i n s e c t i o n s was -1 t o 1 . 5 mm. The
samples were observed and photographed between c r o s s e d p o l a r o i d s on a p o r t a b l e f i e l d p o l a r i s c o p e .
S t r e n g t h Measurements
These measurements were a l s o done i n t h e improvised c o l d room (Figure 1 ) . A S o i l t e s t CT405 5000 kg c a p a c i t y p r e s s (Figure 2) was used t o perform compression and B r a z i l t e s t s on a number of c o r e s . Although t h i s p r e s s i s capable of r a t e s from 3 x mm/s t o 5 - m m / s , f o r
these tests only a constant rate of 3 x mm/s was used. The load was
measured using a 5000 kgm capacity Interface load cell that was mounted at the top of the press and connected to a Sensotec bridge amplifier and HP 7155A recorder. The amplifier and recorder were housed in a wooden box that was heated with a 100-watt light bulb. This provided a good working area since there was no wind and the ambient air temperature was always cold (-25'~). When the ship was in motion through an ice field, however, erratic movements of the ship caused both the equipment and personnel to be bounced around because the room was located directly above the main shaft of the propeller. This caused some hardship and necessitated securing the equipment.
Before performing a compression test, the length and diameter of the sample were measured with calipers and recorded. A typical sample length was 12 cm for the 7.5 cm diameter cores. Other than brushing the end surfaces clean no other preparation was performed on the band
saw cut ends. "Maraset" compliant platens were used to minimize the effect of irregularities and to reduce the radial forces at the end of the sample. Samples were loaded monotonically up to the yield point and then unloaded. Continuous records of load vs time were kept. For those samples that failed in a ductile fashion, the dimensions were remeasured after the experimental run. The compressive strength was calculated using the following equation:
where P is the peak load and d is the initial diameter of the specimen. No adjustment was made for the sample length-diameter geometry ratio. In all cases the samples were bagged and labelled for salinity measurements after the test.
In performing the Brazil strength tests, the core was cut in sections -3 cm long and the dimensions were measured with calipers and, recorded. Load was applied perpendicular to the axis of the cylinder. Brazil strength (aB) was calculated using:
where K is the concentration factor (K = 6 in this case), P is the
applied load, Q, is the length of the sample and d is the sample diameter.
After each strength test, the samples were bagged, identqfied and melted I,
for salinity determination. I,
RESULTS
'\
1,General Comments
The results of the tests were grouped by location and were put in chronological order according to the date on which the cores were taken. The results comprise an identifying date and location for the core, its history, a general description of it and, where available, photographs of
thin sections, salinity and temperature profiles, and compressive strength and Brazil strength profiles.
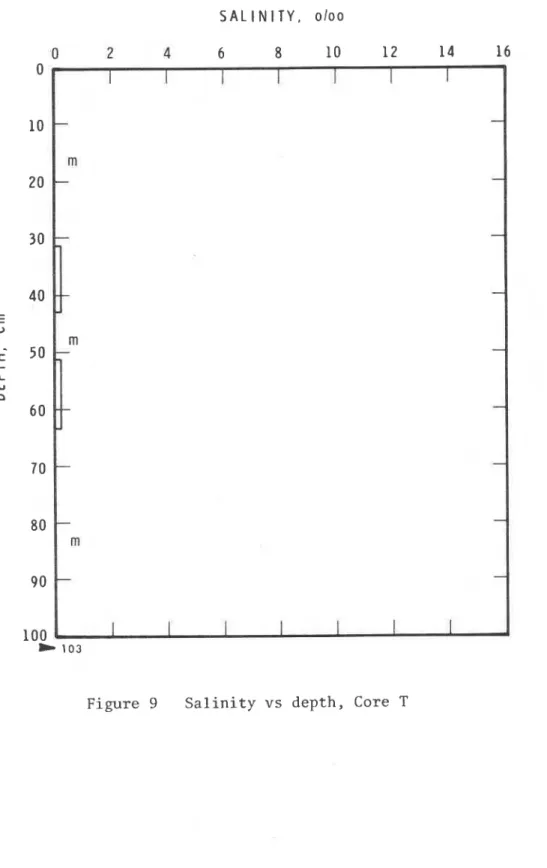
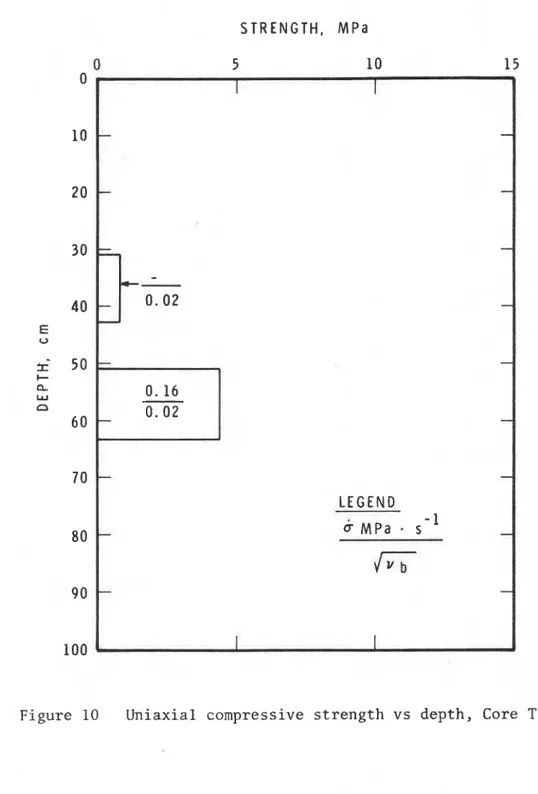
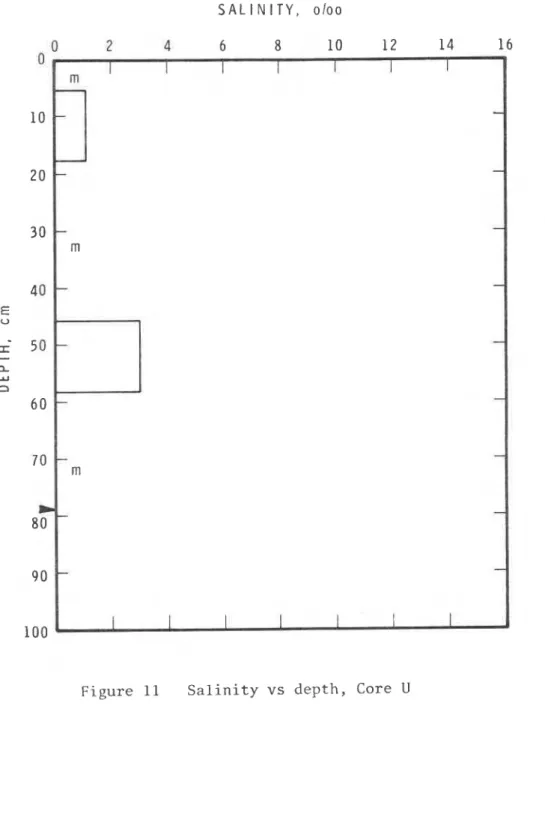
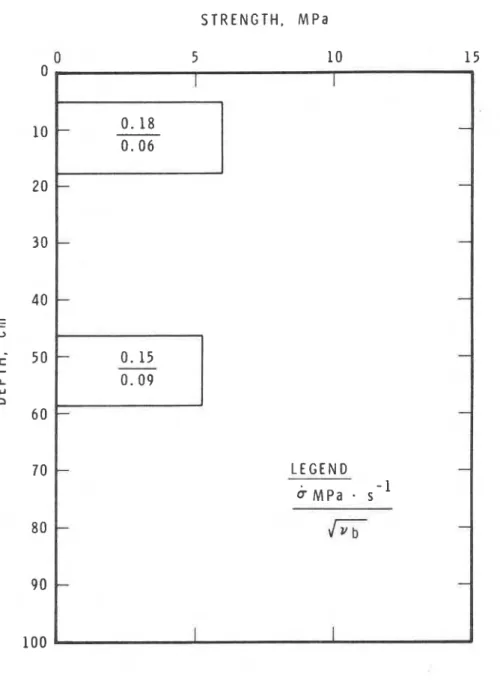
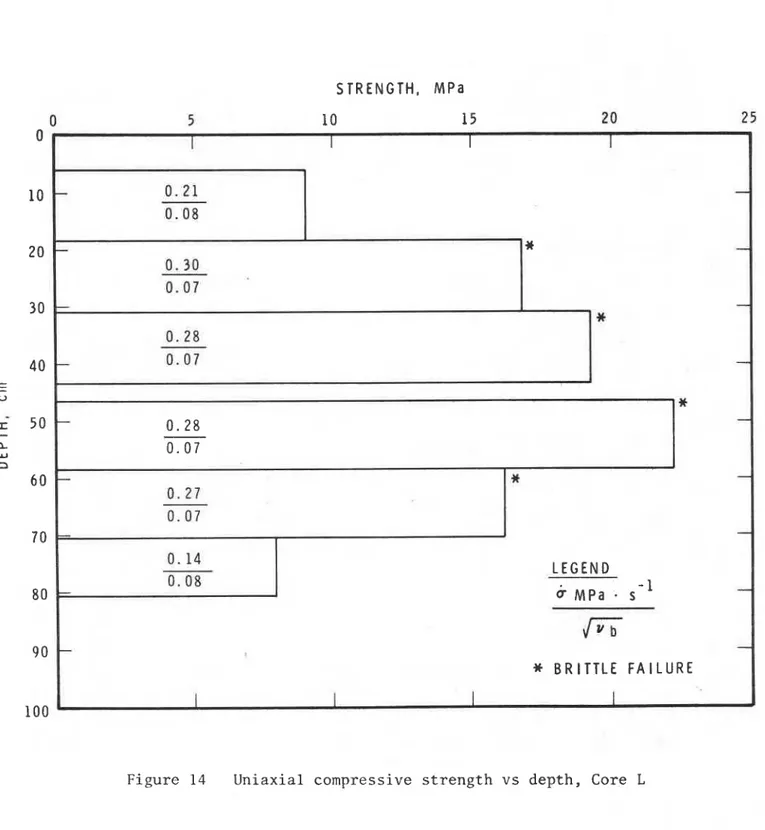
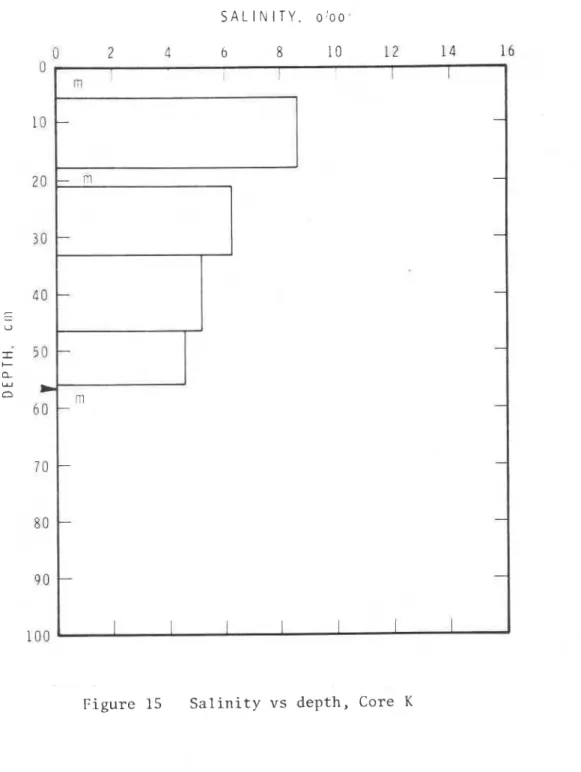
For the salinity profiles which are shown in bar graph form, the symbol m signifies that no salinity measurement was taken in this area, the large arrowhead indicates the core length, and the small arrowhead indicates the ice thickness at the location where the core was taken. Temperature profiles along the core, where measured, are indicated by large dots superimposed on the salinity plots. On the compressive and Brazil strength bar graphs, the u per number in each of the bars indicates
the loading stress rate (MPa s'~), the lower number indicates the square
root of the brine volume fraction for the sample, and the asterisk (*)
denotes a brittle failure. The test temperature for most of the com-
pressive strength studies was -26°C + 2OC, whereas the test temperature
for all of the Brazil tests and the compression tests for Core 0, P and
Q
was -19.S°C + O.S°C.Cores of October 1979 - Multi-Year Ice
Five cores were taken by E. Banke from ridges in multi-year ice
in October 1979 and stored in plastic bags in a freezer at -15'~. These
cores were labelled R, S, T, U, V.
Core R was taken on 13 October and was labelled "Ridge #1 Core
Oct. 13, 1979, MY Ridge 10 m thick, Temp. -30'~". The core consisted of
three individual pieces and was 87 cm long. There were many long brine drainage channels running lengthwise through this core. The salinities and compressive strength profiles measured on this core are shown in
Figures 3 and 4 respectively.
Core S was taken 16 October 1979 and labelled "Centre of Ridge, MY ice". This core was 89 cm long and comprised of three segments. The top 18 cm were clear with large air bubbles whereas the rest of the core was opaque with many small air bubbles. The salinities and compressive
strength profiles are shown in Figures 5 and 6 respectively.
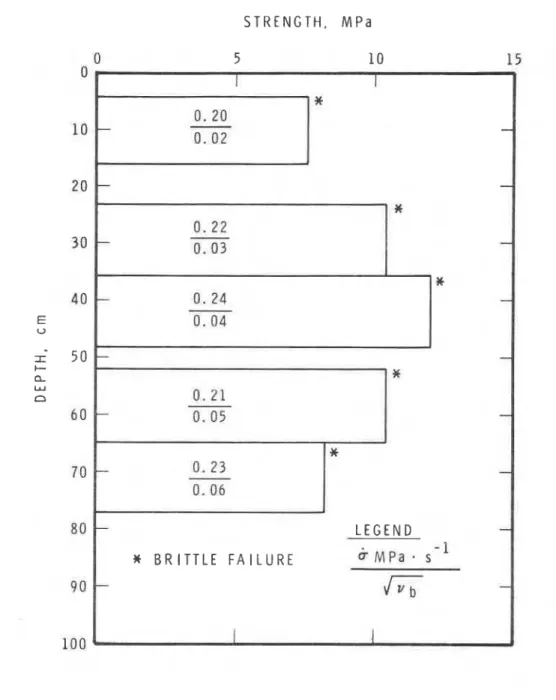
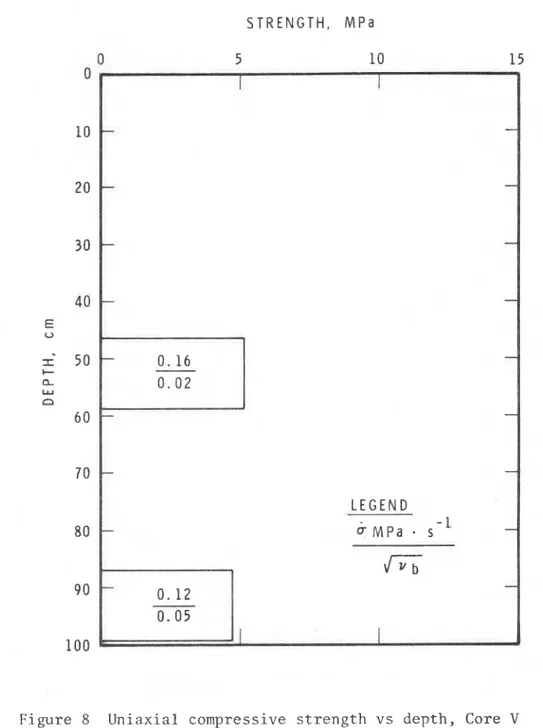
Core V was also taken 16 October 1979 and labelled "Core # 2 to
1.8 my MY, -1.7 at 1.0 m". This core was in four segments and was 140 cm
long. The salinity and compressive strength profiles are given in Figures 7 and 8 respectively.
Core T was labelled Ifcore #2 from top of block at ridge # 3 , MY
ice block, 4 m thick" but no date for this core was given. It consisted
of six pieces and was 102 cm in length. In general it had a bubbly granular appearance. The salinity and compressive strength profiles are given in Figures 9 and 10 respectively.
Core U was labelled f'Core 3 from ridge 4 in thin section" and, as
with Core T, no date was given. This core was 79 cm long and in two pieces.
In general, it had a milky bubbly appearance with obliquely aligned brine
drainage channels from 35 to 60 cm depth. The bottom 15 cm was slightly c l e a r e r . The salinity and compressive strength profiles for this core are
Core of 2 January 1980
-
First-Year IceCore L was taken on 2 January 1980 by E. Banke and labelled tfSummers Harbour (-30°C) 10 cm snow top, ice surface temperature under snow -180Cff and stored in an ABS tube in the freezer at - l S ° C . This core was 82 cm long and in two segments. In general, the ice in this core was translucent with many brine drainage channels throughout its length. The core appeared to be symmetric about its midpoint and it was difficult to distinguish the top from the bottom. The salinity and compressive strength profiles are shown in Figures 13 and 14 respectively.
Core of 9 Januarv 1980
-
First-Year IceCore K was taken on 9 January 1980 by E. Banke and labelled "12 miles north of McKinley Bay (-29'~)'~ and was stored in an ABS tube in the freezer at -lS°C. This core was in two segments of total length 57 cm. The salinity and compressive strength profiles are shown in Figures 15 and 16 respectively.
Cores of 10 Januarv 1980
-
First-Year IceThree cores (Cores A, I, J) were taken on 10 January 1980, by E. Banke and labelled "3 cores in 100 cm ice, zero snow cover, at 70' 11.4'N
-
131' 15.4'Wft, and stored in ABS tubes in an uninsulated steel hut at the stern of the ship.Core A was 87 cm long and in four pieces. The top 8 cm of this ice was snow ice and there was some brown sediment between 30 and 35 cm depth. For this core, a full vertical thin section profile (Figure 17) and a salinity profile (Figure 18) was made.
Core I was in two pieces of total length 84 cm. It had the same snow ice and sediment bands as Core A . The salinity and compressive
strength profiles for this core are shown in Figures 19 and 20 respectively. Core J was 84 cm long and in three pieces. It had the same general features as Cores A and I. The salinity and compressive strength profiles for this core are shown in Figures 21 and 22 respectively.
Cores of 11 January 1980 - First-Year Ice
Four cores (Cores D, F, G, H) were taken from ice 63 cm thick on 11 January 1980 by E. Banke and stored in two ABS tubes in the steel hut at the stern of the ship.
Core D was in two pieces and was 58 cm in length. A full vertical thin section profile was made of this core as well as two horizontal
sections (Figure 23) and a salinity profile (Figure 24).
Core F was 62 cm long and in three pieces. There was a layer of snow ice -7 cm thick at the top of the core. The salinity and compressive strength profiles for this core are given in Figures 25 and 26 respectively.
Core G comprised two p i e c e s of t o t a l length 62 cm. This c o r e a l s o showed a snow l a y e r i n t h e upper 7 cm of i c e . The s a l i n i t y and com- p r e s s i v e s t r e n g t h p r o f i l e s f o r t h i s c o r e a r e shown i n Figures 27 and 28 r e s p e c t i v e l y .
Core H was 66 cm long and i n two p i e c e s . I t a l s o had an upper snow i c e l a y e r . The s a l i n i t y and compressive s t r e n g t h p r o f i l e s a r e shown i n Figures 29 and 30 r e s p e c t i v e l y .
Cores of 14 Januarv 1980 - F i r s t - Y e a r I c e ,
Two c o r e s (Cores B , C) were t a k e n 14 January 1980 a t 1:00 p.m. from snow covered i c e b e s i d e t h e s h i p .
Core B was taken from l e v e l i c e n e a r a small r i d g e . Immediately a f t e r t a k i n g t h e c o r e from t h e i c e , a temperature p r o f i l e was t a k e n , and t h e c o r e was c u t i n t o d i s c r e t e segments f o r s a l i n i t y a n a l y s i s (Figure 3 1 ) .
Core C was taken from l e v e l i c e away from t h e r i d g e s (-20 m from Core B), and b o t h a temperature and s a l i n i t y p r o f i l e were t a k e n f o r t h i s c o r e (Figure 32). FENCO jack t e s t s were done i n t h e i c e where t h i s c o r e was t a k e n .
Core of 15 J a n u a r v 1980 - F i r s t - Y e a r I c e
Core E was t a k e n on 15 January 1980 from t h e i c e b e s i d e t h e s h i p a t 12:30 p.m. ( s h i p heading 316"). An o r i e n t a t i o n mark p a r a l l e l t o t h e s h i p heading was placed on t h e c o r e s . There was a 6 cm snow cover and t h e i c e t h i c k n e s s was 103 cm. From t h i s c o r e , temperature and s a l i n i t y p r o f i l e s were obtained (Figure 3 3 ) , and h o r i z o n t a l t h i n s e c t i o n s were made a t t h r e e l o c a t i o n s i n t h e c o r e (Figure 34).
Cores o f 18 January 1980 - F i r s t - Y e a r I c e from Ridee
Two c o r e s (Cores M , N) were taken 18 January 1980 from l a r g e
blocks o f b l u i s h - g r e e n i c e i n a r i d g e . Contrary t o a l l o t h e r c o r e s , t h e s e c o r e s were d r i l l e d h o r i z o n t a l l y . Both c o r e s were t a k e n from t h e midpoint o f i c e blocks which were -40 cm t h i c k .
Core M c o n s i s t e d o f two p i e c e s . A t h i n s e c t i o n was made from one o f t h e p i e c e s (Figure 35) and a compression and s a l i n i t y measurement was performed on t h e o t h e r (Table I ) .
Core N c o n s i s t e d o f s e v e r a l p i e c e s of v a r i o u s l e n g t h s . T h i s c o r e was trimmed i n t o seven u s e f u l p i e c e s . A t h i n s e c t i o n was made on one
(Figure 36), and compression and s a l i n i t y measurements were performed on t h e o t h e r s (Table I ) .
Cores o f 19 January 1980 - F i r s t - Y e a r I c e
Three c o r e s (Cores 0 , P , Q) were t a k e n a t -10:30 a.m. on
19 J a n u a r y 1980 from f l a t l e v e l i c e b e s i d e t h e s h i p . These c o r e s were p u t i n ABS t u b e s and taken on board f o r a n a l y s i s .
Core 0 consisted of three pieces and was 76 cm in length. This ice was milky coloured in the top 6 cm and there was a layer of dirty ice
from 17 to 27 cm. A temperature profile was performed on this ice immedi-
ately after taking it out of the ice sheet. Tn addition to this and t h c
salinity profile (1:igurc 3 7 ) , 110th coe~l>rcssion (1:igurc 38) alict Brazil (Figure 39) strength tests were performed on thjs ice.
Core P was taken from a location -2 m from Core 0. This core
consisted of three pieces and was 92 cm in length. There was a dirty
layer from 18 to 46 cm. A horizontal thin section (Figure 40), temperature
and salinity profile (Figure 41), compression tests (Figure 42) and Brazil tests (Figure 43) were made on this core.
Core Q was taken -3 m from Core 0 . It consisted of four pieces and
was 69 cm in length. There was a 2 cm top layer of snow ice, a dirt band
from 21 to 28 cm, and oblique (-45") brine drainage channels from 46 cm to
the bottom of the core. From this core, a thin section (Figure 44), salinity profile (Figure 45), compression tests (Figure 46) and Brazil tests (Figure 47) were made.
Cores of 21 February 1980
-
First-Year IceTwo cores (W, X) were taken by E. Banke on 21 February 1980,
packagcd in ABS tubes, and sent to one of the authors (R. Frederking)
for analysis when he was at Pullen Island.
Core W consisted of three pieces and was 91 cm long. There were
distinct layers of air bubbles at 20, 40 to 45 and 58 cm depth. Both
salinity (Figure 48) and compressive strength (Figure 49) profiles were performed on this ice. A horizontal thin section was also made (Figure 50).
Core X consisted of two pieces and was 90 cm in length. As in
Core W, there were bands of air bubbles at 20, 40 and 57 cm depth. Salinity
(Figure 51) and compression (Figure 52) tests were done on this core as
well as a horizontal thin section (Figure 50). Note that the average
loading stress rate for Cores W and X was significantly lower than that of
earlier tests. The low stress rate (less than 0.08 MPa s'l) strengths
should be increased by about 113 to compare them with previous gtrength values.
GENERAL OBSERVATIONS
In the prescnt study, several properties of sea ice were examined
in mid-winter and in many cases were tested directly after removing an ice
corc from the ice sheet. Tests of this type are extremely useful in e.lucidating the properties of sea ice, especially so since many of the
properties of sea ice change with time due to brine drainage.
Tce structure was characterized by a general trend of increasing crystalline size with depth and of aligned columnar grains in the lower layer. These structural characteristics are fairly typical for first-year sea ice. Distinct banding was evident in many of the cores and, in some cases, an indication of preferred horizontal c-axis alignment of the grains
near the bottom of the core was evident (Figure 34). Very distinct bands of sediment-impregnated ice were visible in some cores. Long continuous brine drainage channels that extended through a large part of the ice could be seen in the multi-year ice.
'I'hc salinity profiles givc an indication of both tllc average salinity of the ice, and of the general salinity variation with depth through the ice*. It should be borne in mind, however, that most of the salinity profiles were performed on ice that had been stored for some time before testing. Undoubtedly, even though the cores were generally stored below the sodium chloride - water eutectic temperature, there was some brine drainage from the cores. (This was especially noticeable in the
cores stored in the freezer at -15'~ which is slightly above the
NaC1-Hz0 eutectic temperature). As such, the two dedicated salinity pro- files that were obtained on samples cut and bagged directly after removal from the ice sheet (Core B y Figure 31 and Core C, Figure 32) offer the most accurate salinity profiles. In both cases, the profiles show a general decrease in salinity with depth, with high salinities (12 to 14%,) in the upper regions. In general, however, the average salinity of the ice was of the order of 5 to 6%,.
Several aspects of the compressive strength results of the ice are notable. In general, for the same test temperature, there appears to be a definite increase in strength of the ice with increasing depth. Moreover, there is a general pattern of ductile failures in the upper granular ice and brittle failure in the lower columnar ice. The strength values of 10 to 20 MPa measured for some of the lower core samples are extremely hight and are, in fact, higher than that generally reported for vertical sea ice compressive strength (Peyton, 1966). Such high values may have resulted from both the very cold test temperatures (i.e., the low brine
-
* Knowing the salinity and temperature profiles through the ice, the brine
volume fraction of the ice can be determined by: -
Yb -
1000
for -.52 8 2 -22.9
where 8 is the ice temperature and S is the salinity in parts per thousand
(Frankenstein and Garner, 1967).
t It should be borne in mind that the test temperatures are much lower
than those to which this lower ice would be naturally subjected. Since the strength of this ice decreases with increasing temperature, the measured strength of this lower ice is much higher than it would be at its natural ambient temperature. Further tests under controlled ambient conditions would be required in order to get a temperature- compensated strength profile through the ice.
volume in the ice) and the pronounced columnar nature of the grains in the lower layer. The measured horizontal compressive strengths
(3.5 to 4.5 MPa) are generally much lower than the vertical compressive
strengths (10 to 20 MPa). This trend is in agreement with other reports
on measurements of vertical and horizontal compressive strength of ice.
As was pointed out on p. 3 all the tests were done at a fixed
cross-head rate (3 x mm/s). Average compression specimen length was
120 mm, therefore the nominal strain rate for all these tests was about
3 x s-l. Brine volume is often used as an independent variable in
evaluating sea ice properties (Weeks and Assur, 1967). This has been done in Figure 53 for the results of this test program. There is a gradual decrease in strength with increasing brine volume but it is not particularly clear. From recent investigations of mechanical properties of ice it is known to be particularly load history dependent. The fore- going test results were replotted on the basis of stress history in Figure 54. In this case there was less scatter and a definite trend of increasing strength with increasing stress rate. A similar trend has been found for fresh water ice by Sinha and Frederking (1979). The strong influence of stress rate on strength shows the importance of assessing this factor in comparing strength values of various investigators.
With regard to the Brazil tests, the few tests performed indicate that the Brazil strength for this ice for brine volume fractions of -0.017
was of the order of 3 MPa for the granular ice and 2 MPa for the columnar
ice. These values are in good agreement with other reports of Brazil strengths for sea ice of this brine volume (Figures 53,54) (Frankenstein, 1967).
ACKNOWLEDGEMENTS
The authors would like to thank Dome Petroleum Ltd. for the opportunity of participating in the KIGORIAK trials and their permission to publish these results. The logistic, transportation and accommodation support provided by CANMAR made the involvement possible. Finally, the encouragement, moral support and aid of the trials team, Captain and crew, is gratefully acknowledged.
REFERENCES
Frankenstein, G.E. 1967. Ring tensile strength studies of ice. U,S.A. Cold Regions Research and Engineering Laboratory Tech. Report 172. Frankenstein, G.E., and Garner, R. 1967. Equations for determining the
brine volume of sea ice from -0.5 to -22,g°C. Journal of Glaciology, Vol. 6, NO. 48, p. 943-44.
Peyton, H.R. 1966. Sea ice strength. Geophysical Institute, University of Alaska, Report No. UAG R-182.
Sinha, N.K. and Frederking, R. 1979. Effect of test system stiffness on strength of ice. Proceedings, 5th International Conference on Port and Ocean Engineering under Arctic Conditions, Trondheim, 13-18 August 1979, pp. 708-718.
Weeks, W., and Assur, A. 1967. The mechanical properties of sea ice. U.S.
Army Materiel Command, Cold Regions Research and Engineering Laboratory,
Hanover, New Hampshire, 80 p.
TABLE I
STRENGTH RESULTS FOR HORIZONTAL CORES
Core Strength Stress Rate
Figure 1 Improvised Cold Room
S A L I N I T Y , 0 1 0 0
6 8 10 1 2 14 16
STRENGTH. M P a 5 10
-
'*
0. 20 - 0.02 --
-*
0.22 - 0 . 0 3-
*
- 0. 24 - 0.04 - - -*
0 . 2 1 - 0.05 +*
- 0. 23-
0 , 0 6 - LEGEND -*
B R I T T L E F A I L U R E M P a s - ' -6
+ \ 1I
S A L I N I T Y , 0100
6 8 10 1 2 14 16
S T R E N G T H . MPa
L E G E N D
U M P ~ . s - 1
S A L I N I T Y , o l o o
2 4 6 8 10 1 2 1 4 1 6
S T R E N G T H , MPa
5 1 0
L E G E N D r MPa
.
s - 1.S A L I N I T Y , o l o o
0 2 4 6 8 10 12 14 1 6
*
103S T R E N G T H , M P a
L E G E N D M P ~
-
s-
1S A L I N I T Y , o l o o 0 2 4 6 8 10 12 14 16 0 1 I rn I 7 10 -
-
L 20 - - 30 - - rn 40-
- E U 50 - - C a W n-
60 - - 7 0 - m - b- 80 - 90 - - I 1 I 100I
S T R E N G T H , MPa
L E G E N D
& M P ~ . s - 1
S A L I N I T Y , 0 1 0 0
0 2 4 6 8 10 12 14 16
STRENGTH, MPa
10 15
Figure 14 Uniaxial compressive strength vs depth, Core L
1 - 0 . 2 1 - 0 . 0 8 -
*
- 0 . 3 0 0 . 0 7 --
*
0 . 2 8-
0 . 0 7-
*
- 0 . 2 8 - 0 . 0 7 -*
- 0 . 2 7 0 . 0 7-
-
0 . 1 4 0.08 LEGEND - -6
MPa-
s-
1fi
--
*
BRITTLE FAILURE 1I
S A L I N I T Y , o : o o .
6 8 10 1 2 1 4 16
S T R E N G T H , MPa
Figure 16 Uniaxial compressive strength vs depth, Core K 0 . 2 0
-
0 . 1 1 1 - - -. 0 . 17 0 . 0 9 - 1 - 0 . 2 3 0 . 0 9 - 0 . 2 2 0 . 0 8*
-
- L E G E N D b M P ~ . s - 1 -6
-
*
B R I T T L E F A l l U R EFigure 17
Vertical thin sections
of Core A, total length
approximately 85 cm (cm grid)
S A L I N I T Y , 0100
0 2 4 6 8 10 12 14 16
S A L I N I T Y , o l o o
2 4 6 8 10 12 14 16
S T R E N G T H , MPa 5 10 I 0. 13 L E G E N D - - U M P ~ . s - 1 0 . 1 1
-
6
- 0. 18 - 0.09 - 0 . 1 9 --
0.09*
- 0. 19 - 0 . 0 9*
- - 0 . 1 9 0 . 0 9 - - 0 . 2 1 - 0. 0 8-
-*
- B R I T T L E F A I L U R E bI
F i g ~ l r e 20 U n i a x i a l compl-essive s t r e n g t h v s d e p t h , Core IS A L I N I T Y , 0 1 0 0
S T R E N G T H , M P a - 0 . 1 9 - 0. l o - - 0 . 1 7 0 . 0 9 0 . 1 8 0 . 0 9 - A 0 . 2 2 - 0 . 0 8 - -
-
*
+ 0. 2 3n.
0 8 - A 0. 1 9 - 0 . 0 9 L E G E N D - 6 - ~ ~ a - s - 1 - -*
B R I T T L E F A I L U R E6
F i g u r e 2 2 U n i a x i a l c o m p r e s s i v e s t r e n g t h v s d e p t h , Core JFigure 23 Vertical and horizontal thin sections
of Core D, length approximately 60 cm
S A L I N I T Y , o l o o
S A L I N I T Y , o l o o
6 8 10 12 14 16
S T R E N G T H . % \ P a 5 10 C 1). 24 0. 10 - 0 . 2 1 0. 10
-
d 0. 2 4 - - 0 . 0 8*
- 0. ? 3 0. 09 --
*
0. 2 b-
0 . 0 8 - - L E G E N D - U M P a-
s - 1 -JYb
- - -*
B R I T T L E F A I L U R E F i g u r e 26 U n i a x i a l compression s t r e n g t h v s d e p t h , Core FS A L I N I T Y , o l o o
6 8 10 1 2 14 16
S T R E N G T H , M P a
- L E G E N D -
M P ~
.
s - 1-
JK
--
*
B R I T T L E F A I L U R E -S A L I N I T Y , o l o o
S T R E N G T H , M P d
L E G E N D
"
MPa.
s - 1*
B R I T T L E F A I L U R ES A L I N I T Y , o l o o
T E M P E R A T U R E . " C
S A L I N I T Y , o l o o 0 2 4 6 8 10 1 2 14 1 6 8 0 - - 9 0 - - 100 I 1 I I 0 - 10 - 20 - 30 -40 T E M P E R A T U R E , "C F i g u r e 32 S a l i n i t y and t e m p e r a t u r e v s d e p t h , Core C
S A L I N I T Y , 0 1 0 0
4 6 8 10 1 2 14 16
T E M P E R A T U R E , " C
Figure 34 Horizontal thin sections of Core E, z = core depth (cm grid)
Figure 35 Horizontal thin section of Core M (cm grid)
Figure 36 Horizontal thin section of Core N
S A L I N I T Y , o l o o 6 8 10 12 14 16 C 8 0 - 3 9 0 - - . o o I
1
I 1 I 0 - 10 - 20 - 3 0-
40 T E M P E R A T U R E , "CS T R E N G T H , M P a 5 10 F i g u r e 38 U n i a x i a l compressive s t r e n g t h v s d e p t h , Core 0 I -
-
-
- 0. 1 5 0. 14 --
0. 1 8 0.12 --
-
-*
- 0 . 2 1 - 0 . 1 1 --
L E G E N Da
M P ~ . s - 1 +-
6
--
% B R I T T L E F A I L U R EI
I
B R A Z l L S T R E N G T H , MPa
1 2 3
Figure 40 Horizontal sections of z = depth thin Core (cm grid)
S A L I N I T Y , o l o o
T E M P E R A T U R E , " C
S T R E N G T H , M P a 0 5 10 15 7
I
L E G E N D - - & M P ~ . s - 1 4 - 0. 1 3\lyb
- 0 . 1 1 -*
B R I T T L E F A I L U R E + - - 0 . 1 2 - -B R A Z l L S T R E N G T H , MPa
Figure 44 Horizontal thin section of Core Q,
depth = 65 cm (cm grid)
S A L I N I T Y , o l o o
S T R E N G T H , MPa 5 10 -
-
0. 13 - 0.12-
--
--
*
7 0. 14-
-
0 . 1 2-
L E G E N D 7-
u M P a-
s - 16
-
-
# B R I T T L E F A I L U R E --
1
B R A 2 l L S T R E N G T H , MPa
S A L I N I T Y , 0 1 0 0 6 8 1 0 1 2 14 1 6 -.. b 1 2 0 - 1 0 - 20 - 3 0 TEMPERATURE. "C F i g u r e 48 S a l i n i t y and t e m p e r a t u r e vs d e p t h , Core W
S T R E N G T H , MPa 10
I
-
0. 24 - 0. 13 - 0 . 2 2 - 0. 1 3 L E G E N D U M P ~ . s - 1 - 0. 05 0. 16&
-
- 0 . 1 2 0, 1 0 - - 0 . 0 8 - 0 . 1 2 --
0 . 0 8 - 0. 14 - - \1
Core W, depth = 89 cm
Core X, depth = 89 cm
Figure 50 Horizontal thin sections
S A L I N I T Y , o l o o
6 8 10 12 14 16
S T R E N G T H , MPa
5 10
Figure 52 Uniaxial compressive strength vs depth, Core X I - - 0.05 0. 14 - - - I 0.05 - 0. 1 7 - - L E G E N D - U M P ~ . s - 1
-
6
-
-
- 0.07 - 0.14 - -I I
TYPE OF FAILURE DUCTILE B R I T L E - L I K E
F I K S T YEAR ICE u
-
.
MULTI -YEAR ICE - - 8 -.
-.
- a.
4 rn.
.
7 u - 8. .
" g-
oc " 8 a >T C m % o - " 0 oOc 3 08,;
C : 3 3 0 0 a 0 J t I 5 1 0 1 5 B R l N E V O L U M E , o l o o F i g u r e 5 3 S t r e n g t h v s b r i n e volume f o r v e r t i c a l c o r e s ; t e s t t e m p e r a t u r e -20° t o -27OC, s t r a i n r a t e 3 x 10⁻⁴ s - 1I I
TYPE OF FA l LURE
DUCTILE BR ITTLE-LIKE a
FIRST YEAR ICE o a