Publisher’s version / Version de l'éditeur:
Vous avez des questions? Nous pouvons vous aider. Pour communiquer directement avec un auteur, consultez la
première page de la revue dans laquelle son article a été publié afin de trouver ses coordonnées. Si vous n’arrivez pas à les repérer, communiquez avec nous à [email protected].
Questions? Contact the NRC Publications Archive team at
[email protected]. If you wish to email the authors directly, please see the first page of the publication for their contact information.
https://publications-cnrc.canada.ca/fra/droits
L’accès à ce site Web et l’utilisation de son contenu sont assujettis aux conditions présentées dans le site LISEZ CES CONDITIONS ATTENTIVEMENT AVANT D’UTILISER CE SITE WEB.
Technical Note (National Research Council of Canada. Division of Building
Research), 1974-05
READ THESE TERMS AND CONDITIONS CAREFULLY BEFORE USING THIS WEBSITE.
https://nrc-publications.canada.ca/eng/copyright
NRC Publications Archive Record / Notice des Archives des publications du CNRC :
https://nrc-publications.canada.ca/eng/view/object/?id=12821f67-a9c8-4a69-9060-38085ff01bd3 https://publications-cnrc.canada.ca/fra/voir/objet/?id=12821f67-a9c8-4a69-9060-38085ff01bd3
NRC Publications Archive
Archives des publications du CNRC
This publication could be one of several versions: author’s original, accepted manuscript or the publisher’s version. / La version de cette publication peut être l’une des suivantes : la version prépublication de l’auteur, la version acceptée du manuscrit ou la version de l’éditeur.
For the publisher’s version, please access the DOI link below./ Pour consulter la version de l’éditeur, utilisez le lien DOI ci-dessous.
https://doi.org/10.4224/40001188
Access and use of this website and the material on it are subject to the Terms and Conditions set forth at
Vibrations of three electron microscopes
·.
NATIONAL RESEARCH COUNCIL OF CANADA
No.
583 OF BUILDING RESEARCH :>[Nセ ZセN :, NゥゥNゥjNセ ....セ DIVISIONPREPARED BY Gerald Pernica CHECKED BY T.D.N. APPROVED BY C.B.C.
.2AI!. May 1974
PREPARED FOR
. Record Purposes
SUBJECT VIBRATIONS OF THREE ELECTRON MICROSCOPES
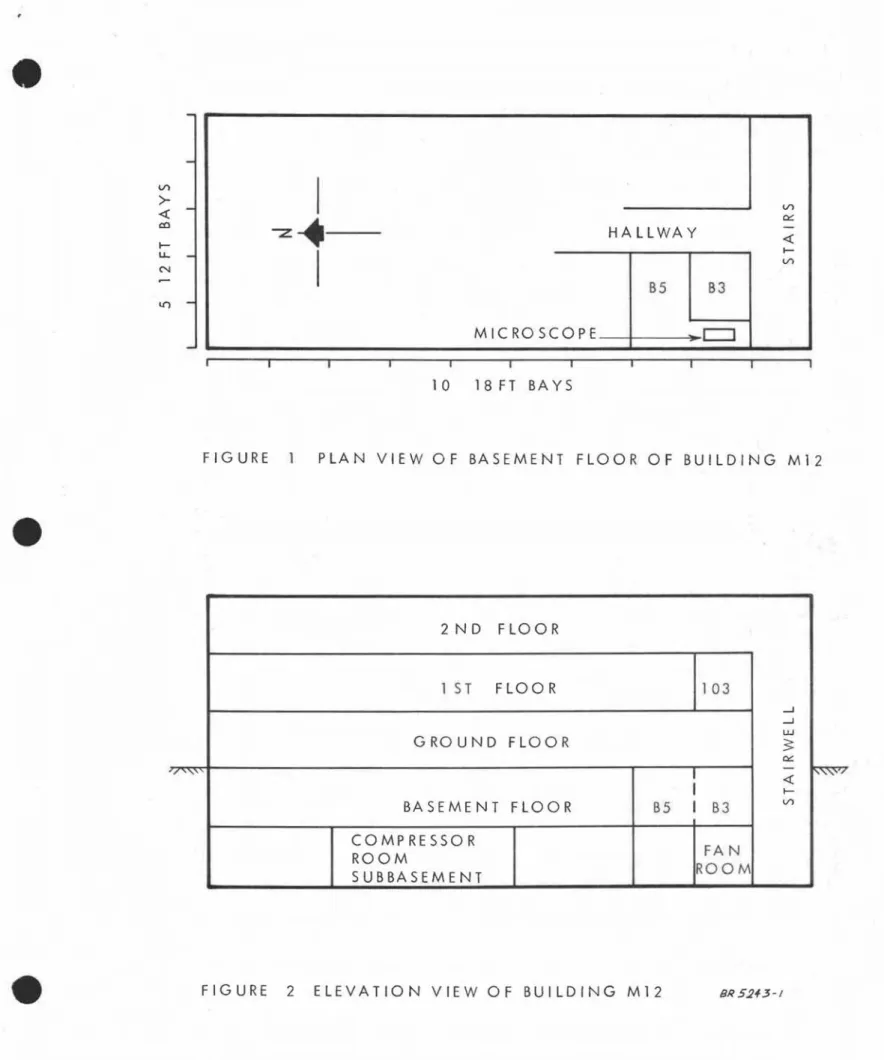
Vibration measurements were taken on 12 February 1973 in
Room B5 of Building M12, Division of Chemistry. Building M12 is five
storeys in height of which two are below ground level. The building is
five bays wide (east-west direction) and ten bays long (north-south
direction). Room B5 is located near the southwest corner of the building
on the basement level which is the first storey below ground level (F ig s . 1 and 2).
Located in the rear of Room B5 (Fig. 1) was an EM6
Metropolitan Vickers electron microscope. For a magnification of
50,000 times or greater important details of the image were severely
blurred. The vibration of the image plane was e specially noticeable in
one direction due to the presence of sizable beats. Four large
com-pressors in the basement of the building were blamed for these poor
image receptions. These compressors were located in a room on the
same side of the building as the electron microscope, but at the centre
of the building (Fig. 2). Tw'o compressors were aligned in the east-west
direction and two in the north-south direction. All compressors had the
same rated horsepower but the speeds of rotation differed slightly.
Three compressors were always on. The fourth came on when three
were insufficient to handle the needs of the building. So as not to have
the same three compressors going all the time, different combinations
of the four were used. It was thought that certain combinations of the
..
2
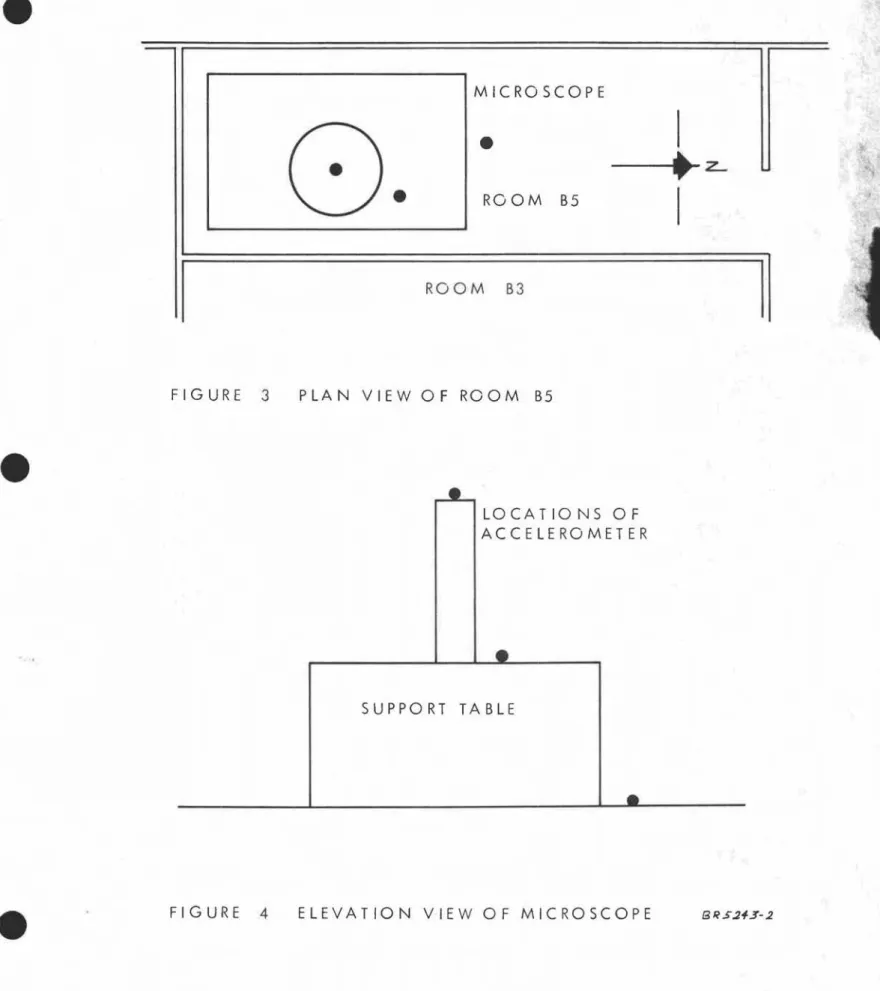
-In order to ascertain if the vibration levels were affected by the
compressor combination. vibration measurements were taken in Room B5
for all four combinations of three compressors on. The output from the
"Larson" accelerometer was recorded on a Century galvanometer recorder. Measurements in the vertical and two horizontal directions were recorded at three locations (Figs. 3 and 4).'
a) on the floor beside the microscope;
b) on the microscope support table. and c) at the top of the microscope tube.
Preliminary measurements revealed that in the horizontal and
vertical directions the lowest dominant frequency at each location was in the
neighbourhood of 30 Hz. cッョウ・アオ・ョエャケセ for the recorded measurements the
accelerometer signal was filtered for a band pass of 20-50 Hz on a "Kron-Hite" filter.
Table I is a summary of the test results for all four combinations
of one compressor off. Only the range of maximum peak-to-peak
amplitudes of acceleration of each location component from the four tests
is given. Beats were present in a majority of records. hッキ・カ・イセ a
few location components did not exhibit a beat phenomenon for any of the compl'es sor combinations.
From the results of Table I it can be seen that the amplitude of vibration of the three components at each location appears to be only
slightly dependent on the compressor combination. In order to determine
whether the compressors キ・イ・セ therefore. the major cause of the
vibrations. vibration measurements were taken with all compressors off.
Table II is a summary of these results. Beats again existed in a majority
of the records. When the results of Table II are compared to the results
of Table iセ it is seen that there is very little difference. It was therefore
concluded that the compressors were not the major cause of the vibrations. A close examination of the rooms adjacent to room B5. in the
sub-basement. basement and ground floors disclosed that a large air conditioning unit was directly beneath the electron microscope on the
sub-basement level. Although the unit was not used in its cooling capacity
during the winter months. its fan was still used to circulate air. The
motor which powered the fan rotated at 1725 rpm.
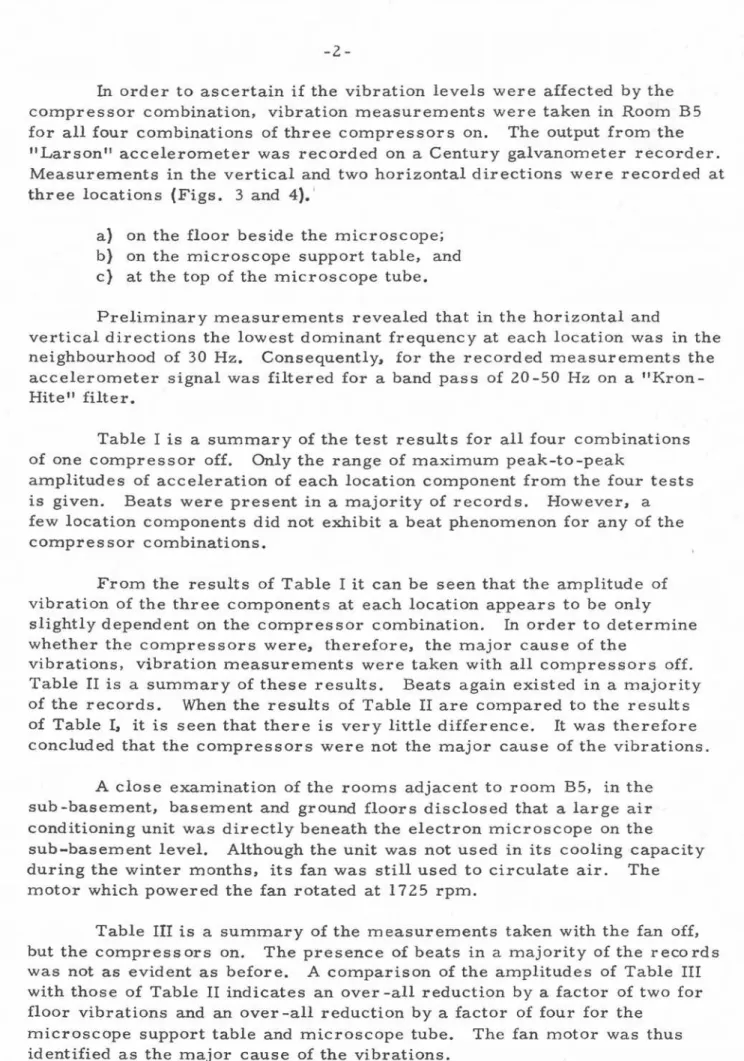
Table III is a summary of the measurements taken with the fan off.
but the compressors on. The presence of beats in a majority of the records
was not as evident as before. A comparison of the amplitudes of Table III
with those of Table II indicates an over -all reduction by a factor of two for floor vibrations and an over -all reduction by a factor of four for the
microscope support table and microscope tube. The fan motor was thus
3
-The microscope support table was closely examined in order to determine how best to reduce its transmissibility to floor vibrations.
The microscope had originally been equipped with four isolation mounts,
one at each corner. On examination it was found that two of the four
mounts needed replacement as one side of the table was now resting
directly on the floor. Until new mounts could be obtained it was suggested
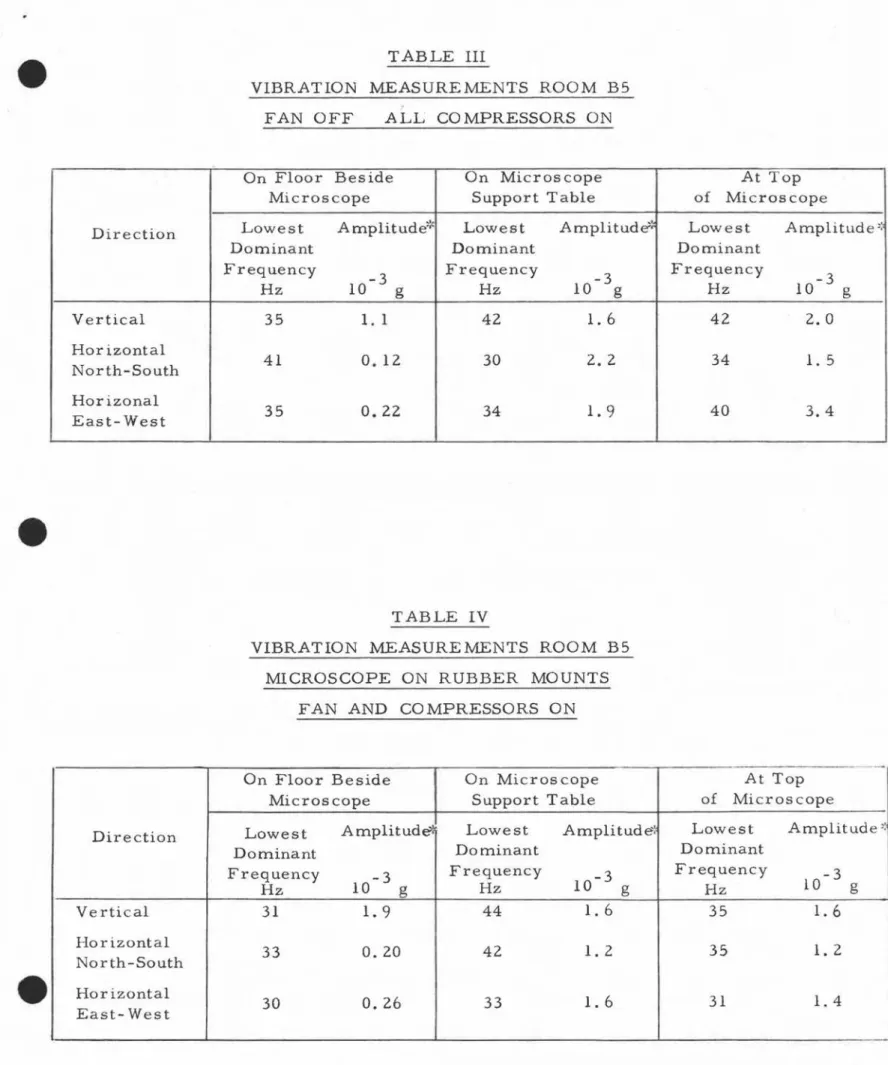
that a material such as rubber be placed under each of the existing mounts. On 21 February 1973 vibration measurements were again taken. A single piece of a rubber stopper. approximately 3/4 in. thick. had
been placed under each of the mounts. A summary of the measurements
taken with the compressors and fan motor on is given in Table IV. All
amplitudes of vibration of the microscope were even less than those
obtained with the fan motor off. Although a further reduction of these
amplitudes might be possible. these levels of vibration no longer interfered with the satisfactory operation of the microscope.
Vibration Survey of Existing Microscopes
Vibration measurements were also taken in Room 103 (Fig. 2) which contained two electron microscopes; a Cambridge Scanning
Micro-scope and a Phillips 100 transmission electron microMicro-scope. No
vibra-tion problem had been reported for either instrument. Measurements
were taken so that satisfactory operating levels for these particular
microscopes would be known. The Phillips 100 was isolated from the
floor by a single rubber mat while the Cambridge Scanning Microscope was isolated by an air mount system which formed an integral part of the microscope unit.
The results of the vibration measurements are given in Table V. For each measurement the output from the accelerometer was filtered
so as to pass frequencies within the 0-50 Hz band. The results indicated
that suitable isolation was provided for each microscope only in the
vertical direction. As there had not been any complaints from the
operator. it appeared that for both instruments the recorded vibration levels were still within the satisfactory operating range.
TABLE I
VIBRA TION MEASU REMENTS ROOM B5 ALL COMBINATIONS OF ONE COMPRESSOR OFF
po-
-
Nセ'In Floor Be side In Microscope At Top of
pirection Microscope Support Table Microscope
Lowest Lowest Lowest
Dominant Dominant Dominant
Frequency Amplitude':< Frequency Amplitude':' Frequency Amplitude::
Hz 10-3g Hz 10-3g Hz 1 0M[セァ Vertical 33 2.0 -2.4 37 3.8-6.6 37 4.6- 6.0 lHorizontal North -South 36 0.17-0.19 31 7.0-9.6 35 2.2- 5. 4 !Horizontal East- West 31 0.38-0.42 31 4.6-7.0 34 15.0-23.0 TABLE II
VIBRA TION MEASUREMENTS ROOM B5 ALL COMPRESSORS OFF
In Floor Beside On Microscope At Top of
Direction Microscope Support Table Microscope
Lowest Lowest Lowest
Dominant Dominant Dominant
Frequency Amplitude':' Frequency Amplitude':' Frequency Amplitude::
Hz 10-3g Hz 10-3g Hz 10-3g Vertical 34 2.2 37 5. 4 37 7.0 H:orizontal North -South 38 O. 18 34 6. 2 30 6. 4 :-:.Iorizontal lEast -West 31 O. 44 33 6.8 22 16.0
TABLE III
VIBRATION MEASUREMENTS ROOM B5
FAN OFF ALL COMPRESSORS ON
On Floor Beside On Microscope At Top
Microscope Support Table of Microscope
Direction Lowest Amplitude';': Lowest aューャゥエオ、・Gセ Lowest Amplitude ':
Dominant Dominant Dominant
Frequency 10 -3 g Frequency 10-3g Frequency 10- 3 g Hz Hz Hz Vertical 35 1. 1 42 1.6 42 2.0 Horizontal 41 30 2.2 34 North-South O. 12 1.5 Horizonal East- West 35 0.22 34 1.9 40 3.4 TABLE IV
VIBRATION MEASUREMENTS ROOM B5 MICROSCOPE ON RUBBER MOUNTS
FAN AND COMPRESSORS ON
.-On Floor Beside On Microscope At Top
Microscope Support Table of Microscope
Direction Lowest Amplitudeli Lowest Amplitude: Lowest Amplitude ':
Dominant Dominant Dominant
Frequency 10 - 3 g Frequency 10-3 g Frequency 10- 3 g Hz Hz Hz Vertical 31 1.9 44 1.6 35 1.6 Horizontal 33 0.20 42 1.2 35 1.2 North-South Horizontal 30 0.26 33 1.6 31 1.4 East- West
TABLE V
VIBRATION MEASUREMENTS ROOM 103
Direction On Floor On CSM On TEM
Lowest Lowest Lowest
Dominant Dominant Dominant
Frequency Amplitude':' Frequency Amplitude':' Frequency Amplitude ;,
Hz 10-3g Hz 10-3g Hz 10-3g Vertical 35 2.6 7 0.40 31 1.7 Horizontal North-South 26 0.98 8 1.5 51 2.8 Horizontal East- West 29 1.1
6
.. 3. 3 35 5.8CSM Cambridge Scanning Microscope
TEM Transmission Electron Microscope
V')
>-«
co I - U-NI
V') セMzセ
HALLWAY«
-I
l -V') B5 B3 MICROSCOPEc:J
I I 10 18FT BAYSFIGURE PLAN VIEW OF BASEMENT FLOOR OF BUILDING M12
2ND F LOO R 1 S T FLOO R 103 ....J ....J u.J GROUND FLOOR セ セ - セ " I
«
I I -BASEMENT FLOO R B5 I B3 VI COMPRESSOR FA N ROOM ROOM SUBBASEMENT,.
.
-MICROSCOPE-
I
•
•
)
セコNNN
•
ROOM B5I
-ROOM B3I
FIGURE 3 PLAN VIEW OF ROOM B5
LOCATIONS OF ACCELEROMETER
•
SUPPORT TABLE