HAL Id: hal-00502848
https://hal.archives-ouvertes.fr/hal-00502848
Preprint submitted on 15 Jul 2010HAL is a multi-disciplinary open access archive for the deposit and dissemination of sci-entific research documents, whether they are pub-lished or not. The documents may come from teaching and research institutions in France or abroad, or from public or private research centers.
L’archive ouverte pluridisciplinaire HAL, est destinée au dépôt et à la diffusion de documents scientifiques de niveau recherche, publiés ou non, émanant des établissements d’enseignement et de recherche français ou étrangers, des laboratoires publics ou privés.
Correlation crises in insurance and finance, and the need
for dynamic risk maps in ORSA
Stéphane Loisel, Pierre Arnal, Romain Durand
To cite this version:
Stéphane Loisel, Pierre Arnal, Romain Durand. Correlation crises in insurance and finance, and the need for dynamic risk maps in ORSA. 2010. �hal-00502848�
Correlation crises in insurance and finance, and the need
for dynamic risk maps in ORSA
St´ephane Loisel
Universit´e de Lyon, Universit´e Lyon 1, Institut de Science Financi`ere et d’Assurances, 50 Avenue Tony Garnier, F-69007 Lyon, France
Ph.: +33437287429, Fax: +33437287632, email: stephane.loisel@univ-lyon1.fr
Pierre Arnal
Actuaris, Le Valvert, 46 bis chemin du Vieux Moulin, 69160 Tassin, France Ph.: +334 72 18 58 58, Fax: +33 4 72 18 58 59, email: pierre.arnal@actuaris.com
Romain Durand
Actuaris, Le Valvert, 46 bis chemin du Vieux Moulin, 69160 Tassin, France Ph.: +334 72 18 58 58, Fax: +33 4 72 18 58 59, email: romain.durand@actuaris.com
Abstract
We explain why correlation crises may occur in insurance and finance. These phenomena are not taken into account in Solvency II standard formula. We show the importance of taking them into account in internal models or partial internal models. Given the variety of scenarios that could lead to correlation crises and their different potential impacts, we support the idea that ORSA (Own Risk and Solvency Assessment) reports of insurance companies should include dynamic and causal correlation crises analyzes.
Keywords: correlation crises, insurance, finance, risk aggregation.
1
Introduction
According to former French president Jacques Chirac, ”les emmerdes volent toujours en escadrilles”. This saying (that one could translate into ”Problems always come as a flying patrol”) seems to verify both generally speaking and in finance and insurance nowadays. The problem is that regulators and risk managers tend to underestimate the fact that when things go bad, correlation may increase and simultaneous losses are much more likely to occur than in the classical regime. In this paper, we aim at explain-ing how sudden increase in correlation may occur and why it is important to take into account those so-called correlation crises (introduced inBiard et al.(2008)). Besides, we explain why Solvency II standard formula’s correlation principle must be completed by an additional ERM analysis. In addition to the comments of Filipovic (2009) on the inadequate two-level correlation scheme of Solvency II, we explain why we think that time to react is extremely important. Time for correlation to occur, for compa-nies to anticipate the change, and for regulators to take action if needed is not usually taken into account in risk maps or correlation maps, and we think that it should be a key component of the global risk analysis of an insurance business (similar idea to the
liquidity problem for hedging purposes), together with the order in which events occur. One incredible series of air crashes happened in August 2005: five crashes within twenty-two days! On August 2, an Air France plane crashed after landing in Toronto, 309 passengers, no victim. On August 6, a Tuninter plane damaged in sea, 39 pas-sengers, 14 dead. On August 14, a H´elios Arways plane crashed into a mountain near Athens, 121 passengers, no survivor. On August 16, a West-Carribean crashed in Venezuela, 160 passengers, no survivor. On August 23, a Tans plane crashed in Ama-zonian, 98 passengers, 40 dead. Is such a series so exceptional? Actually, not really. In
Janvresse and de la Rue(2007), it is shown that the probability for such a sequence of five air crashes to occur within a period of twenty two days is about 11% per year.
The well known curse of Tutankhamun is another example of mysterious series of death. It began after the excavation of Tutankhamun tomb by an archaeologist team in November 1923. About six months later, the expedition backer Lord Carnavon died of pneumonia. Shortly after the death of Lord Carnavon, the canary of the first visitor of the tomb was eaten by a cobra, the protective snake of pharaoh. Sum-total, about 30 persons related to an archaeologist died few years quite rapidly after the excavation. In
Janvresse and de la Rue(2007), one can read that this curse is the result of the focus on the entourage of the archaeologists and that the life expectation of expedition members is normal.
Those two examples drawn fromJanvresse and de la Rue(2007) do not correspond to correlation crises, but to clusters of unfavorable events that may occur with differ-ent likelihoods depending on how correlated risk processes are (seeFerro and Segers
(2003) andRobert(2009) for more details). One might have the feeling that correlation crises in insurance and finance do not really occur and that we just focus too much on some indicators a posteriori. In this paper, we show that correlation crises do happen in reality. We describe the different phenomena that can breed real correlation crises, and we show that the potential scenarios may be very different from one case to the other.
Our paper is organized as follows: in Section 2, we present a first source of correla-tion crises: common shocks. In Seccorrela-tion 3, we investigate regime switches of correlacorrela-tion during crises for stock indices, credit derivatives and real-estate mortgage risk. In Section 4, we show that correlation crises may occur simply because one common risk source has been ignored. In Section 5, we explain how feedback loops can lead to very sudden correlation crises. Insurance and financial risks are often assumed to be independent; in Section 6, we show how events in one of the sectors can have important consequences in the other one, sometimes after a few weeks or months. Section 7 is devoted to contagion and inter-connectedness, and the conclusion suggests ideas about how to improve ERM risk maps and correlation maps.
2
The World Trade Center Insurance Dispute
Correlation crises do occur in reality in the insurance and finance business, and the first reason for potential correlation crises is related to the notion of common shock: one large event has direct consequences in several lines of business, or two or more linked events occur at the same time. One could think about Katrina and Rita for insurance businesses in Florida and Louisiane for example. The present section focus on the notion of event and the risk that this notion may be modified at the court before or after the event.
The World Trade Center project was assigned to the Port Authority of New York and New Jersey. In the 1970s and early 1980s, six towers were built. In 1980, Larry A. Silverstein, a real estate investor, won a bid from the Port Authority to construct 7 World Trade Center. In 1998, the Port Authority approved plans to privatize the World Trade Center. Silverstein succeeded in buying the lease which is signed on July 24, 2001, only few weeks before the September 11 attacks. This lease agreement applied to One, Two, Four and Five World Trade Center. Silverstein took insurance policies for these four buildings with 24 insurance companies for a sum-total of $3.55 billion per occurrence in property damage coverage. The term “occurrence” was the crux of an important insurance dispute. From the perspective of insurers, the September 11 attack was one event, $3.55 billion had consequently to be paid off. From the perspective of Silverstein, since two separate planes crashed into two separate buildings, there were two occurrences so $7.1 billion had to be paid off. Depending on the policies of each insurer, jury trials decided to split insurers into two groups. One group was subject to one occurrence and the others to two occurrences.
Such an example exhibits the influence of court decisions on the insurance sector. Depending on decisions at the court and political pressures or the influence of lobbies, many additional, correlated claims might suddenly be reported and have to be paid. In that case, the correlation crisis may be accompanied by an increase in the frequency of claims.
3
Change of correlation regime during crises
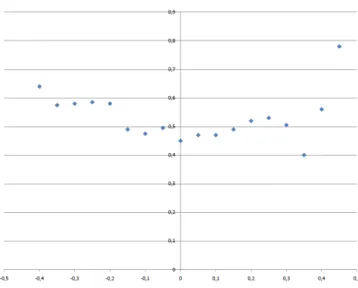
Correlation between stock prices or between indices tends to increase when things go very bad (because a crisis tends to affect most players in the market) and also when things go very well (because then the global performance of the market becomes a key common driver in that case). This is true during crises but also simply when the performance of stocks or indices is lower than usually and corresponds to a smile of correlation, comparable to the smile of volatility. In Figure 1, one can clearly see than 90-day empirical correlation between DAX and Dow Jones Industrial Index in Euros in-creases when returns on the DAX are doing bad, in comparison to the classical average regime. Index prices are observed from January 1999 to September 2009. DAX returns are grouped in classes of length 5%. Of course, a more sophisticated approach and
Figure 1: Empirical correlation between DAX and Dow Jones based on sliding 90-day windows as a function of DAX return
noise reduction are needed. Nevertheless correlation crises are there. A more detailed analysis of this example is to be carried out in a separate paper.
Similarly, implicit correlation, for example on credit correlation derivatives markets, increased a lot during the last crisis: it jumped quite rapidly from levels around 0.4 to levels between 0.95 and 1, and stayed at this unusually high level during several weeks. Solvency II standard formula does not take into account those changes of regime of correlation when things go bad. This is why most companies which deal with risks exposed to correlation crises have to develop internal models. This is the case for real-estate mortgage risk. We have built a model for a company covering this risk and we have noticed that, in this case, when things go bad, things go worse. Here is the explanation: for real-estate mortgage risk, a real-estate crack (like in London in the late 90’s) has a devastating effect both on the assets and the liabilities and may lead to an unstoppable loss spiral. A real-estate crack decreases the value of the assets which cover the commitments of the company, and induces a significant default of policy-holders with claims that may be 10 times superior to standards. While assets decrease, the capital does too, due to technical losses, which leads to a double deterioration of the coverage ratio. The company’s rating is therefore logically decreased, yet this rating has a direct effect on the company’s competitiveness, due to the Basel II constraint imposed to banks. Therefore, even if the real-estate market improves, the turnover may be significantly reduced and the profit may be not sufficient to compensate the company’s expenses. The loss ratio keeps on decreasing, so does the capital, so does the solvency ratio, and so on...
The Solvency II standard formula does not mention these correlations and does not allow anticipating this vicious circle. It is then of the responsibility of the Risk Manager
to detect this type of correlation crisis and to alert the Management who can then take the only decision possible: raise capital to stop the spiral before it is too late.
4
Ignored common risk sources
Another lesson to draw from the sub-prime crisis is that securitization, if risk is not traced, may lead to ignored correlations. The sub-prime risk, transferred, recombined, repackaged was present in many portfolios of financial institutions, local municipali-ties, insurance companies, and investors all around the world, these stakeholders being considered as relatively independent from one another. Does securitization really at-omize risk like the governor of California atat-omizes the T1000 in Terminator III? Well, it does exactly the same: the subprime risk was split in many parts that all did not look too frightening, but when the sub-prime crisis starts, the big risk recomposes exactly like the bits of the T1000 melt down to regenerate it, and losses occur everywhere, in very different portfolios in South America, Japan, America, Europe... In that case, risks that were considered to be relatively independent suddenly become strongly positively correlated because of one big source of correlation that had been ignored (on purpose or not).
Governance risk is a good example of common source of risk that is often ignored or underestimated. Many welfare institutions, pension funds or large insurance brokers have a hybrid governance model. The group provides a certain number of common services to entities like commercial vending networks, information systems (which may be owned by the group), and so on... If a governance crisis occurs, these important tools might be unavailable for all entities simultaneously during a certain amount of time. This generates potential correlation crises between operational risks of the different entities, often regarded as almost independent. Let us give a fictitious example: in Jan-uary, the CEO of such a group starts to divorce from her husband, who owns part of the buildings and of the subsidiaries of the company. In March her husband send her into the court and she is temporarily sent to jail. The whole month is a disaster for the group as the board is unable to make decisions and there is no access to information systems. Vendors and brokers do not know which side to choose. Many entities of the group are strongly penalized and are unable to report to the supervisor’s enquiry (which is, bad luck, starting exactly at the same time, remember Jacques Chirac’s citation). This leads to large operational losses for almost all entities of the group and important capital add-ons, just before the end of March. One could argue that the company would have three months to take preventive actions. But in reality, it would be very hard for the Chief Risk Officer to go and see the Chief Executive Officer and ask her to mitigate that risk.
Similarly, if several banks or insurance companies are temporarily in trouble, their fate will be in the hands of the regulators. In France, many experienced insurance regu-lators recently left. It is very important to continue to have competent and experienced regulators, because if things go bad, they will have to sort out the situation of several
institutions. This leads to another source of correlation crises related to governance transfer to regulators.
But very often, risk and correlation are going to come from an unexpected direction. Would you accept that life insurance risk in Sweden and P& C risk in South-East Asia are close to be independent? Well, they are in general, but not in the extremes: given that Tha¨ıland is one of the most praised destinations for Swedish tourists, specially during the winter season, and given that pier destruction is one of the important P& C risks in South-East Asia, do you start to see some potential correlation source? This ignored correlation source is of course tsunami risk. The December 2004 earthquake and the generated tsunami caused large losses in both lines of business (almost 2 000 Swedish casualties) that were (jointly) very unlikely to occur in an independent model. For this purpose, we developed a simple model with, on the one hand, a portfolio of Swedish policyholders with death insurance and, on the other hand, a Cat property coverage in Thailand. According to the independence or correlation hypothesis taken into account in this model, the results in terms of variance and high level Value at Risk are completely different: correlation can double or triple high level VaRs.
External shocks are not the only source of correlation crisis, which can be triggered by oscillations generated and amplified within the insurance or financial system.
5
Endogenous risk and feedback loops
5.1
Danielsson and Shin’s analogy
Another potential reason for correlation crises to occur corresponds to endogenous risk (also called feedback risk). Endogenous risk may exist if many stakeholders in the market are sensitive to some events, are likely to react in similar manners, and if their coordinated reactions have a feedback impact on the market. In that case, vicious cycles or feedback loops may break out. A nice example of such a phenomenon is the analogy between the Millenium bridge wobble and the end of LTCM developed inDanielsson and Shin (2003). Right after its opening to public in June 2000, the Millenium bridge in London started to wobble. Oscillations reached 7 centimeters at the middle of the bridge. It is well known that if you command an army and if your group is about to cross a bridge, you should ask your soldiers to walk normally on the bridge. Most recent bridges are designed to avoid vertical resonance anyway. But here, the bridge began to sway and twist in regular oscillations. The probability for this to occur was judged to be very small by engineers: what is the probability that ten thousands people end up walking exactly in step? If they were independent (which was more or less the engineers’ assumption), the probability would be close to zero. But given feedback, the probability is actually close to 1: as it can be read on the BBC website, engineers discovered that the sideways forces of the pedestrians’ footsteps created a slight horizontal wob-ble in the bridge. As the structure began moving, pedestrians adjusted their gait to the same lateral rhythm as the bridge. The adjusted footsteps magnified the motion - just like when four people all stand up in a small boat at the same time. As more pedestrians locked into the same
rhythm, the increasing oscillations led to the dramatic swaying. Danielsson and Shin(2003) compare this phenomenon to adverse price moves that the fund LTCM had to cope with in the late nineties: instead of being the perfect storm, what happened on the mar-ket was quite likely to occur given feedback. The fund LTCM, considered as a central bank of liquidity, was ruled by John Meriwether and by several Nobel prize winners. Its early success came from convergence trade: as spreads between some instruments (like government bonds issued at different dates) are theoretically converging towards maturity, it is possible to take long positions in the cheapest and short positions in the most expensive. As many copycat hedge funds did the same and as LTCM became huge, many stakeholders in the market had the same risk profile. Pre-conditions for feedback loop were in construction. During the Asian and Russian crises, this feed-back loop became reality. According toDanielsson and Shin(2003), As the convergence trades were unwound, the long positions were sold, and the short positions were bought back. This entailed adverse price shocks for all other traders that started out with similar positions. For some traders whose leverage was high relative to capital, this would entail losses on their positions sufficient to trigger margin calls on their losing positions. They would be forced to unwind their trades, which tended to reinforce the adverse price moves. Given the huge levels of leverage and the widespread nature of the trades, the vicious feedback loop was gradually set in motion in which adverse price moves led to liquidations, which further fed the adverse price moves. Schematically, we would have the following feedback loop where market distress would feed on itself: Margin Calls → Unwind Leveraged Trades → Distress → Adverse Price Move → Margin Calls → . . .
To sum up, the fact that market participants are often exposed to similar risks and to similar liquidity conditions makes correlation crises even likely. This corresponds to this quote from Richard Bookstaber: ”Global markets may actually be more risky than in the past, as the same types of investors are taking on the same type of risky bets and then simultaneously heading for the exits when trouble comes”. However, one must nuance this point of view. A single huge investment fund can be as dangerous as a multitude of copycat small investors (apart from the fact that it is maybe more visible, but on the other hand more influent): size is also a problem (the size of LTCM would have made the feedback loop appear anyway probably even if there was not a single copycat fund). The fact that large financial groups may instigate systemic risk supports the shift of some regulators from ”too big to fail” and ”too interconnected to fail” to merely ”too big”.
Like in the LTCM case, automatic margin calls between financial institutions could occur, and computers might be at the center of a feedback loop that might empty totally the cash of an institution within a few hours. Such scenarios must absolutely be studied by central banks to mitigate this risk, because of the extreme speed at which the whole process may take place.
An even more extremely fast and so dangerous feedback loop could be created by algorithmic trading. Trading platforms propose now transactions concluded by computers within a few milliseconds. If some operational risk materializes or if some
extreme event occurs, the machine could go crazy before one has time to unplug it. We still do not know whether this type of event was the cause of the flash crash at the New-York stock exchange on May 6th 2010. Circuit breakers might be a partial solution to this kind of problem, as long as they prove to be efficient and as long as contagion to other assets does not have time to develop before trading is halted.
5.2
Surrender risk and arbitrage risk
Feedback loops might also cause policyholders to panic and to surrender contracts, causing more distress and more rumors about the insurance company, leading to more surrenders, and so on... Decisions of policyholders to surrender are more or less inde-pendent from one another given some economic factor in the classical regime. However, in a stressed scenario, it is unlikely that this remains true. Loisel and Milhaud(2010) explain why the distribution of lapse rates may be far from being Gaussian in stressed scenarios, and could be modeled by a bi-modal distribution. In that case, everything depends on the reputation of the insurer or of the insurance industry, which may be affected by political declarations. Decisions of policyholders are then independent con-ditionally to this factor, which leads to a limit distribution which is no longer Gaussian but bi-modal, as the central limit theorem cannot be applied directly. Bank deposits are subject to the same risk, and feedback risk is also an important feature of these activities. Other examples of this phenomenon are the long line at the Northern bank last year, or previous runs in Australian market. The time for insurers to react might be in really extreme scenarios extended by the regulator that can (in France for ex-ample following the Code de l’Assurance) enforce the suspension of payments of the surrender values to policyholders by the insurer as long as the situation is not under control. This leads back to the problems related to governance risk in extreme scenarios discussed in the previous section. Apart from surrender risk, other types of copycat policyholder behavior may penalize insurance companies at bad instants.
A curious correlation crisis has emerged after the last financial crisis. If the devel-opment of life insurance over the last ten years seemed to follow the same virtuous path in most countries, this business model has taken a serious hit and the crisis had the insurers biting the bullet. Up to the financial crisis, the business goes in the di-rection of strong development of unit linked or variable products. This development was not without cause and was often encouraged by governments (case of the so called ”Fourgous law” in France providing some tax breaks to policyholder moving from euro denominated to unit linked contracts): for a policyholder abandoning what they see as a meagre 4% return compared to the strong performances of stocks was a clever coup. It was best of both worlds for insurers: as unit linked transfers part of the risk to the policyholder, solvency requirements are lower for this line of product. The impact of increased sales on solvency margin was sort of mitigated by the increased share of unit linked in the new business or in the in force (in case of existing business transfer). This created a sort of ”balanced growth path” for insurance companies, allowing growing and maintaining their rate of return on capital. The impact of the financial crisis on the life insurance has been twofold: on the one side the fall of stock exchanges
deter-mined a strong fall in unrealized gains, which constitute part of the solvency capital of the company, tightening their overall solvency to minimal level. In some cases, the fall created a situation close to insolvency. On the other side, the policyholders have strongly reacted to the loss of value of their unit-linked contracts and have shifted back to euro denominated products, where they see a lower but safer return. For insurance companies, the consequence is an adverse (often unanticipated) correlation: more risks due to guarantees and less free assets to cover it due to lower assets value. Moreover, insurers cannot rely any more on government bonds to provide returns in line with policyholders’ expectations, increasing overall risk of their balance sheet. To sum it up, the crisis increased the volatility and risk of the assets, lowered the capital avail-able to cover risks and determined a new appetite of customers for products requiring more capital for companies. In this case, marketing and financial events are heavily correlated and have negative impact on strength of the insurance companies.
6
Correlation between insurance and financial risks
An Italian woman could have been the miracle woman of the year 2009 if her destiny had not caught her. In June 2009, an Italian couple missed the infamous Flight 447 from Rio to Paris for being late. This plane crashed during its flight with no survivor. They succeeded in catching a flight from Rio to Munich the following day. On their homeward bound between Munich and Merano (North of Italy), in Kufstein (Austria), their car veered across a road and swerved into an oncoming truck. The woman died and her husband was seriously injured.
In that case, one gets the impression that the first event, even if it is not lethal, does create an additional risk for the immediate future because part of the protection of the individuals is gone (they are tired and probably shocked by what they just escaped). This kind of event could lead to a correlation crisis between insurance and finance: im-mediately after the occurrence of a large insurance catastrophe, reserves of insurance companies will be low. If a financial crisis happens to strike a few days later, the cash reserves usually available on the insurance side of bancassurers, coming from collected premium income, could be unavailable for banks in the need. Even if insurers are not the only source of cash for banks during crises, this could make things much worse for some bancassurers and even generate some indirect systemic risk from the banking sector. So, even if the insurance industry is unlikely to be the instigator of systemic risk (as pointed out byWeiss (2010)), the above mentioned correlation clearly contributes to the systemic risk faced by the global economy.
Some correlations or indirect effects are more diffuse in time. For example, it is al-most impossible to detect extreme insurance events like September 11, Katrina or Kobe earthquake by looking at monthly returns of stock indices. However, those events do have an impact on the global economy: after September 11 or London 2005 terrorist attacks, it was hard to purchase affordable reinsurance during several semesters, and the bid-ask spread was higher during several weeks. These phenomena have a direct
impact on the global economy that is difficult to measure though.
There are however some diffuse correlation effects between extreme financial and insurance risks that are possible to measure. Barrieu and Albertini (2009) examine prices of insurance-linked securities (ILS) between 2000 and 2009. After September 11, as reinsurance is almost impossible to find, the prices of insurance-linked securities rise. They then start to go down up to Katrina in 2005, which makes them go up again. Once again, after a while they get slightly lower, up to a major pure financial event: Lehmann’s failure in 2008. After this financial earthquake, it is almost impossible to find reliable collaterals, and the prices of insurance-linked securities increase a lot. This is a clear correlation between insurance and financial extreme risks, with consequences during several semesters, and in that case the primary event is a financial disaster.
7
How to take into account correlation crises ?
7.1
ERM Risk Maps
As said in Institute of Management Accountants (2007) “One weakness in risk maps (and in silo risk management) is that maps do not capture any risk correlations. Ignor-ing risk correlations can lead to ineffective and inefficient risk management.”
In Enterprise Risk Management (ERM), a classical risk map represents risks by likeli-hood on the x-axis and by severity (or impact) on the y-axis. It is a first overview of the company risk exposure and the beginning of an overall risk strategy, but unfortunately does not incorporate the cost of the mitigating strategies or risk controls. This problem must be overcome particularly in a dynamic setting where the trade-off between risk and average profit has even more consequences on the position of the company after a few years. The risk map is a photography of a risk landscape at a fixed date. In order to face the static nature, some risk maps include trends like “increasing”, “decreasing”, or “stable”. InWorld Economic Forum(2009), risk correlations are taken into account through a new map structure: a Risk Interconnection Map. This report tries to answer two major questions: how inter-connected are risks, and how may they evolve over time? These two questions are the crux of a efficient risk management, and so the more complicated.
Both finance and insurance risks are highly connected to environmental, societal or international conflict risks. The understanding of these linkages allows the risk man-ager first to catch the global risk exposure of its company, and secondly to foresee the evolution of these connections. On the contrary, neglecting risk connections may have serious consequences, as during the subprime crisis.
7.2
Interconnectedness maps
The recent financial crisis has underlined the problem of a company that is too con-nected to be allow to fail because of its linkages to other institutions. The signal
delivered by governments that they may intervene to keep afloat an institution too connected to fail, can encourage investor and manager risk-taking. The multiple link-age aspect raises the problem of the systemic impact of an institution failure. InCont and Moussa (2009); Bastos and Cont (2009), the authors try to capture this effect for a financial institution through a “Systemic Risk Index”. This index is based on the effects of common market factors affecting defaults, default contagion via counterparty risks, and indirect contagion via credit default swaps. The Brazilian bank sector is taken as a network example. Contagion can also be modeled by extensions of David and Lo’s model (see Rulli`ere et al. (2010)). After the “too big to fail” principle, the “too interconnected to fail” principle is a new brain-teaser for financial regulators and governments. A new American database could be soon created to get a better vision of interconnections between financial institutions in the United States. At the interna-tional level, some studies put in perspective the interconnectedness of the American and Chinese economies (seeYe(2010)).
8
Conclusion: towards dynamic risk maps
We have seen in the different previous sections that correlation crises could take mul-tiple forms, have different speeds and different sources, outside or inside the financial system. To be able to put risk controls in place, some more information is needed: in particular, the chronology of events and the opportunity to anticipate the following consequences are very important. Therefore, beyond correlation, risk analyzes should include descriptions of realistic crisis scenarios in a dynamic setting. As a conclusion, not only do we need to take into account correlation crises, but we must also be able to describe their causes and how they are going to materialize during time for each line of business. The opportunity to react is not only guaranteed by the time avail-able to do so, but also by the liquidity conditions during the crisis, that are likely to be modified. Hierarchical Archimedean copulas that feature strong tail dependence like the hierarchical Clayton copula are used in some internal risk models and may be a first approach to take into account potential correlation crises in the one year time horizon. Interconnection maps may give an idea of the links between banks, insur-ance companies or national economies. Nevertheless, these tools do not provide any information on the primary cause of the crisis and on the way events develop, both in terms of marginal risks and in terms of correlations. To encourage the development of dynamic risk maps, we believe that regulators should encourage the use of global multi-period crisis scenarios where the insurance company is placed in the context of the global economy in the Own Solvency and Risk Assessment (ORSA) reports that insurance companies will soon have to provide. The time scale should be adapted to each studied scenario (e.g. seconds or minutes for algorithmic trading operational risk, days of weeks for surrender risk, semesters or years for inflation risk). Multiple time scales might have to be used for combined scenarios involving correlation patterns that are more diffuse in time, like the ones stemming from the impact of terrorism and financial crises on future reinsurance and ILS availability and prices.
References
Barrieu, P. and Albertini, L. (2009). The handbook of insurance-linked securities. Wiley Finance.
Bastos, E. and Cont, R. (2009). The Brazilian banking system: network structure and systemic risk analysis. Working Paper.
Biard, R., Lef`evre, C., and Loisel, S. (2008). Impact of correlation crises in risk theory: Asymptotics of finite-time ruin probabilities for heavy-tailed claim amounts when some independence and stationarity assumptions are relaxed. Insurance: Mathematics and Economics, 43(3):412 – 421.
Cont, R. and Moussa, A. (2009). Too interconnected to fail: Contagion and Systemic Risk in Financial Netwotks. Working Paper.
Danielsson and Shin (2003). Endogenous risk. Working Paper.
Ferro, C. and Segers, Y. (2003). Inference for clusters of extreme values. J. Roy. Statist. Soc. B, 65:545–556.
Filipovic, D. (2009). Multi-level risk aggregation. Astin Bulletin, 39(2):565–575.
Institute of Management Accountants (2007). Enterprise Risk Management: Tools and Techniques for Effective Implementation.
Janvresse, E. and de la Rue, T. (2007). La Loi des S´eries, hasard ou fatalit´e ? Le Pommier. Loisel, S. and Milhaud, X. (2010). From deterministic to stochastic surrender risk
models: impact of correlation crises on economic capital. Working Paper available at http://isfa.univ-lyon1.fr/˜stephane.loisel/.
Robert, C.-Y. (2009). Inference for the limiting cluster size distribution of extreme values. The Annals of Statistics, 37:271–310.
Rulli`ere, D., Dorobantu, D., and Cousin, A. (2010). An extension of Davis and Lo’s contagion model. Working Paper.
Weiss, M. A. (2010). Systemic Risk and the U.S. Insurance Sector. Presentation download-able from http://www.naic.org.
World Economic Forum (2009). Global Risks 2009.
Ye, Y. (2010). Interconnectedness of the American and Chinese economies. Working Paper presented at the ERMII research Workshop, Atlanta.
![[PDF] Support de cours de C++ pour tout niveau | Cours informatique](data:image/gif;base64,R0lGODlhAQABAIAAAP///wAAACH5BAEAAAAALAAAAAABAAEAAAICRAEAOw==)