Cochlear Morphology and Sound-Induced Motion of
the Apical Mammalian Inner Ear
by
Scott Lawrence Page
Submitted to the Department of Electrical Engineering and Computer
Science
in partial fulfillment of the requirements for the degree of
Doctor of Philosophy
at the
MASSACHUSETTS INSTITUTE OF TECHNOLOGY
February 2016
@
Massachusetts Institute of Technology 2016.
All rights reserved.
Signature redacted
A u th o r ... ... W ...
Department of Electrical Engineering and Computer Science
January 29, 2016
Certified by...
Signature redacted
Dennis M. Freeman
Professor
Thesis Supervisor
Accepted by ...
Signature redacted...
U [kslie A. Kolodziejski
Chairman, Department Committee on Graduate Theses
MASSACHUSE S NSITUTE
OF TECHNOLOGY co
LU
Cochlear Morphology and Sound-Induced Motion of the
Apical Mammalian Inner Ear
by
Scott Lawrence Page
Submitted to the Department of Electrical Engineering and Computer Science on January 29, 2016, in partial fulfillment of the
requirements for the degree of Doctor of Philosophy
Abstract
Extraordinary sensitivity, frequency selectivity, and dynamic range are hallmarks of mammalian hearing. While a variety of cellular and molecular mechanisms are known to be critical to these properties, how the cellular and molecular mechanisms interact to generate the remarkable properties remains unclear. Direct observations of these interacts has proved to be difficult, in large part because the inner ear is fragile and has been difficult to probe with conventional measurement technologies. We have developed an Optical Coherence Tomography (OCT) system to use light to probe both the structure and mechanical responses of the inner ear to sound stimulation. The technique takes advantage of the interference of low coherence sources of light to detect even weakly scattering tissues in the inner ear. By sensing Doppler shifts of light scattered off moving structures in the inner ear, the OCT system can also detect sound-induced motions of cochlear structures with sub-nanometer resolution. This thesis demonstrates the use of the OCT system to study the structure of the inner ears of mice, gerbils, and guinea pigs, as well as the acoustic response of the apical turn of in vitro and in vivo apical mammalian cochleae to low frequency (100 to 1000 Hz) sounds - frequencies that are critical to our understanding of speech.
Thesis Supervisor: Dennis M. Freeman Title: Professor
Acknowledgments
I'd like to acknowledge my research group: Denny Freeman, Stan Hong, A. J. Aranyosi,
Rooz Ghaffari, Shirin Farrahi, and Jon Sellon for all their help over the years. I'd also like to acknowledge Natasha Guha and Collin Kaufman for their help with ex-periments and experimental setup. Finally, I'd like to acknowledge everyone that has helped me along the way, including my friends and family.
Contents
1 Introduction 17
1.1 The mammalian cochlea . . . .. 19
1.1.1 Cochlear anatomy . . . . 19
1.1.2 Effects of sound . . . . 19
1.1.3 Cochlear amplification and sensitivity . . . . 20
2 DOCM/DOCT Methodology 25 2.1 Introduction . . . . 25
2.2 DOCM /DOCT ... 26
3 Tectorial membrane electrokinetics 31 3.1 Introduction . . . . 31
3.2 Results and Discussion . . . . 33
3.3 C onclusions . . . . 44
3.4 M aterials and Methods . . . . 44
3.4.1 Isolated TM Preparation . . . . 44
3.4.2 Microaperture Chamber . . . . 45
3.4.3 Measuring Fixed Charge Density cf . . . .. . . . . 45
3.4.4 Measuring Electrokinetic Motion of the TM . . . . 47
3.4.5 Motion Analysis with Computer Vision System . . . . 47
3.4.6 Motion Analysis with Doppler Optical Coherence Microscopy. 47 3.5 Supplemental DOCM results . . . . 48
4 Cochlear morphology
4.1 Methods . .... . .. . . . .. .... . .. .
4.1.1 In situ preparation . . . .
4.1.1.1 Animal preparation . . . .
4.1.1.2 Health . . . . 4.1.1.3 DOCM optical methods . . .
4.1.2 Image intensity resolution . . . . 4.1.3 Image spatial resolution . . . .
4.1.3.1 Scanning apparatus radial and 4.1.3.2 Optical axial spatial resolution 4.2 Results and Discussion . . . .
4.2.1 In situ apical Mongolian gerbil . . . . . 4.2.2 In situ apical mouse . . . .
4.2.3 In situ apical guinea pig . . . .
axial
spatial5 Sound-induced axial motion in the apex of the mammalian inner ear 69
5.1 Methods ... ...5.1.1 In vitro preparation . . . .
5.1.1.1 Animal preparation . . . . .
5.1.1.2 Health . . . .
5.1.1.3 Stapes-driven excitation
5.1.1.4 DOCM optical methods
5.1.2 In vivo preparation . . . .
5.1.2.1 Animal preparation . . . . .
5.1.2.2 DOCT Optical alignment .
5.1.2.3 Acoustic sound delivery and
5.1.2.4 Health/Viability . . . .
calibration
5.2 Results . . . .
5.2.1 In vitro stapes induced apical mechanics . . . .
5.2.1.1 DOCM imaging and axial motion analysis
49 49 49 49 50 50 52 54 54 56 57 57 63 64 resolution 69 69 69 71 71 72 73 73 74 74 76 78 78 78 . . . .
5.2.1.2 Differential analysis . . . . 81
5.2.2 In vivo sound-induced apical mechanics . . . . 84
5.2.2.1 DOCT imaging and axial motion analysis . . . . 84
5.2.2.2 Frequency-dependent motion analysis . . . . 88
5.2.2.3 Differential analysis . . . . 91
5.2.2.4 Post-mortem axial motion and differential analysis 92 5.3 D iscussion . . . . 96
List of Figures
1-1 Overview of the mammalian inner ear . . . . 20
1-2 Outer hair cell motility . . . . 21
1-3 Effect of endocochlear potential on basilar membrane displacement in the base . . . . 22
1-4 Basal vs. apical sensitivity as a function of level and frequency . . . . 23
2-1 Comparison of LDV and DOCT/DOCM . . . . 27
2-2 Schematic diagram of DOCT/DOCM setups, Low NA and High NA DOCT/DOCM axial point spread functions . . . . 29
3-1 Electromechanical properties of the TM . . . . 33
3-2 Fixed-charge density of the TM . . . . 35
3-3 Microchannel setup with uniform electric fields applied radially to TM segm ents . . . . 36
3-4 TM electrically evoked motion in the microchannel chamber . . . . . 37
3-5 TM electrokinetic response . . . . 39
3-6 TM electrokinetics near hair cell ion channels . . . . 42
3-7 TM electrokinetic response with 50 Hz sinusoidal electric field at 1 kV/m 48 4-1 Inner ear of the Mongolian gerbil . . . . 50
4-2 In vitro preparation . . . . 51
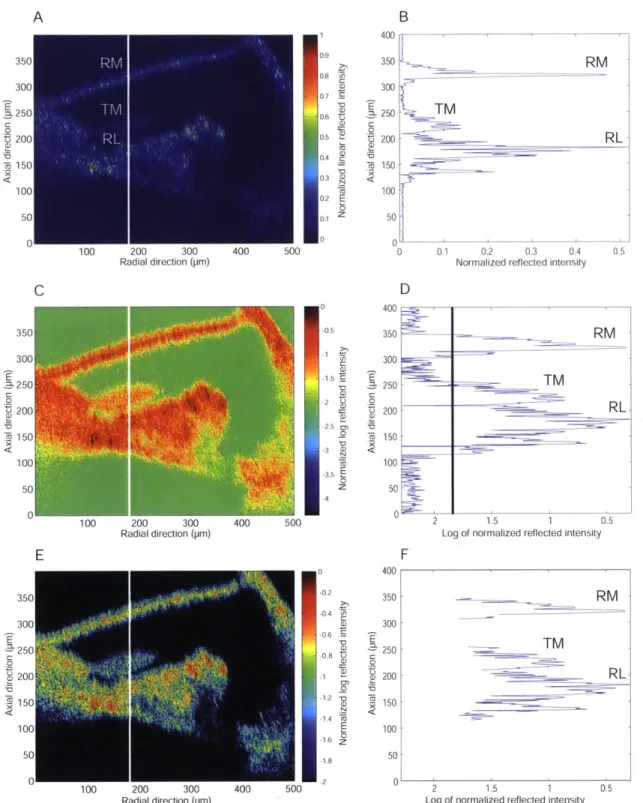
4-3 Cross-section of the organ of Corti in the apical turn of the in situ guinea pig cochlea . . . . 53
4-4 Low and high resolution cross-sectional images of an apical turn of the
in situ guinea pig cochlea . . . . 55
4-5 Cross-section of an apical turn of the in situ Mongolian gerbil cochlea 55 4-6 Low NA 10 x air objective imaging vs High NA 40 x water immersion objective im aging . . . . 57
4-7 Three in situ Mongolian gerbil apical cross-sections . . . . 58
4-8 Two in situ Mongolian gerbils with damaged Reissner's membranes 59 4-9 Low and high resolution In situ Mongolian gerbil preparation . . . . . 60
4-10 Comparison of anatomy in the in situ Mongolian gerbil apex . . . . . 62
4-11 In situ mouse structural comparison. . . . . 64
4-12 In situ guinea pig structural comparison. . . . . 66
5-1 Inner ear of the Mongolian gerbil . . . . 70
5-2 Stapes-driven in vitro stimulation . . . . 72
5-3 In vitro preparation . . . . 73
5-4 In vivo view of the bulla before surgical jaw removal . . . . 75
5-5 In vivo surgical and acoustic delivery setup . . . . 76
5-6 In vivo and post-mortem ASSR response . . . . 77
5-7 DOCM low resolution and high resolution images of an in vitro Mon-golian gerbil on a logarithmic intensity scale . . . . 79
5-8 DOCM interferometric signal processing in the in vitro Mongolian gerbil 80 5-9 DOCM image, axial motion magnitude and phase maps of the in vitro Mongolian gerbil in response to -90 dB equivalent SPL stapes stimu-lation at 450 H z. . . . . 81
5-10 DOCM axial motion magnitude and phase profiles through the Deiter's cells of an In vitro Mongolian gerbil . . . . 82
5-11 DOCM axial motion magnitude and phase profiles through the tectorial membrane of an In vitro Mongolian gerbil . . . . 83
5-12 DOCM axial motion magnitude and phase profiles through Reissner's membrane of an In vitro Mongolian gerbil . . . . 84
5-13 DOCM differential axial motion of an in vitro Mongolian gerbil . . . 85
5-14 DOCM differential axial motion histograms of an in vitro Mongolian gerb il . . . . 86
5-15 DOCM differential axial motion of an in vitro Mongolian gerbil . . . 87
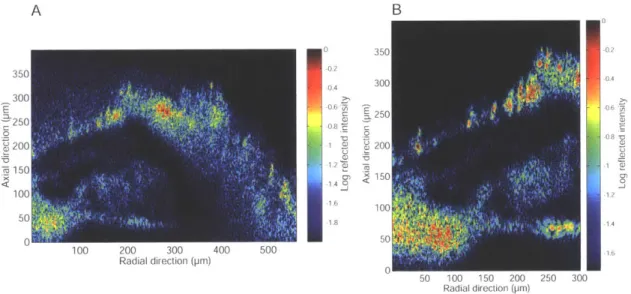
5-16 Comparison of high NA DOCM in vitro and low NA DOCT in vivo images of the apical organ of Corti in guinea pig . . . . 88
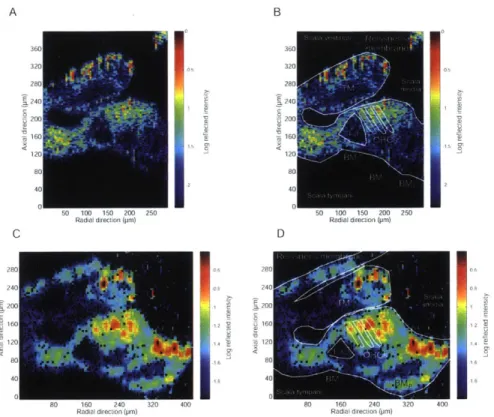
5-17 DOCT axial motion and phase maps of the apical in vivo guinea pig . 89 5-18 DOCM interferometric signal processing in the in vivo guinea pig . 90 5-19 Axial motion as a function of frequency at 3 radially separated positions along the reticular lamina in the in vivo guinea pig apex . . . . 91
5-20 Axial motion as a function of frequency at one position near the reticu-lar lamina of an in vivo guinea pig apex at varying sound level intensities 92 5-21 Level-dependent sensitivity and phase as a function of frequency in the in vivo guinea pig apex . . . . 93
5-22 In vivo apical guinea pig differential analysis . . . . 94
5-23 In vivo apical guinea pig differential histograms . . . . 95
5-24 Apical guinea pig post-mortem motion . . . . 96
5-25 Apical guinea pig post-mortem differential motion . . . . 97
List of Tables
4.1 Mongolian gerbil apical measurements compared to Edge et. al. [261 . 61
4.2 Mouse apical measurements compared to Keiler et. al. [591 . . . . 65
4.3 Guinea pig apical measurements compared to Teudt et. al. [1091 . . . 67 5.1 Differential axial motion of the OHCs compared to absolute axial motion100
Chapter 1
Introduction
The mammalian cochlea is a remarkable sensor. Using neural signals generated by the cochlea, humans can reliably detect sounds that cause motions of the stapes on the order of picometers - i.e., much smaller than the diameter of a hydrogen atom [114, 291. The cochlea performs high-quality frequency analysis of low-level sounds: Q10dB > 600 has been recorded for motions in the saline-filled cochlea of the
bat 166, 991. Furthermore, cochlear signal processing is profoundly nonlinear. One important nonlinearity is compression 1101, 97, 20, 77, 881. Humans detect sounds
differing in intensity over a 120 decibel range. This range of intensities is compressed as it is encoded for neurons with considerably smaller (20-50 dB) dynamic ranges. It is now widely accepted that an active mechanical amplification process driven by outer hair cells (OHCs) underlies these remarkable properties.
While information on the cellular and molecular basis of hearing is increasing rapidly
19,
36, 103, 5, 56, 311, there has been substantially less progress inunder-standing how these components interoperate to generate the remarkable properties of hearing, particularly at low frequencies, which are most relevant to speech signal pro-cessing. Currently, there is significant debate about the prevalent modes of motion, compressive non-linearities and tuning responses from the low frequency apical region of the cochlea [19, 62, 121, 95, 5]. In addition to potentially resolving fundamental debates in cochlear mechanics, the cochlear apex also provides several experimental advantages as a measurement target: i) larger cellular structures (e.g. outer hair
cells) relative to the base; ii) larger acellular structures (e.g. tectorial membrane)
relative to the base, and iii) time-based synchrony without low-pass filtering effects. Cochlear mechanical and auditory nerve studies in chinchilla, guinea pig, and cat cochleae have yielded contradictory results with important clues about the pres-ence of new modes of motion in the cochlear apex
[19,
62, 121, 80, 70, 49, 48,47].
Sound-induced motion measurements of the basilar membrane, tectorial membrane and reticular lamina in the apex may therefore further our understanding of low frequency signal processing of sound, and in particular, speech. In this thesis, we measure the cochlear morphology of in vitro cochlear preparations with Reissner's membrane intact, we measure absolute axial macromechanical motions of cochlear structures as a function of radial position in the in vitro and in vivo mammalian apex, and we assess relative cochlear motions of the basilar membrane, the tectorial membrane, and the reticular lamina as a function of intensity and frequency.
1.1
The mammalian cochlea
1.1.1
Cochlear anatomy
The mammalian cochlea, consists of three fluid-filled cavities: scala vestibuli, scala media, and scala tympani which spiral upward from the base of the cochlea toward the apex (figure 1-1). Scala vestibuli and scala tympani are filled with perilymph, a high Na+, low K + fluid, while scala media is filled with endolymph, a high K+, low Nat fluid. Scala media is isolated from scala vestibuli by Reissnerts membrane, a thin layer of epithelial cells, and from scala tympani by the reticular lamina, a system of tight junctions along a surface of the organ of Corti.
The organ of Corti (figure 1-1) consists of a variety of cells including inner and outer hair cells (which are separated radially by pillar cells), supporting cells, and the tunnel of Corti. Each inner and outer hair cell projects stereocilia into the sub-tectorial space, which lies above the reticular lamina and beneath the gelatinous, acellular structure called the tectorial membrane. There, it is generally believed that the stereocilia of the outer hair cells come into contact with the tectorial membrane (TM).
1.1.2
Effects of sound
Sound travels into the cochlea via the tympanic membrane (eardrum), which excites the three middle ear ossicles: the incus, malleus and stapes, located near the base of the cochlea. As the stapes is displaced, a traveling wave of pressure differentials between the scala vestibuli and scala tympani travels from the base of the cochlea towards the apex. This macromechanical pressure wave causes an axial displacement of the basilar membrane and organ of Corti, which is maximal toward the base for high frequency stimuli and toward the apex for low frequency stimuli (figure 1-1D). This displacement is thought to cause radial shearing of the hair bundles against the tectorial membrane, which allows transduction channels to open and current to flow from scala media to scala tympani via the outer hair cells.
Tectorial Membrane Reissner's
B
membrane Scala vestibuli c l ~ mediaOrgan of Corti Scala tympani Fawcett et al (1994)D
ni et al (1988) ,z TM S L A HB Basilar membrane Cochlea 'N Stapes p IHC BOHC BMV BM apex J baseFigure 1-1: (A) The turns of the mammalian inner ear (Image froi [51]) with the base and apex of the cochlea labeled. Reference directions are labeled. (B) Cross-section of a single turn jinset of (A)] with labeled fluid spaces: scala vestibuli, scala media, and scala tymnpani; and labeled structures: Reissner's membrane, the tectorial membrane, the organ of Corti, and the basilar membrane. (C) Drawing of a cross section of the organ of Corti linset of (B)]. The spiral limbus (SL), tectorial membralle (TM), inner hair cell (IHC), hair bundles (HB), basilar membrane (BM). and outer hair cell (OHC) are labeled. (D) Stapes-induced basilar membrane traveling wave
peaking axially near the apex along the stretched out length of the cochlea.
1.1.3
Cochlear amplification and sensitivity
Figure 1-2B illustrates a outer hair cell body with hair bundles protruding from the reticular lamina. Hair bundle deflection causes current from scala media to depolarize the outer hair cell. Outer hair cells respond to the change in transmembrane potential (VI) by expanding and contracting in length (L) and diameter
191.
The changes in length are thought to contribute to sensitivity increases found in the base of living cochleae by exerting a force on the cochlear partition and causing the hair bundles to deflect even more.20
A
A
HarrisotC
X M I.: dA
B
Hair cell
Current
Motion
Organ
of Corti
Mechanically-sensitiveion channels L (VA)
Ip
TM I50 mV SL L (V) -- B ---- BM IH V+
+
Membrane potential (adapted from Freeman)
Figure 1-2: (A) Cross-section of the organ of Corti with inset of an outer hair cell
(OHC). (B) The length (L) of an outer hair cell body is a function of its membrane
potential (VAt). Hair bundle radial deflection causes currents from scala media to de-polarize the cell causing an increase in Vlu and a subsequent decrease, or contraction, in the length of the hair cell.
In the living cochlea, transduction currents are much larger than a passive cochlea due to factors such as an endocochlear potential. In living mammals, the endocochlear potential is maintained at -80 millivolts through active processes, and exists in the endolymph filled scala media. Laser Doppler velocimetry experiments done by Rug-gero and Rich
1961
show that during furosemide administration, which causes a drop in endocochlear potential, the basilar membrane becomes much less sensitive and ex-hibits a linear input-output relationship in the base of the cochlea (figure 1-3). The apex (1000 Hz stimulus) was affected much less by the drop in endocochlear potential due to furosemide.The effect of cochlear amplification can be seen by looking at basal sensitivity curves (figure 1-4A), which normalize displacement with that of the stimulus sound pressure. The cochlear base shows a high degree of nonlinear displacement relative to
input sound pressure. Low sound pressure stimuli have a higher degree of displace-ment amplification relative to high sound pressure stimuli. In the apex, sensitivity
10000
E
1000
U0
100
10V..
10
30
50
70
dB SPL
90
110
Figure 1-3: Input-output curves for the response of basilar membrane L 14 to tones immediately preceding (solid line) and following (broken lines) an intravenous 50-mg
furosemide injection. Responses are shown for a CF tone (9 kHz. squares) and for a 1- kHz tone (circles). The abscissa indicates stimulus intensity (in dB SPL, i.e., referenced to 20 pPa). and the ordinate indicates peak basilar membrane velocity (in pm /sec). The time of data collection, in minutes relative to the furosemide injection, is indicated for each curve. Data were collected by means of laser velociietry. (Figure and caption from
196])
curves at low characteristic frequencies appear to be linear in comparison with the base.
L14
Befre
9000 Hz (CF)
-"
1000
Hz
112-118 11-19 - ."usror.
SEOUL
-A
10000.0 1000.0 ca 100.0 E 10.0 1.0 (.) 0.1 4 5 6 7 8 9 10 Frequency (kHz) Figure 1-4:B
10000 1000 E.'100 10 20Cochlear Apex:
i Chinchilla.(rt. 62): 9d3 SPL: 70--- 40 -- 30..- G a pi (at 413) Guinea pig (rot. 178i
Guinea pig (rot. 49)
0.1 0.5 1.0 2 3 4
Frequency (kHz)
(A) Basal sensitivity from the chinchilla
1981
and guinea pig1201
as a functioi of input sound pressure level and frequency. (B) Apical sensitivity of the reticular lamina as a function of input sound pressure level and frequency. Guinea pig (ref. 413) is reference11211
measures the organ of Corti through Reissner's membrane with LDV. Guinea pig (ref. 49) is reference119].
which measures with LDV. Guinea pig (ref. 178) is1631.
which measures the reticular lainina(Figures from
1951).
with coifocal interferometry.
Cochlear Base:
Chinchilla (Rgero et al)G
GP (Cooeret a - C 0 --. T-R --0-- 0 -v--- -0 so 90 somm
Chapter 2
DOCM/DOCT Methodology
This section is adapted from a paper presented at the Mechanics of Hearing conference in 2015 [831. Additional system information is available at the following reference [521.
2.1
Introduction
Despite extensive progress in measurements of cochlear mechanics over the past sev-eral decades, there are still basic phenomena that are not well understood. One reason for this lack of data has been due to the difficulties in measuring motions of structures within the cochlear partition of intact systems. The history of cochlear mechanics studies shows that new measurement tools lead directly to new discov-eries about cochlear function. Stroboscopic microscopy techniques pioneered by von B6k6sy demonstrated the mechanical frequency separation introduced by the cochlear traveling wave 11141. The later application of M6ssbauer methods 190, 1041, and subse-quent laser Doppler vibrometry (LDV) methods 181, 961, permitted measurements of the sharply-tuned, labile motions of basilar membranes in living cochleae [951. LDV techniques have further demonstrated the spatial extent of traveling waves on the basilar membrane in living cochleae 1101, 89, 951. Video microscopy and related gra-dient methods have allowed the observation of three-dimensional motions of multiple cochlear structures [24, 58]. These techniques have been successful in demonstrating the relative motions of structures in the mammalian cochlea. Both LDV and video
microscopy methods are now widely used and continue to provide valuable insights into cochlear function.
Despite their successes, current methods based on LDV and video microscopy have important limitations affecting their ability to study the cochlea as a system. For example, in video microscopy both lateral and axial resolutions are limited by the size of the opening made in the wall of the cochlea. To date, it has been impossible to obtain wide access (for high resolution) without significantly reducing the sensitivity of the cochlea. In LDV, axial resolution is typically limited to single highly reflective targets (either naturally occurring or artificially placed), which greatly complicates characterization of cellular processes in the organ of Corti (figure 2-1A). However, confocal LDV systems reduce the need for an artificially placed reflective target, as the axial depth from which light is collected is confined 1801.
As with optical coherence tomography (OCT), images constructed via Doppler optical coherence microscopy (DOCM) and Doppler optical coherence tomography
(DOCT) use optical range information and can be acquired using both high (DOCM)
and low (DOCT) numerical aperture access 1821. These systems utilize the Doppler shift caused by the motion of scattering structures to measure displacement as a func-tion of depth into the tissue. This novel combinafunc-tion of LDV and OCT measures sub-nanometer displacements of weakly scattering structures within the cochlear partition using fiber-based gradient index (GRIN) lenses, air objectives, and water objectives
[117, 118, 52, 16, 13, 371.
2.2
DOCM/DOCT
LDV is built on the principle of the Michelson interferometer (figure 2-1B). Reflected light scattered from a coherent beam incident upon a sample is mixed with a reference beam to produce an interference pattern which can be measured at a photodetector or at a spatial plane. The detected signal consists of constructive and deconstructive interference. With a coherent source, the interferometric pattern sums light scattered from multiple depths (figure 2-1C). Reflective beads are thus typically used as targets
B TM lHC TOC OH s BM Bead E
/
~I~
/ I / \ Scanned Reference Path Ught Sample Source Beam Splitter Detector C z Coherent light F AOM I L OL sL F1 jBE BSD MOM: Short coherence length light
Figure 2-1: Comparison of LDV (A-C) and DOCT DOCM (D-F) image and motion measurement techniques. (A) In LDV, the target is illuminated with light from a laser source. A reflective bead is often used to ensure a single point of reflection. (B) Schematic diagram of a Michelson interferoinetry setup showing the source split into a sample and reference path. Motions of the target modulate the optical path length and are neasured by recombining the backscattered light with light from a reference path. (C) Interference pattern as a function of axial position ( z) for a co-herent light source. commonly used in LDV. Abbreviations: IHC inner hair cell, TM - tectorial membrane., TOC tunnel of Corti, (HCs - outer hair cells, BM basilar membrane. (D) In DOCM DOCT, light with a short coherence length is
used to distinguish reflections from different optical depths. This technique renders
a cross-sectional image of all visible structures, inchiding cellular and acellular struc-tures. (E) Schematic diagran of heterodyne (dashed box) DOCM, DOCT systems. (F) Interference as a function of the difference in optical path length (z) for a low co-herence light source. commonly used in DOCT DOCM. A/, represents the full width
at half maximum (FWHM) of the interference signal and defines the coherence gate. Abbreviations: SLD - super luminescent diode., BS - beam splitter, PD - photode-tector, AOM acousto-optic modulator. BE - beam expander, RL -- relay lens, DM dichroic mirror., TL tube lens. CCD charge-coupled device. OL objective
lens, R retroreflector.
S
sample.27
I
A z -j 0 r') D zto isolate the motion measurement to a specific plane.
The DOCM/DOCT system, previously described by Hong, et al. 1521, uses a low coherence source to optically section tissue (figure 2-1D) and is based on a Michelson interferometer in a double-pass configuration (figure 2-1E). The source has a center wavelength (Ao) of 841 nm and a bandwidth (AA) of 47.8 nm. Acousto-optic modu-lators (AOMs) modulate the sample path at 80 MHz and the reference path at 80.25 MHz generating a 500 kHz heterodyne signal which allows for directional phase dis-crimination. DOCT and DOCM utilize a low coherence source to limit constructive interference to a small matched path length, typically less than 20 Pim. An ideal low coherence source with a Gaussian spectrum yields an axial coherence gate (AWl), which is defined as the full width at half maximum (FWHM) of the interferometric
signal (figure 2-1F), and described by the following:
Alc =
21n(2) A
02 (2.1)7r A A
The coherence gate can be used to optically section throughout tissue. Center fre-quencies of low coherence sources typically range from 800 nm to 1600 nm, while source bandwidth varies from approximately 20 nm to 300 nm.
DOCT utilizes a small numerical aperture (NA) objective or fiber-based GRIN
lens to increase the depth of focus, while using the coherence gate to optically section (figure 2-2A). Scattered light is collected throughout the depth of focus, yet only light which matches the path length of the reference arm contributes to the interferometric signal. The interferometric point spread function generated by axially imaging a plane approximates the axial resolution as the FWHM of the convolution of the coherence gate with the plane (figure 2-2B).
In contrast, DOCM uses a high NA objective to confocally restrict the collected scattered light axially within the depth of focus (figure 2-2C). As a result, the point spread function (figure 2-2D) demonstrates a finer axial resolution than that achieved with a low NA coherence gated system. DOCM also has a better lateral resolution when compared to DOCT as a result of its higher NA, according to the following
DOCT Objective (low N.) -I Lateral resolution Dx DOCM Objective (high N.A,) - . Lateral resolution Dx B 1.0 0.8 o0.6 0.4 E <0.2 01 -1 D 1.01 0.8 -0 '-0.6 0.4 E <0.2 0
Point spread function (axial)
0.13 NA
-5 -10 -5 0 5 10 15
Axial distance (mm)
Point spread function (axial)
0.8 NA
15 -10 -5 0 5 10 15
Axial distance (mm) Depth of fOcLIS
Figure 2-2: (A) Schematic diagram
lighting large depth of focus (blue),
(arrows). (B) Low NA DOCT axial
of DOCT setup with low NA objective high-coherence gate (orange), and lateral resolution point spread function determined by coherence
gate (orange). (C) Schematic diagram of DOCM setup with high NA objective
high-lighting small depth of focus (blue), coherence gate (orange), and lateral resolution (arrows) (D) High NA DOCM axial point spread function determined by depth of focus (blue).
relationship:
Ax = 0.3 7
A
N A (2.2)
where Ax is the FWHM of the lateral point spread function, and is inversely propor-tional to NA.
Although the axial and lateral image resolutions of DOCM are both enhanced with respect to DOCT, the high NA objectives used have comparatively larger diameters and shorter working distances which make it difficult to gain optical access in tight spaces. DOCT systems have longer working distances and smaller fiber/objective diameters, allowing for easier access to the cochlea in situ.
A
0
0
C
Lateral scanning of the target under the sample path is accomplished using linear stepper motor stages, while transverse scanning is more quickly accomplished by moving the sample objective and reference retroreflector together on a piezoelectric scanning stage (Physik Instruments). The sample path contains a beam expander to maximize the area of light incident on the objective, while the reference path utilizes relay lenses to correct for angular dispersion caused by the AOM. The interference signal, as well as a 250 kHz reference signal, is sampled by a 12-bit A/D card at 5 MS/s via a photodetector.
Motion measurements can be obtained by measuring the instantaneous phase of the heterodyne interference signal. This is an indicator of the change in path lengths between the sample and reference arms. The complex axial displacement can be determined by
1
d(n) = O#(n) (2.3)
2kn
where k = 27r/A, ii is the refractive index, and O(n) is the difference in the Hilbert transform of the instantaneous phase from the heterodyne interference and reference signals.
O(n) = tanl
(H[V-et(n)]
2 tan-H[Vr;f
(n)] (2.4)Chapter 3
Tectorial membrane electrokinetics
This chapter is adapted from a published manuscript [441. My contributions to the published manuscript include the experimental design, measurements, and analysis of results obtained from Doppler optical coherence microscopy.
3.1
Introduction
The mammalian cochlea is a remarkable sensor capable of detecting and analyzing sounds that generate subatomic vibrations 1661. This extraordinary sensing property depends on mechano-electrical transduction of cochlear hair cells
154,
55], which arefunctionally classified as inner and outer hair cells (OHCs). Both types of hair cells project stereociliary hair bundles from their apical surface towards an overlying extra-cellular matrix called the tectorial membrane (TM). Because of its strategic position above the hair bundles, the TM is believed to play a critical role in bundle deflection. Recently, genetic studies have confirmed the importance of the TM in hair cell stim-ulation by highlighting how mutations of TM proteins cause severe hearing deficits, even when the TM and its structural attachments appear to be normal under electron
microscopy 168, 69, 100, 107, 751.
Despite significant evidence establishing the importance of the TM in normal cochlear function, relatively little is known about the TM's basic physicochemical properties and mechanistic role. Historically, models of cochlear function have
repre-sented the TM as a stiff lever with a compliant hinge, a resonant mass-spring system, or as an inertial body 125, 21, 7, 78, 79, 1, 123, 721. However, these models exclude important phenomena, such as longitudinal coupling [122, 42, 76, 43], and assume that only mechanical properties of the TM are important. It is now clear that the TM is a biphasic poro-elastic tissue
174],
which manifests longitudinal coupling in the form of traveling waves 142, 76, 43J.Furthermore, TM macromolecules comprise not only mechanical constituents [74,
38, 46, 94, 92, 391 such as collagen fibrils, but also charged constituents such as
glycosaminoglycans (GAGs), which could affect mechanical properties (Fig. 3-1)
134,
73, 67, 112, 93, 111, 110, 11, 651. GAGs in the TM carry sulfate (SO3~) and carboxyl
(COO-) charge groups, which are fully ionized at physiological pH and neutralized at
acidic pH values (pKs between 2-4)
1341.
In contrast, the net charge on TM collagen constituents is small at physiological pH because the net charge of amino (NH3+)and carboxyl groups is zero. The density of TM charged macromolecules has been previously inferred from pH dependent volume measurements of the TM [116, 33, 1151. Although consistent with a gel model of the TM, estimates of charge density based on changes in volume are indirect and deviate from model predictions at low pHs [1151.
More direct electrical recordings are thus required to determine the net charge of TM constituents and to determine whether this amount of charge is sufficient to generate electromechanical behaviors, of the type reported in other connective tissues, such as
cartilage
145,
32, 1061.Fixed charge plays a key role in determining the functional properties of car-tilage. For example, nearly half of the load-bearing stiffness of cartilage has been attributed to electrostatic repulsion 1111. In addition, mechanical strain produces electrical responses (e.g., streaming potentials [65]) and electrical stimulation can lead to mechanical deformations by a process referred to as electrokinetics [45, 32]. The similarity between the structure and composition of the TM and those of other connective tissues suggests the possibility that charge could play a similarly important role in the function of the TM [34, 731.
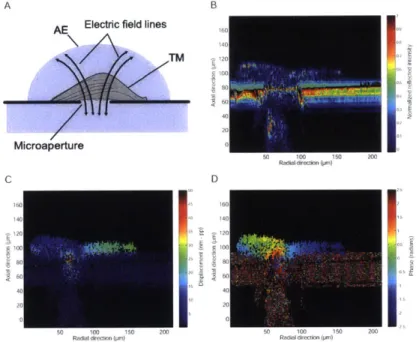
TM External pressure External pressures resisted by: Mechanical forces Electrostatic repulsion of fixed charge
Figure 3-1: Electromechanical properties of the TM. Schematic drawing of the TM showing negative fixed-charge constituents attached to a network of iechan-ical springs (collagen fibers). In response to external pressure, the negative fixed charge and collagen fibers resist compression through electrostatic repulsion effects
and mechanical forces. respectively.
fragile structure of fresh, excised TM segments to i) measure the fixed charge density of the TM, and ii) apply oscillatory electric fields at audio frequencies to the TM. Using these novel methodologies. we demonstrate electrokinetic phenomena elicited
by the presence of fixed charge. and suggest implications for hearing mechanisms.
3.2
Results and Discussion
To determine the fixed charge concentration of the TM, we recorded the electrical responses of the TM using a nicroaperture chamnber in a patch clamp configuration
(Fig. 3-2: see Materials and Methods). The voltage measured between the baths represents the sunm of the junction potentials at two TM surfaces (Fig. 3-2A and B): one bathed in artificial endolyviph (AE). and one bathed in a test solution. KCl
concentration in the test solution was systematically altered to modulate the adja-cent
junction
potential via changes in charge shielding. The resulting measurements were well fit bv a rmodel based on the Donnan relation (see Materials and Methods), and provided an estimate of fixed charge density cj of -7.1 2.0 ininol/L atphys-iological p11. and 3.0 nmnol L at pH 3.5 (Fig. 3-2C). These results are consistent with predictions based on biochemical composition studies
1341.
The net charge of approximiately 7.1 imnmol L at physiological J)II is large, representing 1 fixed chargemolecule for every -25 cations in endolymph.
To determine the mechanical contribution of charge in the TM, we analyzed a macrocontinuum model based on stress-strain relation and Donnan equilibrium
134,
1061. Internal pressures that arise from mechanical and electrostatic mechanismsresist external pressures on the TM (Fig. 3-1). The mechanical component is propor-tional to changes in TM volume and can be expressed as
Pmech - V (3-1)
where pmech is the hydraulic pressure, K is the bulk modulus, V is TM volume, and Vo is the volume in the absence of a hydraulic pressure. The electrostatic component depends on the concentration of fixed charge in the TM, which tends to concentrate mobile counterions to maintain electroneutrality. This concentration of counterions increases the osmotic pressure (peec) in the TM and can be expressed as
Pelec RT ( C2 - C) (3.2)
where R is the molar gas constant, T is absolute temperature, and C represents the concentration of monovalent ionic species (KCl) in the bath. This model predicts that electrostatic repulsion due to the -7.1 mmol/L of fixed charge density can contribute up to 0.35 kPa to the equilibrium bulk modulus K, accounting for approximately 70% of compressive rigidity of the TM at equilibrium [741. Under dynamic conditions, the contribution of charge to mechanical properties is also important. A recent study found that a shift to acidic pHs in the bath causes a -2-3x reduction in dynamic shear impedance of the TM [271. The density of charge in the TM is thus sufficient to be the basis of mechanical properties under both static and dynamic conditions, a
striking finding, given the fact that the TM is highly hydrated
134,
67, 1121.The presence of charge in the TM suggests the possibility that electrical stimuli could generate a mechanical response
140,
411. The application of oscillating elec-tric fields at audio frequencies (1-1000 Hz) directed along the transverse axis of the TM in the microaperture chamber (Fig. 3-5A) generated displacements of the TMA Objective TM Slide glass Test bath --- + Microfluidic channel Microaperture B VI)+ -Test bath Microfluidics substrate AE TM Microaperture Side view VB VD VT tB VT Top view 1senks tripe Marginal edge 30 pm C 3- 0--c -0 -5-pH 3.5 pH 7.3 I ' ' I ' ' ' I ' ' 0 100 200
KCI Concentration (mmol/L)
Figure 3-2: Fixed-charge density of the TM. ( A) Schematic drawing of the
ture setup showing side views of an isolated TM positioned over a circular
microaper-ture. (Left) The microaperture creates a fluid path from the overlying bath of AE to the underlying nicroflluidics channel (test bath) perfused with AE-like solutions with variable IKCl concentrations. (Right) The TM acts as an electrocheincal b1arrier between the overlying bath and underlying fluid channel. The potential difference between the baths (6 =1% -V s) was recorded with Ag AgCl electrodes that were
placed in contact with the two baths. (B) Schematic drawing of the microapertu1rc setup showing the top view of the TM positioned over the microaperture in the re-gion near Hensen's stripe and the marginal zone. (Inset) TM segment overlying the incroaperture using 40 x magnification. (C) Voltage was plotted as a function of test bath KCl concentration. Best-fit estimates to the median voltages yielded cf (-7.1
2.0
nunol
L; n 5 TM preparations). Vertical lines and boxes denote extreme valuesand the extent of the interquartile range, respectively. Horizontal lines through the boxes denote the median values. Reducing the bath pH from 7.3 to 3.5 caused voltage measurements to change polarity and decrease in magnitude (3.0 mmol;L).
Microscope (40x) Artificial endolymph Microchannel TM E- marginal -0). TMT C Ag/AgCl electrodes 2radial Voltage stimulus -A 50 pm longitudinal
Figure 3-3: Microchannel setup with uniform electric fields applied radially to TM segments. (A) The TM was positioned between two application electrodes in the
nicrochannel and observed optically at audio frequencies with stroboscopic illumina-tion. (B) Magnified side view of the TM in the mnicrofluidics channel, showing uniform electric fields directed radially. (C) Light microscopic image of a TM segment in the microfluidics chamber, highlighting the orientation of the TM marginal and limbal
boundaries relative to the applied field.
near the marginal zone and Ilensen's stripe (n - 4 TM preparations) (see SI Movie
-H 1). Figure 3-53 shows that TM displacements had peak aimplitudes of 50 nim in
response to 8 kVin m (at 10 Hz) at a position on the undersurface of the TM above the nicroaperture. Displacement amplitudes dropped significantly with distance away from the microaperture (Fig. 3-53), increased with electric field strength (Fig. 3-5C)., and decreased as a function of stimulus frequency with the phase angle approaching
T 2 radians (Fig. 3-5D). consistent with viscous dominated interactions. Similar motion behaviors were reproduced in a microfiidics chamber used to apply radial electric fields (SI Materials and Methods; Movie #2; Fig. 3-3). Using this chamber. we ineasured the frequency response of the TM at very low frequencies (1--80 Hz) and exposed the T-M to different perfusates in the microchannel environment. Perfusion of AE equilibrated at pH 3.5 led to a -w radians shift in phase angle (Fig. 3-4A). indicating ionization of positively charged collagen groups [115] and neutralization of negatively charged GAGs.
The frequency dependence of TM displaceiient magnitude and phase (Fig. 3-5D, Fig. 3-41) suggests an interplay between electrophoretic forces on the solid matrix
UEM-Stimulus: 3 kV/m, 1 Hz pH 7.3 0~ 0 + pH 3.5
B-E
C E C) .Cn 5) 0Stimulus phase (radians)
1000 100 10 0-.c CL
-7r/2--IT --i 0 Stimulus: 5 00O% kVfm O0%~j 0 0
1
OPg0.1
Stimulus: 1.5 kV/m, 1 Hz 0AE+PEG(400kDa) + AE + PEG (8 kDa) AE (initial) 1 10Frequency (Hz)
. ,Stimulus phase (radians)
Figure 3-4: TM electrically evoked motion in the microchannel chamber. (
imotion ineasired in AE equilibrated at pH 7.3 vs. )Hl 3.5. (Stimulus: 3 kV,
Hz.) (B) Frequency response of TM motion showing the nagnittide decreasing with frequency and phase approaching 7/,2. (C) TM motion in the microchannel perflised
with AE, AE mixed with small PEG molecules (8 kDa), and AE mnixed with large
PEG molecules (400 kDa). (Stinmulus: 1.5 kVIi at 1 liz.)
A
EE
-a900-
-900-0C
200-,
E C a) E 'a if) 100 0--200-6
A) TM
in at 1 .~~ . r2and electro-osmotic forces on interstitial fluid (which carries a charge that is equal in magnitude but opposite in polarity to the fixed charge on TM macromolecules)
[321. At low frequencies, these forces displace the fixed charge groups attached to the
elastic matrix of the TM to generate displacements, which scale with field strength and the radius of the microaperture [113]. However, this process is viscosity limited (Fig. 3-5D), due to the small size of the pores [741. Therefore, as the frequency of the electrical stimulus increases, there is less time per period for fluid motion through the porous matrix, and a proportional reduction in total fluid transport. The result is that electrokinetic displacements of the TM are larger at low frequencies than at high frequencies.
For asymptotically low frequencies, the solid and fluid phases separate, and elec-trokinetic displacements result from electrical forces acting on fixed charges embedded in the elastic matrix. To estimate the magnitude of these displacements, we modeled the TM as a semi-infinite, isotropic, elastic matrix, which overlies a circular aperture
(25 pm diameter) through which current is passed. The mechanical properties of
the matrix were represented by Young's modulus (-105 Pa for a basal TM segment)
142,
461. The matrix was assumed to have a uniform electrical resistivity (0.3 Qm) and fixed charge density q (-7x10⁵ C/M3), determined from the measurements inthis study (cf -7 mmol/L; Fig. 3-2). The equations of motion were solved using finite
differences (SI Results), with the result that electric fields of 1 kV/m (generated by -2 pA of current) produced electrokinetic displacements on the order of 1.5 ,am. This motion estimate is based on a quasistatic model of the TM, which is appropriate at asymptotically low frequencies. However, the motion measurements in Fig. 3-5D show strong frequency dependence of motion (with slope of -1) over the measured range of frequencies (which is limited at low frequencies by table vibrations and thermal drift). We expect the trend shown in Fig. 3-5D to continue (to lower frequencies) until the transition to quasistatic behavior occurs, at frequencies that correspond to the poroelastic relaxation time (which is on the order of tens of minutes, based on
previous osmotic experiments [74, 341). Thus the transition frequency is 2-3 orders
A B
E-AE Electric field lines radians H
Marginar ____ If a dge Glass slide Microaperture C l 150 Hz +1 E 0 4 8 12 16 20 E
Electric field (ky/rm) o Stimulus: 15 kV/m
CDU 10 + 10 H 101 -0CL 0 121 .CU cc CO -7 40 io0 10i Frequency (Hz)
Figure 3-5: TM electrokinetic response. (A) The microaperture setup was used to deliver electric fields to the TM with a pair of Ag; AgCl-stiimulating electrodes. Elec-trically evoked displacements were ineasured using computer microvision and DOCM systems (Matcrials and Methods). Voltages were delivered with Ag, AgC1l electrodes
positioned in the top bath and in a reservoir connecting to the underlying fluid chan-nel. Electric fields were computed based on the geometry of the microaperture., and electrical current was measured across a resistor that was placed in series with the mli-croaperture chamber during voltage application. (B) Transverse displacements were sinusoidal and largest in the regions of the TM directly overlying the microaperture
and decreased with radial distance away from the microaperture. A typical TM
seg-ment excised from the middle turn exhibited electrically evoked displaceseg-ments up to 45 nm in response to electrical stimuli applied in the middle zone region directly overlying the microaperture (10 Hz: 8 kV;'m). Motion amplitudes varied depending
on whether the TM sample was a basal or an apical segment. (
Q
Displacements scaled linearly with electric field magnitude for TM samples excised from the middle turn of the cochlea (n - 4 TM preparations). (D) ( Upper) Displacement amplitudes decreased with increasing stimulus frequency (40 1,000 H4z) with a slope of 1 (solid line) for a typical apical TM segment. Black (lots denote the mean value of TM displacement. (Lower) Phase angle of TI displacement as a function of frequency. Vertical lines with horizontal bars (ellote SEM.motion estimate to be 2-3 orders of magnitude larger than the measured range of motions.
Under dynamic conditions, viscous forces increasingly couple electro-osmotic and electrophoretic forces, which are equal in magnitude but opposite in direction. To test the effect of pore size and interstitial fluids on TM electrokinetics, we measured TM motion in response to changes in viscosity by introducing different size PEG molecules in AE (SI Results and Materials and Methods). We altered the viscosity of the fluid surrounding the TM by perfusing AE mixed with large PEG molecules (10 pmol/L, 400 kDa), which could not penetrate the TM. To alter internal viscosity of the TM, we perfused AE mixed with small PEG molecules (10 mmol/L, 8 kDa), whose ra-dius of gyration was sufficiently small to enter through TM nanopores [741. Adding small PEG molecules caused TM motion to decrease by -6.5x, whereas, adding large
PEG molecules caused relatively minor changes in TM motion (Fig. 3-4C).
Chang-ing internal viscosity of the TM is functionally equivalent to reducChang-ing TM pore size, suggesting a strong dependence of TM electrokinetic interactions on effective poros-ity and a weak dependence on external viscosporos-ity of the surrounding fluid. These results provide a framework for a general poroelastic model of the TM under both quasi-static
174]
and dynamic conditions, thereby highlighting the important inter-play between fixed charge groups, porosity and the internal water content of the TM at the nanoscale. Electrically-evoked displacements of the TM may have important implications for electrical stimulation of the cochlea 1119, 102, 12, 80, 58]. Mechanical responses to electrical stimulation have generally been attributed to OHC somatic and hair bundle motility mechanisms. While exogenous application of electrical currents undoubtedly excites sensory receptor cells, our results suggest that electrically in-duced TM motions must also be taken into account if electrical currents flow through the TM. Thus, electrically-evoked motions of the cochlear partition may be at least partially stimulated by TM electrokinetics, especially at low audio frequencies. Elec-trokinetic properties of the TM could interact directly with hair cell ion channels. Although the exact position of hair cell transduction channels relative to the TM re-mains unclear, it is well known that the undersurface of the TM is in close proximity(nanometer-scale separation) to the tallest rows of stereocilia
153,
30, 6]. Figure 3-6Aand B shows the TM-hair bundle interface and highlights how transduction currents, driven predominantly by potassium and calcium ions, generate electric fields, which in turn, could exert local force on TM macromolecules. Although it is unlikely that transduction currents generate bulk movements of the TM in vivo, it is possible that local electrically induced deformations of the TM could occur near single stereocilia ion channels.
A previous study of electrical recordings from the bullfrog's sacculus found electric
field magnitudes of ~1 V/m at distances ~1 Pm from the tips of the stereociliary hair bundles containing clusters of ion channels (51). These electric fields depend not only on the magnitude of the current but also on the spatial proximity of the TM relative to the ion channels. If we assume -20 pA transduction currents through a solitary ion channel [28, 57] and a distance of -1 pim from the channel opening, the electric fields would be in the range of those measured by Hudspeth (labeled 'Ref.
51' in Fig. 3-6C [53]). However, as the distance to the ion channel is decreased, the field strength increases rapidly. For example, at distances within 7-30 nm of an ion channel, the field strengths are 103-104 V/m, similar to those applied in the microaperture chamber (labeled 'This study' in Fig. 3-6C). Electrically-evoked TM motions and forces produced by transduction electric fields depend on the material properties of the TM as well as the channel geometry. If we assume that a solitary ion channel is modeled as a single nanopore, then we can estimate the magnitude of TM displacements by scaling the measurements in the microaperture setup (Fig.
3-5). TM motion in the microaperture setup under quasistatic conditions (dft -1.5
pm) is proportional to the applied electric field strength (E, -103 V/m), where the
proportionality constant is the effective charge (q,) divided by TM stiffness (ku). The stiffness k,, scales with the radius of the microaperture 11131 and is therefore -104 smaller near an ion channel (-1-nm radius), whereas the quantity of charge q, scales with the volume of the TM overlying the microaperture. As a result, the proportionality between dp and El, changes by a factor of 108 for a single ion channel relative to the microaperture. On that basis, we predict TM displacements (dch)
A
TM
Outer hair cell
C
-0 U) z a.)4-
105-10
4 103 10210
1 iThis
stud
B
* jS .. -- --- -- --- -Ref. 5110
100
1000
Distance (r) from ion channel (nm)
Figure 3-6: TM electrokinetics near hair cell ion channels. ( A) Schematic drawing of a cochlear partition showing the orientation of the TM relative to OHC stereocilia and tip links.
(B)
Inset shows theOHC
ion channel as a point source with radial electric fields (blue arrows) acting on TM fixed-charge inacroniolecules locally over small distances r.(
C)
Model predictions of electric field magnitudes as a function of radial distance r from the opening of the ion channel. Electric fields were estimated based on experimental values for single-channel transduction currents, resistivity of the ionic environment, and the radis of the ion channel from previous data153.
30, 6, 28. 57J.The shaded region labeled "This study" denotes the range of electric field (103 101 V in) magnitudes applied in the inicroaperture chamber with values corresponding to -7-30 nin from the ion channel opening. The shaded region labeled "Ref. 51" denotes electric fields ( 1 V ii) measured at 1 p..mi from the tips of hair bundles in
the bullfrog's sacculus 153]. In 1oth cases, radial distances r are significantly larger than the TM's space charge layer thickness
1111.
near an ion channel to be
-0.01
nm in response to Ech adjacent to a nanochannel (Fig. 3-6C). Because the electric field strength depends linearly on the number of stereociliary channels, the aggregate TM motion for -75 channels (dhb) for a given hair bundle would be -0.75 nm. TM displacements at the ion channel and bundle level scale linearly with electrical current I (SI Results). This linear dependence of TM motion on electrical current is consistent with a finite difference model (SI Results), which predicts TM motion estimates on the order of those based purely on scaling. The total mechanical energy available from TM electrokinetic motions (SI Results) is the product of dhb2 and TM stiffness (kTM ~1.33 N/m for a basal TMsegment over a 5-btm radius)
142,
46, 1131, yielding -0.75 aJ for basal TM segments and on the order of -7.5 aJ for apical TM segments with lower stiffness (kTM -0.13 N/m for an apical TM segment over a 5-tm radius)142,
46, 1131. These energy estimates are comparable to the amount of work needed to deflect hair bundles during calcium-driven bundle motility (-2 aJ) and are significantly larger than the work performed against viscosity during bundle movements (-0.1 aJ)115,
81, suggestingthat electrically-evoked motions of the TM could interact with mechano-electrical transduction (MET) currents of the hair bundles. The direction of TM motion and the associated feedback mechanism at the level of the hair bundles depend on the location of the MET channels. If the ion channels face towards the inhibitory direction of bundle motion (i.e. if they are on the side that is closest to a shorter stereocilia), the net electric field that is caused by opening the channels will generate a force that will tend to close the channels, consistent with negative feedback. If, on the other hand, the ion channels face towards the tallest stereocilia (as in Fig. 3-6B), the net electric field would force TM negative charge groups in the direction of positive bundle deflection to open more ion channels, as the basis of a positive feedback mechanism for amplification.
Beyond cochlear mechanics, our findings have important implications for all sen-sory systems, which (with the exception of a few species of lizards) all contain ac-cessory gelatinous structures overlying hair cells. Gels, like the cupulae and otolithic membranes found in the vestibular system, and those covering electrosensory hair cells
![Figure 1-1: (A) The turns of the mammalian inner ear (Image froi [51]) with the base and apex of the cochlea labeled](https://thumb-eu.123doks.com/thumbv2/123doknet/14349948.500726/20.918.138.755.134.561/figure-turns-mammalian-inner-image-froi-cochlea-labeled.webp)