Approaches to Education Market Design
by
Yusuke Narita
Submitted to the Department of Economics
in partial fulfillment of the requirements for the degree of
Doctor of Philosophy in Economics
at the
MASSACHUSETTS INSTITUTE OF TECHNOLOGY
June 2016
-MASSACI4U$ES KIS717UTE OF TEg HNOLGYJUN 10 2016
LIBRARIES
ARCHIVES
@
Yusuke Narita, MMXVI. All rights reserved.
The author hereby grants to MIT permission to reproduce and to distribute
publicly paper and electronic copies of this thesis document in whole or in
part in any medium now known or hereafter created.
Signature redacted
A uthor...
Certified by ...
. . . .. .. .. .. ... ... ...Department of Economics
May 13, 2016
Signature redacted
Parag Pathak
Professor of Economics
Thesis Supervisor
Accepted by.Signature
redacted
.--..-.--..---
Ricardo Caballero
Ford International Professor of Economics
Chairman, Departmental Committee on Graduate Studies
Approaches to Education Market Design
by
Yusuke Narita
Submitted to the Department of Economics on May 13, 2016, in partial fulfillment of the
requirements for the degree of Doctor of Philosophy in Economics
Abstract
This thesis consists of essays about how to improve education markets through analyzing data generated by such markets. In chapter 1, I start with looking at how families decide which school to attend in a school choice system. Though such systems are designed assuming that families make well-informed choices upfront, I use data from NYC's high school choice system to show that families' choices change after the initial match as they learn about schools. I develop an empirical model of evolving demand for schools under learning, switching costs, and demand responses to prior assignments. The estimates suggest that there are even more changes in underlying demand, undermining the welfare performance of the initial match. To alleviate the cost of demand changes, I investigate dynamic mechanisms that best accommodate choice changes. These mechanisms improve on the existing discretionary reapplication process. In addition, the gains from the mech-anisms dramatically change depending on the extent of demand-side inertia caused by switching costs. Thus, the gains from a centralized market depend not only on its design but also on demand-side frictions (such as demand changes and inertia).
In chapter 2, I turn to education production after students start attending schools. In centralized school admissions systems, rationing at oversubscribed schools often in-volves lotteries on top of preferences of students and schools. This random assignment is extensively used by empirical researchers to identify the effect of getting in a school on outcomes such as test scores. I theoretically study whether a popular empirical research design extracts a random assignment as intended, providing a condition under which the research design successfully extracts a random assignment.
Chapter 3 (with Atila Abdulkadiroglu, Josh Angrist and Parag Pathak) considers the complementary question of how best to use the lottery-generated variation for im-pact evaluation. We develop easily-implemented strategies that fully exploit the random assignment embedded. We apply these methods to find large achievement gains from char-ter school attendance in Denver. By analyzing test-score consequences, chapchar-ters 2 and 3 complement chapter l's analysis of welfare/happiness consequences of school attendance.
Thesis Supervisor: Parag Pathak Title: Professor of Economics
Acknowledgments
I am most grateful to Parag Pathak for his tireless help from the very start of my Ph.D life. His way of doing research was a big hint for me to try to form a view over a broad spectrum of social issues and analytical tools in economics. Daron Acemoglu and Josh Angrist are two extreme examples of what it is like to be a social scientist, which I am still struggling with. My experience in graduate school would have been much less fun without their humor, charm, and growls.
Nikhil Agarwal provided me with some of the most sharp criticisms to this thesis; apparently I need a little more time to fully resolve the issues he raised. Joint work with Atila Abdulkadiroglu, John Hatfield, and Toshiji Kawagoe taught me a lot. I also thank other MIT faculty members for their kind input and interest, especially Itai Ashlagi, David Autor, Esther Duflo, Glenn Ellison, Bob Gibbons, Jon Gruber, Jerry Hausman, Whitney Newey, James Poterba, Jean Tirole, and Juuso Toikka. Koichiro Ito and Kosuke Uetake gave much guidance at some corners of the graduate school life. Pre-Ph.D advisors and mentors - late Masa Aoki, Hide Ichimura, Michi Kandori, Yosuke Yasuda, and especially Fuhito Kojima - remained to be sources of occasional but important instruction.
There are too many friends I should acknowledge. Numerous meals, drinks and silly chats with Dana Chandler, David Jimenez-Gomez, Ankur Mani, Ameya Muley, Harry Di Pei, Giovanni Reggiani, Peng Shi, Nathan Zorzi, and especially Mark Hou were relieving. Relatively more serious conversations and always sloppy mock presentations with Jie Bai, Alex Bartik, Vivek Bhattacharya, Alonso Bucarey, Masao Fukui, Chishio Furukawa, Ludo Gazze, Arda Gitmez, Sally Hudson, Peter Hull, Ryota Iijima, Gaston Illanes, Tetsuya Kaji, Ye Ji Kee, Yuhei Miyauchi, Manisha Padi, Brendan Price, Elizabeth Setren, Mayara Silva, Kentaro Tomoeda, and Yufei Wu were helpful. Warm welcomes by Gabriel Carroll, Scott Kominers, and Mike Powell were memorable. Daniel Waldinger and Louis Chen tirelessly corrected my English. Louis has also been an incredibly generous roommate for years.
Finally, I would say even bigger thank you to innumerable other non-economics friends and family members.
Contents
1 Match or Mismatch: Learning and Inertia in School Choice 11
1.1 Introduction ... ... 11
1.2 A First Look at Evolving Choices . . . . 16
1.2.1 Evolving School Choices in NYC . . . . 16
1.2.2 Choice Frictions and Learning . . . . 18
1.3 Uncovering Evolving Demand . . . . 20
1.3.1 Dynamic School Choice under Learning and Switching Costs . . . . 20
1.3.2 Identification . . . . 27
1.3.3 Estim ation . . . . 33
1.3.4 Estimates and Fit . . . . 34
1.4 Welfare Consequences of Evolving Demand . . . . 36
1.4.1 Costs of Ignoring Demand Changes . . . . 36
1.4.2 Evaluating Reapplication Processes . . . . 37
1.5 Conclusion and Future Directions . . . . 41
1.6 A ppendix . . . . 54
1.6.1 D ata . . . . 54
1.6.2 A First Look at Evolving Choices: Details . . . . 55
1.6.3 Uncovering Evolving Demand: Details . . . . 56
1.6.4 Theory for the Counterfactual Analysis . . . . 61
2 Natural Experiments and Strategy-proofness 87 2.1 Introduction . . . . 87
2.2 Fram ework . . . . 90
2.2.1 Generalized Deferred Acceptance Mechanisms . . . . 90
2.2.2 First Choice Empirical Research Design . . . . 93
2.2.3 Motivating Example . . . . 94
2.2.4 Strategy-proofness for Schools . . . . 95
2.3 R esults . . . . 96
2.3.1 Sufficiency . . . . 96
2.3.2 Almost Necessity . . . .. 99
2.4 Discussion and Extensions . . . 103
2.4.1 Interpretation of Strategy-proofness for Schools . . . 103
2.4.2 Alternative Definition of Extracting a Random Assignment . . . 103
2.4.3 Qualification Instrumental Variable Research Design . . . 103
2.4.4 Alternative Definitions of Research Designs . . . 105
2.4.5 Top Trading Cycles Mechanism . ... . . . 107
2.5 Future Directions . . . 109
2.6 P roofs . . . .. . . 112
2.6.1 Proof of Theorem I . . . 112
2.6.2 Proof of Corollary 2.b . . . 123
2.6.3 Proof of Proposition 2 . . . 124
3 Research Design Meets Market Design: Using Centralized Assignment for Impact Evaluation 127 3.1 Introduction . . . 127
3.2 Understanding the DA Propensity Score . . . 130
3.2.1 Propensity Score Pooling . . . 130
3.2.2 Further Pooling in Large Markets . . . 132
3.3 Score Theory . . . 134
3.3.1 Setup . . . 134
3.3.2 Characterizing the DA Propensity Score . . . 137
3.3.3 Estimating the DA Propensity Score . . . 141
3.3.4 Identification . . . 143
3.3.5 Estim ation . . . 145
3.4 School Effectiveness in Denver . . . 146
3.4.1 Computing the DA Propensity Score . . . 147
3.4.2 DPS Data and Descriptive Statistics . . . 149
3.4.3 Score-Based Balance . . . 151
3.4.4 Effects of Charter Enrollment . . . 154
3.4.5 Alternative IV Strategies . . . 155
3.4.6 Charter School Effects with a Mixed Counterfactual . . . 157
3.5 Summary and Directions for Further Work . . . 162
3.6 Theoretical Appendix . . . 177
3.6.1 Defining DA: Details . . . 177
3.6.2 Conditional Independence of DA-generated Offers . . . 178
3.6.3 Proof of Theorem 2 . . . 179
3.6.4 Proof of Theorem 3 . . . 180
3.6.5 First Choice and Qualification Instruments: Details . . . 185
3.6.6 Extension to a General Lottery Structure . . . 186
3.7 Empirical Appendix . . . 188 3.7.1 D ata . . . 188
Chapter 1
Match or Mismatch: Learning and
Inertia in School Choice
1.1
Introduction
From public housing to entry-level labor markets to school choice, centralized matching
markets are a prominent form of public policy. These markets are usually designed
as-suming that participants make well-informed choices upfront, anticipating what they will
demand in the future. Little is known, however, about whether this assumption holds
in practice. In this paper, I study how families' demand for schools evolves using data
from NYC's high school choice system, which serves more than 90,000 families applying
for 700 schools each year. I develop a framework to recover families' evolving demand
under learning and switching costs, where demand is also allowed to change in response
to prior assignments. I use the estimated framework to quantify demand changes and
their welfare consequences.
My analysis uses administrative panel data from NYC's high school choice system,
con-sisting of the centralized first-round in December and a discretionary reapplication process
in April. The data records families' participation decisions as well as rank-ordered school
choices both in the first-round and the reapplication process, allowing me to trace the
dynamics of school choices. In Section 1.2, I demonstrate that contrary to the premise of
well-informed upfront choices, families' choices change after the initial match as they learn
about schools. About 7% of families reapply and at least 70% of these reapplicants reverse
choice (preference) orders over schools between the first round and the reapplication
pro-cess. Most choice reversals can be rationalized only by real demand changes and not by
strategic behavior with unchanged demand.' These choice changes appear to be mainly
1I
say an applicant exhibits choice reversals if the following holds: In the reapplication process, she attempts to switch from the first-round assignment s to another school that is unranked or ranked below s in the preference list she reports in the first-round market. I say an applicant exhibits surely nonstrategic choice reversals if she exhibits choice reversals and does not exhaust her first-round preference, i.e., rank 11caused by learning. Most families self-report that they change their choices because of new information about schools or their preferences about schools. Moreover, consistent with their self-reports, families' choices become more correlated with and responsive to school characteristics. In particular, compared with initial applications, reapplications rank schools that are closer to families' homes and that are academically no worse.
The above choice changes provide only a lower bound on the amount of changes in un-derlying demand. There may or may not be additional unobserved demand changes. For families who do not reapply, their behavior does not directly reveal demand changes. How-ever, some families may experience demand changes but not reapply because of "switching costs" or "reapplication costs," in which case demand changes exist but are not directly observed. For example, the time cost of filling out a paper application form may constitute reapplication costs.
To distinguish these scenarios and recover underlying evolving demand, the core part of this paper in Section 1.3 develops a structural model of dynamic school choice. The model incorporates demand changes by learning and reapplication costs. I also let demand change in response to initial assignments in the first round. Specifically, I allow the utility of the first-round assignment to change by some positive or negative amount, which can differ across applicants. Such demand responses are likely if families obtain more informa-tion about their initial assignments or if they experience psychological endowment effects about them. I provide a strategy to distinguish these behavioral elements by exploit-ing three institutional features. First, because of capacity constraints, many applicants are initially assigned to a school other than the most preferred school. Second, the as-signments to the most preferred and less preferred schools are partly random, thanks to admissions lotteries used in the first-round assignment mechanism. Finally, reapplicants make new choices that are rank-ordered. These features allow me to decompose observed behavior into the model components (demand changes, reapplication costs, and demand changes in response to prior assignments.).
Intuitively, the identification logic is as follows. For simplicity, let me ignore demand responses to initial assignments and assume that there are only two preference ranks, the first choice and the lower choice. Many applicants are "lower-choice non-reapplicants," who are initially assigned to their old lower choice but do not reapply, due either to reapplication costs or demand changes. This fact allows me to measure the total effects of demand changes and reapplication costs. There are also "first-choice reapplicants," who are initially assigned to their old first choice but reapply, which must be because of demand changes. Other applicants assigned to their first choice may also experience demand changes but be locked in by reapplication costs. The fraction of reapplicants
or fewer schools though she could have ranked up to 12 schools. I show that (1) 71% of reapplicants exhibit choice reversals, (2) about 80% of the choice reversals are surely nonstrategic, and (3) surely nonstrategic choice reversals are consistent with optimal behavior only if intrinsic preferences and demand change between the first round and the reapplication process.
among all applicants assigned to the first choice thus tells us the difference between the amounts of demand changes and reapplication costs.
Now suppose that admissions lotteries in the first-round mechanism guarantee that initial assignments are randomly assigned and applicants assigned to the first-choice and lower-choice are comparable people with similar demand changes and reapplication costs.
I can compare the fractions of lower-choice non-reapplicants and first-choice reapplicants
to measure the amount of reapplication costs. Heuristically,
(fraction of non-reapplicants among applicants assigned to the initial lower choice) -(fraction of reapplicants among applicants assigned to the initial first choice) =(demand changes+reapplication costs)-(demand changes-reapplication costs) -2x reapplication costs,
which separates reapplication costs from demand changes. The precise implementation of this argument generates complications related to more than two preference ranks,
ad-missions lotteries embedded in assignment mechanisms, and demand responses to initial assignments. Solutions for these challenges are detailed below.
I estimate the model and find a significant role of learning, reapplication costs, and de-mand responses to initial assignments. Crucially, as detailed in Section 1.4, the estimates suggest that there are substantially more changes in underlying demand than in observed choices. These hidden demand changes are masked by reapplication costs, which prevent
families from reapplying and expressing demand changes.2
As a result, the welfare cost of ignoring demand changes is large. To measure the welfare cost, I compare the real first-round assignment based on old demand with the counterfactual "frictionless benchmark." The frictionless benchmark is defined as what would have been produced by the same first-round assignment mechanism, had families made choices based on their new demand after learning. Since the two differ only in whether families' choices are based on old or new demand, the difference between the
two captures the welfare costs of ignoring demand changes by learning.3 The real and
frictionless assignments turn out to be significantly different. Specifically, the two assign-ments give different allocations (schools) to a majority of families; the average welfare loss under the real first-round assignment compared with the frictionless benchmark is more than 1-mile-equivalent, when I measure it by new demand assumed to be quasi-linear in
the distance between the family and the school locations.4 This magnitude corresponds
2
Demand responses to initial assignments also lower the reapplication rate. The estimates show that families tend to get to prefer initially assigned schools more, compared with other schools. This satisfaction with initial assignments lowers the reapplication rate.
3Except applicants' choices, every other input is unchanged between the real first-round assignment and the frictionless benchmark. For example, school capacities and their preferences or priorities over applicants are fixed.
to more than .15 standard deviations in the distribution of utilities from schools for each
applicant. Demand changes thus undermine the welfare performance of the initial match that ignores demand changes.
The large welfare cost of ignoring demand changes motivates me to investigate ways to alleviate the cost by accommodating demand changes. As already explained, NYC runs a discretionary, human-driven reapplication process. It is also possible to run a centralized algorithm for the reapplication process. I build a dynamic version of the school-student assignment model, analyze centralized designs of the reapplication process, and show that the centralized reapplication processes are the "best possible" mechanisms to accommodate choice changes. I evaluate how well the discretionary and centralized reapplication processes alleviate the welfare cost of ignoring demand changes. I find that both types of reapplication processes produce welfare gains, but the centralized reapplication processes are more effective and produce gains more than twice as large as those from the discretionary process.
This evaluation of reapplication processes takes estimated reapplication costs as given. There are technological changes and school districts' and social entrepreneurs' initiatives that may ease reapplication costs (e.g., online systems for more easily making and up-dating school choices). To measure the potential effects of such demand-side changes or interventions, I finally investigate how the performance of reapplication processes depends on reapplication costs and the resulting demand-side inertia. I find that the gains from the centralized reapplication mechanisms change by several times depending on the ex-tent of demand-side inertia, which governs how much demand changes are revealed in reapplications.
These findings show that learning causes significant demand changes, which in turn undermine the welfare performance of the initial match and result in the large welfare cost of ignoring demand changes. Dynamic reapplications processes, especially centralized ones, help alleviate the welfare loss by accommodating changing demand. In addition, the gains from the mechanisms substantially change depending on the extent of demand-side inertia caused by reapplication costs. Thus, in the dynamic real world, the gains from a centralized market depend not only on its design but also on demand-side frictions such as demand changes (arising from learning) and inertia (caused by reapplication costs). This sheds empirical light on the potential importance of demand-side interventions that attempt to alleviate these frictions (e.g., applications for more easily searching school characteristics, online systems for more easily updating school choices).'
day during the high school years. Also, I use new demand as my welfare measure because it is demand after leaning at a point in time closer to enrollment periods; new demand is thus expected to be a better welfare measure than old demand is.
5Many school districts and social entrepreneurs
have been launching such initiatives. For example, see http://www.dnainfo. com/new-york/20131113/washington-heights/
six-apps-launch-guide-families-through-high-school-admissions-process and http:
Related Literature. This paper is a first empirical study on the welfare performance of
a dynamic centralized matching market. For that purpose, I develop an empirical model of evolving demand for schools under learning, reapplication costs, and demand changes in response to prior assignments, which have been studied in labor and public economics and industrial organization. I propose a novel approach to identify and estimate the different model elements using institutional features of centralized school choice systems. Finally, I combine the estimated model with a theoretical analysis of dynamic centralized matching markets to conduct welfare analysis.
More specifically, this paper combines and contributes to four different strands of the literature. First, the descriptive analysis of evolving school choices uses a revealed prefer-ence idea and relates to the economics and psychology literatures on revealed preferprefer-ence changes in the field, e.g., see papers reviewed in Blundell (1988) and Varian (2006) as well as more recent papers including Abaluck and Gruber (2011), Echenique et al. (2011), and Choi et al. (2014). These papers mainly focus on econometric difficulties in the detection
and interpretation of preference changes.6
Second, my analysis suggests that school choice changes appear to be primarily caused
by frictions in initial choices and learning about schools. This suggested importance of
frictions in school choices echoes existing studies such as Hastings and Weinstein (2008), Jochim et al. (2014), Andrabi et al. (2015), Wiswall and Zafar (2015), and Hastings et al. (2015).7 Similar findings are also present in non-education contexts (Fang et al., 2008; Kling et al., 2012; Handel and Kolstad, 2015). Unlike these studies, I study the dynamics of frictions and learning within the same applicant or family. In this respect, this paper relates to non-education papers like Farber and Gibbons (1996), Ketcham et al. (2012), and Ketcham et al. (2015) on learning.
Third, my empirical model is a model of dynamic school choice with frictions in initial choices, reapplication costs, and demand responses to initial assignments. My model is thus at the intersection of empirical school choice models, demand models with frictions,
experiments in Hastings and Weinstein (2008) and Andrabi et al. (2015), little is known about the effects of such demand-side interventions.
6I am more interested in welfare consequences of demand changes in dynamic centralized markets. To my knowledge, few papers investigate any pervasive effects of changes during administrative time delays. An exception is Autor et al. (2015), who study the effect of administrative decision time on the labor force participation and earnings of disability insurance applicants. Also, existing studies on decentralized matching markets emphasize the importance of demand changes in their discussion of unravelling. See Roth (2002) for an overview.
'NYC's former deputy director of high school enrollment also points to potential fric-tions in the school choice process: "Given how massive the New York City process is, (...) the process by which those choices are made remains complicated, and very much de-pends on expertise or the ability to spend an excessive amount of time understanding how it works. Many students still go without either." (http: //ny. chalkbeat .org/2015/08/07/ why- high-school-admissions-actually-doesnt-work-for-many-city-students- and-how-it-could/ #.VdP8ZHj5q20)
and those with switching costs (or "state dependence" or "brand loyalty"), which have heretofore been applied only to non-education settings such as labor supply, insurance,
and retail industrial organization.8 Existing models of switching costs, state dependence,
and brand loyalty include Shum (2004), Card and Hyslop (2005), papers reviewed in Farrell and Klemperer (2007), Dube et al. (2009), Bronnenberg et al. (2012), Abaluck and Gruber (2013), Handel (2013), Ho et al. (2015), Sudhir and Yang (2014), and Hortacsu et al. (2015). Demand under choice frictions is studied by Chetty (2012), Handel and Kolstad
(2015), and Spinnewijn (2015) among others. Models of school choice include Manski and
Wise (1983), Epple et al. (2006), Bayer et al. (2007), Hastings et al. (2008), Ajayi (2013), Neilson (2013), Casalmiglia et al. (2014), He (2014), Walters (2014), Abdulkadiroglu et al.
(2015b), Agarwal and Somaini (2015), Dinerstein and Smith (2015), and Kapor (2015).
Finally, this paper's theoretical analysis of centralized dynamic reapplication processes relates to the literature on the design of school-student assignment mechanisms, initiated
by Abdulkadiroglu and S6nmez (2003), building on the classic two-sided matching problem
(Roth and Sotomayor, 1990). Their model is extended and applied by Abdulkadiroglu et al. (2009) to analyze the NYC institution, but both papers consider only static models and avoid dynamic considerations. By contrast, I use a dynamic model to take demand changes into considerations. In this sense, this paper's theoretical analysis shares some attributes with recent papers on dynamic aspects of matching market design, e.g., Unver (2010), Pereyra (2013), Dur and Kesten (2014), Kennes et al. (2014), Kurino (2014), Anderson et al. (2015), Akbarpour et al. (2015), Baccara et al. (2015), Leshno (2015), and Kadam and Kotowski (2015). This paper differs, however, because these studies exclude demand changes or use additional structures (e.g., binary preferences) to analyze their applications, which makes it difficult to apply them to analyze this paper's problem. More importantly, none of the above theoretical papers connects theory to data.
1.2
A First Look at Evolving Choices
1.2.1
Evolving School Choices in NYC
I start by documenting how families' school choices evolve over time. My analysis. uses
administrative panel data from the public high school choice system in NYC for the 2004-5 school year. This system contains more than 700 high school programs of various types across Greater New York. Some schools are academically selective, while others put emphasis on the arts. 8th (and some 9th) graders living in NYC may apply to these
8
My model is also related to demand models with learning (see Ching et al. 2013 for a review), but
different in that these learning models usually consider forward-looking consumers who try to learn the quality of frequently-used products (e.g., detergents) by experimenting with multiple products. This learning-by-experimentation aspect seems secondary in my context of education, where it is not easy to switch from one school to another.
schools. Each year, about 90,000 families apply, and most of them are admitted by some school. This system has been organizing applications and selections via the following centralized procedure:
(1) Each applicant ranks up to 12 schools in the order of her preference.
(2) Each school ranks applicants using its preference or priority as well as lottery num-bers.
(3) NYC runs a strategy-proof algorithm (the "deferred acceptance" algorithm) on
ap-plicants' and schools' preferences to make an initial assignment of applicants to
schools.9
On top of this initial match, the system has an additional reapplication process. After being informed of the initially assigned school, any applicant is allowed to reapply against the assigned school if she is not satisfied with it. A reapplicant needs to fill out a paper reapplication form with a written reason for reapplying and turn it in to the guidance counselor at her middle school. In the reapplication, she is asked to rank up to 3 other schools she currently prefers over the initial assignment. She can rank the same schools as in the initial application. The initial assignment is guaranteed, i.e., if her reapplication is rejected, she is assigned her initially assigned school.
The timeline of initial applications and reapplications is available in Figure 1-1. Appli-cants make initial applications during November and December. After the announcement of the initial assignment, some families file reapplications during April and May. For reap-plicants, the time interval between their initial application dates and reapplication dates are of mean 153.8 days and standard deviation 7.7 days (Appendix Figure 1.6.8). Thanks to the reapplication process, for those who reapply, I observe their school choices at two different points in time, which allows me to investigate how their demand for schools
evolves.10
About 7% (6430 applicants) of 91289 applicants reapply (Table 1.1). NYC accepts and reassigns 21% of reapplications to other schools in a discretionary, human-driven
9The details of the algorithm will be explained in Appendix 1.6.4.
10
After the initial application process described below, there is the "supplementary round" for students who are not matched in the initial match. I exclude the supplementary round from the analysis because the supplementary round lets students rank only schools they do not rank in the initial application process, which makes it impossible to observe any clear choice changes or reversals between the initial application process and the supplementary round. In addition, the separate system that NYC uses for allocating seats in selective "specialized programs" or exam schools, is also outside the scope of my analysis because the system does not provide information about dynamic choice changes. I also exclude from my analysis those applicants who enroll in schools other than their initial assignments through over-the-counter bargaining, because I observe little information about it. Finally, my description below is for school year 2004-5 and parts of it may not be applicable to the current institution. Nevertheless, NYC keeps using similar discretionary reapplication processes even in recent years. See http: //insideschools. org/blog/item/ 1000804-kids-win- one-third- of -hs-appeals#.
reapplication process. To measure choice changes, I say an applicant exhibits choice
reversals if she reapplies against her initially assigned school s by ranking another school
that is ranked below s or unranked in her initial application.'1
Among those who reapply, 71% (4564 applicants) exhibit choice reversals. This number is about 5% of the whole population.12
Crucially, most choice reversals can be rationalized only by intrinsic demand or pref-erence changes. I say an applicant exhibits surely nonstrategic choice reversals if she exhibits choice reversals and ranks 11 or fewer schools in her initial application, even though she could have ranked up to 12 schools. Surely nonstrategic choice reversals are consistent with optimal behavior only if there are intrinsic demand changes between the first round and the reapplication process. To see this, suppose to the contrary that an applicant exhibits surely nonstrategic choice reversals but does not experience demand changes. Let s be her initial assignment and t be any other school that (1) she ranks in her reapplication, but (2) she ranks below s or does not rank in her initial application. If she prefers s to t, then she would be better off by dropping t from her reapplication. If she prefers t to s, then she would gain by ranking t ahead of s in her initial applica-tion: The deferred acceptance algorithm in the initial application process is known to be strategy-proof for applicants and guarantees this property (Abdulkadiroglu and Sdnmez, 2003). Thus, surely nonstrategic choice reversals can be rationalized only by real demand changes. Table 1.1 shows that about 80% of choice reversals are surely nonstrategic. This fact suggests that most choice reversals in the reapplication process reflect real demand changes rather than strategic behavior.
1.2.2
Choice Frictions and Learning
Characteristics of all applicants, reapplicants, reapplicants who exhibit choice reversals are in Table 1.2. Those who reapply (and exhibit choice reversals) look similar to the average applicant, though the former is slightly more likely to be a female 8th grader and have lower test scores. Why do these similar looking applicants reapply? There are many potential reasons, such as mistakes in initial applications, changes in the life situation (e.g., moving), changes in the information about schools, changes in intrinsic tastes and preferences, and peer effects related to which schools siblings, friends, and bullies are assigned.
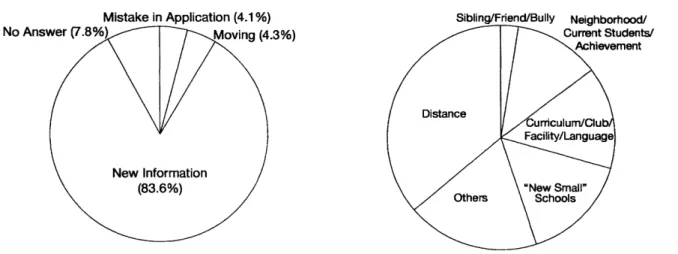
To understand the relative importance of these factors, Figure 1-2 provides a
break-"Note that I do not include choice reversals among other schools than the initially assigned school s. For example, there are cases where an applicant prefers t($ s) to u(# s) in the initial application, but prefers u to t in the reapplication. I ignore these cases to make my calculation conservative.
1 2
As another look at this fact, Appendix Figure 1.6.9b shows that many applicants reapply after being assigned to their top choices. Also, Appendix Figure 1.6.9a shows that the first choice market shares of schools change from the first round to the reapplication process, where the first choice market share of a school is the fraction of applicants who rank it first among all applicants who make a first choice.
down of reapplication reasons self-reported by reapplicants. Panel (a) shows that the vast majority of reapplicants claim that they reapply because of new information or learning about school characteristics or their preferences about school characteristics. For example, many families claim that they were not aware of how far away the initially assigned school is or how painful it is to travel to the initial assigned school. Only a small fraction (less than 5% each) ascribes their reapplications to other potentially important factors, such as mistakes in initial applications and moving after initial applications. This provides suggestive evidence that the main factor for evolving demand is frictions in the initial choice process and learning about schools.1 3
Panel (b) provides a further breakdown of the largest category of new information. This further breakdown shows that a variety of observable and unobservable school char-acteristics matter. Nevertheless, only a tiny fraction of reapplicants claim that they reapply because they do or do not want to enter the same school as particular siblings or friends or bullies; as far as reapplication decisions are concerned, peer effects do not seem quantitatively important.
Consistent with their self reports, families' choices become more correlated with and responsive to school characteristics in reapplications. Table 1.3 documents that, compared with initial applications, reapplications rank schools that are more than 20% closer to families' homes. These distance reductions come without sacrificing academic achievement level, as shown in lower rows. This pattern holds across demographic groups (Appendix Table 1.6.11). In Table 1.4, to incorporate other horizontal characteristics, I run the following descriptive regression:
yt =bX, + e',
where y' is the first choice market share of school s in round t, which is the first round or the reapplication process, where the first choice market share of a school is the fraction of applicants who rank it first among all applicants who make a first choice. X, is a vector of observable characteristics of school s, which do not change from the first round to the reapplication process.
Table 1.4 shows R2's from the above regression for the first round and the reapplica-tion process. Across various specificareapplica-tions of X8, R2 is always higher in the reapplication process; reapplications appear to be more attentive or responsive to observable school characteristics than initial applications do. I checked to ensure that this pattern is robust to many specifications with different school characteristics and their interactions. The
R2 increase is almost always present across demographic groups defined by baseline test
"Since the reapplication process is discretionary, some of the self-reported reapplication reasons may be contaminated by strategic reporting. However, there seems to be no clear reason to expect that strategic reporting overstates the new information category because other reasons, such as moving and mistakes, sound more legitimate.
scores and race (Appendix Table 1.6.10).14 Note that Tables 1.3 and 1.4 and Figure 1-2 use mutually exclusive aspects of the data: While Figure 1-2 classifies self-reported rea-sons for reapplications, Tables 1.3 and 1.4 correlate families' school choice behavior with observable school characteristics. Tables 1.3 and 1.4 thus provide another independent support for the possibility that families become more informed of observable school char-acteristics or their preferences about them as time goes by.
The above descriptive analysis documents that a significant fraction of families change their school choices mainly because of learning about schools. This analysis has several limitations, however. I cannot extrapolate the suggestive findings on learning (Tables 1.3 and 1.4 and Figure 1-2a) to the whole population since they are based on self-selecting reapplicants. More importantly, the descriptive analysis depends entirely on observed choice changes, but observed choice changes may underestimate changes in latent demand. In particular, for families who do not reapply, their behavior does not directly reveal demand changes. However, some families may experience demand changes but not reapply because of "switching costs" or reapplication costs, in which case demand changes exist but are not directly observed. For example, the time cost of filling out a paper application form may constitute a reapplication cost.
To distinguish these scenarios and recover underlying evolving demand, it is necessary to model how learning and the resulting demand changes do or do not come to the surface as observed choice changes in the presence of potential reapplication costs. I next integrate key pieces of the descriptive analysis into a structural model of dynamic school choice with learning and reapplication costs.
1.3
Uncovering Evolving Demand
1.3.1
Dynamic School Choice under Learning and Switching Costs
To recover underlying evolving demand that is not necessarily reflected in observed choice behavior, this section develops a structural model of dynamic school choice. The model incorporates demand changes by learning and reapplication costs. In addition, the model allows demand to change in response to initial assignments in the first round. Specifi-cally, I allow the utility of the first-round assignment to change by a positive or negative amount, which can be heterogenous across applicants. Such demand responses are likely if families experience psychological endowment effects about their initial assignments or get more information about them.
1 4
These R2 increases may be trivial if initial applications shares are more dispersed. However, the standard deviation of market shares changes little between the two periods (0.0028 for initial application shares and 0.0027 for reapplication shares).
Demand Before and After Learning. The random utility of school s for applicant a in
period 0 (the initial application process) is
Ua.q = U.9 + E 1a( +Ka)aa Efs
U0 U0
~k=10ak(1
fak)Xask + Cs 1where U is a school-specific effect, X, = (Xask)k=1,..,K is a vector of (interactions of)
a's and s's observable characteristics (e.g., the distance between a's and s's locations),
3a =(ak)k==1,...,K is a vector of preference coefficients, and 60 is an unobserved utility
shock.
fa (fak)k=1,...,K is the only non-standard term and stands for frictions a faces
about how to value characteristics X,, in the initial application process. I interpret
each !ak(1 - fak)Xask as a's perceived valuation of Xask in t = 0. fak can be positive
or negative and heterogenous across different characteristics. Two interpretations of this specification are possible. The first interpretation is that fak is frictions about preferences
3ak and an applicant may not know her preferences about characteristics Xask, e.g., how
painful it is to travel a certain distance. The alternative interpretation is that fak is
fric-tions about characteristics Xsk and an applicant may not know Xask, e.g., the distance to
schools. Both interpretations and their combinations are consistent with the descriptive analysis and result in the same welfare implications below. I prefer the first interpreta-tion; see "Discussions on Modeling Decisions" at the end of this section for an additional discussion. The modeling of the friction is motivated by Figure 1-2a and Tables 1.3 and 1.4, which suggest that applicants face frictions about observable school characteristics or their preferences about school characteristics in the initial application process. I assume
that each applicant a's initial preference >-a is based on perceived utilities Ua,'s subject
to frictions, i.e., s >o s' only if U2s8 > Ua,,/15
After the initial application, NYC runs the (applicant-proposing) deferred acceptance algorithm to give an initially assigned school so to each applicant a. During and after the match-making process, applicants' perceived utilities change. The random utility of school s for applicant a in period 1 (the reapplication process) is
U1 = Us + A + s +'7a1{s = S}. (2) as
~
i-aasThe first three terms are similar to those in initial utilities Ua0, except that the frictions
are normalized to zero,1 6 and school-specific effects Us = U0 + U, and unobserved utility
1I assume s >-0 s' for any ranked school s and unranked school s'. See "Discussions on Modeling
Decisions" at the end of this section for discussions about this truth-telling assumption. 6
1n reality, some of the frictions are likely to remain even in the reapplication process. I need to assume it away as a normalization, however, since the data contains only two periods.
shocks ea =as + Eas are subject to new unobserved shocks U and Es, respectively. I allow U1 and cl to differ from U0 and co, respectively, to accommodate the fact that demand changes are sometimes related to unobserved school characteristics such as how nice current students are (Figure 1-2b). As a result of this specification, unobserved utility shocks eo and c are serially correlated for each applicant a. This is reasonable given the interpretation of unobserved utility shocks c' as the sum of unobserved utility components in period t and that the unobserved determinants of utilities for an applicant are likely to be serially correlated.
The last term yalf{ s = s'}, which is turned on if and only if school s is applicant a's initial assignment sa, captures the possibility that an applicant's utility from the initially assigned school may evolve differently than utilities from other schools do. For example, applicants may get more information about the initially assigned school than they would with other schools. Or they may begin to prefer the assigned school more because it admits them, or they get used to it (habit formation or endowment effects). I call -Ya the
initial assignment effect.
Model of Reapplications 1: Rational Expectation. Each applicant decides whether to
reapply based on how preferable the initial assignment s' is with respect to new demand
Ua'
's. Recall that there are factors that may prevent applicants from reapplying, for example, the time cost of making and submitting a reapplication. In fact, each reapplicant needs to fill out a paper reapplication form with a written reason for reapplying, and turn it in to the guidance counselor at her middle school. I consider two models to incorporate such "reapplication costs" or "switching costs". I call these models the rational expectationmodel and the naive free expectation model. The rational expectation model allows for
school-specific reapplication acceptance probabilities, but assumes "rational" expectation about applicants' expectations about reapplication acceptance probabilities. The naive free expectation model does not need the rational expectation assumption, but assumes that reapplicants form simplistic beliefs about how the reapplication process works.
The first rational expectation model consists of two layers. The first layer is about reapplication acceptance probabilities. In the reapplication process, each applicant a who reapplies with new preference (Si, 82, S3) is re-assigned to at most one of schools Si, s2, and S3. Since there is no accurate algorithmic description of discretionary reapplica-tion acceptance decisions by NYC, I suppose that the (mutually exclusive) re-assignment probabilities can be approximated by the following descriptive model. For each i = 1, 2,3,
Pr(a is re-assigned to si)
Pr(bo + bxXas + bwWasi + asi > 0) if si
#
0
where Xas is the characteristics of a and s used in the utility model, and 'as ~iid EV(I)
(logit) with usual variance normalization to 7r2/6. (Results from a probit version are
sim-ilar.) Was contains additional factors that may affect reapplication acceptance decisions
by NYC: a measure of how oversubscribed or popular s is (the number of applicants
re-jected by s in the initial application process), an indicator that a ranks s in the initial application, and another indicator that a is rejected by s in the initial application process. Let Pas, be the estimate of Pr(a is re-assigned to si) I obtain by applying the above model to the reapplication acceptance data.
The second step consists of applicants' reapplication decisions given acceptance prob-abilities in the first step. I assume that applicant a reapplies if there is a combination of
0
schools (s1, s2, S3) such that (a) for all i = 1, 2, 3, si is a school other than sa or empty,
(b) si 4 si or si = sj = 0 for all i
#
j,
and (c)i=iPasi, L, + (1 - i=1Pas)UasO - > Ca
expected benefit from reapplying cost
S i=1PasiUsi -=iPasi Uaso > Ca + 'E=1ZiPasi Cda
M EiPasU i > =PajU=,o + Ca, (3)
where ca is the reapplication cost." This model imposes the rational or sophisticated ex-pectation assumption that each applicant believes that she is accepted by schools si, S2, and S3 with mutually exclusive probabilities Pasi) Pas2, and Pas,, respectively. This
as-sumption is unavoidable since there seems to be no way to identify subjective pas, for each (a, si) pair. The condition for reapplying can be written as in the last line of (3), a
discrete choice with switching costs a. I use "switching costs" to mean such combinations of reapplication costs and initial assignment effects, which I will separately identify.
If reapplying, applicant a ranks schools (Si, s2, S3) to maximize the expected benefit in the left hand side of (3), i.e., schools with largest PasUas. I also assume that if applicant a reapplies but does not exhaust her new preference list, i.e., a ranks less than three schools in >- 1, any unranked school is less preferred to the guaranteed initial assignment so in
U.
The above reapplication acceptance model has limitations. For example, ideally, I would let bi be heterogeneous across schools or applicants. However, this is infeasible because there are more than 700 schools, while only about 6000 applicants reapply, and each reapplicant ranks at most three schools in the reapplication. Instead, I include rich attributes of applicants and schools in Xas and Was. I also have to exclude the effects of s' 5 s on the probability that applicant a's reapplication for school s is accepted. If
accep-1 7
A small fraction of applicants are not assigned to any school in the initial match. The above model is not well-defined for these unassigned applicants since so = 0 for them. For them, I assume the following model for the utility of the outside option 0: Ua0 = UO + 'Ea where UO is the outside-option-specific
tance probability pas, depends not only on school si but also on sj, then the maximizer of the expected benefit of reapplying is not necessarily schools with largest pasU,. To find the maximizer, I need to search over all possible combinations of up to 3 schools. Since there are more than 700 schools, the number of such combinations is prohibitively large, making estimation intractable. Due to these difficulties, I resort to the above simplified
model. 18
Model of Reapplications 2: Naive Free Expectation. The main concern with the rational
expectation model is that it imposes rational expectations. To deal with this issue, I also consider an alternative model that does not assume rational expectations, but instead assumes naive beliefs about how the reapplication process works. In the alternative model, applicant a does not reapply if
pa(max8s0s Uas
-
Ua
8) < Ca (> 0)
expected benefit from reapplying cost
6 maxsoUl - Uj0 < ca/Pa +1a -/ za
SU1a+ > Uj8 for any s so, (4)
where Ca is the reapplication cost and Pa is a's subjective probability that a's reapplication is accepted. I do not assume Pa to be the same as the real reapplication acceptance probability.
This model imposes a simplifying assumption that the expected benefit from reapply-ing is expressed as Pa times the utility difference between the initial assignment and the new most preferred school. If so is a's most preferred school in
U,
i.e., maxsUa8 = , then the left hand side of the second line of (4) is negative and so a never reapplies. Otherwise, a reapplies when the expected benefit from doing so exceeds the reapplication cost Ca. Again, the condition can be written as in the last line of (4), a discrete choice with switching costs a.For those who reapply, I observe new rank-ordered preference >- and assume that each reapplicant submits >-' based on U 's, i.e., s >-i s oniy if
Uas> U,.
As in therational expectation model, I also assume that if a reapplies but does not exhaust her new preference list, i.e., applicant a ranks less than three schools in a, any unranked school
is less preferred to the guaranteed initial assignment so in
UIs.
Comparing the two models, the rational expectation model allows for school-specific reapplication acceptance probabilities, while assuming rational expectation. The naive
18
In general, the above model can cause internal inconsistencies E 3pa, > 1. In my data,
how-ever, reapplication acceptances are rare, and estimated Pas, is almost always less than 0.2. As a result,
free expectation model does not need the rational expectation assumption, but assumes that reapplicants form simplistic beliefs about how the reapplication process works. These two models are thus expected to be complementary and serve as robustness checks for each other. I estimate both models and show that the key results hold under both mod-els. Before moving on to identification and estimation, however, I need to discuss other important modeling decisions.
Discussions of Modeling Assumptions
Choice Frictions and Learning. The key modeling decision about the evolving utility
model is how to model frictions in initial choices. My model specifies them as /3ak(1 +
fak)Xask. Ideally, I would like to make frictions fak more flexible, for example, fask that is heterogeneous not only across applicants a and characteristics k, but also across schools s. Alternatively, an additive specification O3ak(Xask + fask) may be another more flexible way to model frictions. In such more flexible models, /3ak(1 + fask) or ak(1 + fask ) (note
Xask
that
#Oak(Xask
+ fask) = 3ak (1 + ask )Xask) performs the same role as the taste coefficientXask
on Xask in usual discrete choice models with no frictions. However, it is unclear how I can identify the distribution of such coefficients that depend not only on a but also on s. For example, consider a static discrete choice model with no frictions Uas, = asda, + Ea, where das is the distance, which is always positive. For each a, consider any preference coefficients
(0a,), such that (1) each /a, is so large that the effect of E,, on choice probabilities is negligible and (2) 0#as, > 0a12 > ... , where si is a's observed i-th choice. Any such (0a,), can rationalize a's observed choices, making identification impossible without a particular parametric assumption. To avoid the potential lack of identification, I make
fak independent from s.19 Even under this restriction, fak allows for rich heterogeneity across a and k.
Yet another potential way to model frictions and learning is to introduce "consider-ation sets", i.e., subsets of schools applicants consider when they make initial choices. See Goeree (2008) for an existing empirical model of consideration sets. There is not enough variation in my data to allow for both frictions fak and consideration sets. Given a choice between frictions and consideration sets, I prefer frictions for several reasons. First, consistent with the friction specification, self-reported reasons for reapplications mention the initial lack of knowledge about school characteristics or their preferences about school characteristics more often than the initial lack of knowledge about the pres-ence of particular schools. Second, for inferring a consideration-set-formation process, I need some variation that makes different schools more or less likely to enter consideration
19This discussion relates to recent attempts to identify and estimate discrete choice models with mea-surement errors, since frictions about Xask or %ja can be reinterpreted as measurement errors in Xask.
sets. However, it is unclear if time-series variation in my data is enough, since the contrast between initial applications and reapplications contains no variation across schools. For these reasons, this paper focuses on frictions fak, and I leave a consideration-set approach for future research.
Deliberate Reapplication Decisions. My reapplication model assumes that families
make reapplication decisions by deliberately comparing their initial assignments with other schools according to their new demand. A potential concern is that reapplication decisions may be primarily driven by less systematic factors (e.g., inattention unrelated to initial assignments). However, there are several descriptive facts showing that, consistent with my model, families' reapplication behavior responds to the desirability of their initial assignments. For example, the more preferred school an applicant is initially assigned, the less likely she is to reapply (Figure 1-4); this correlation is always present across many subgroups defined by demographic characteristics and first-round application behavior (Appendix Figure 1.6.12). The next identification section will detail these facts. Appendix 1.6.3 further shows that this correlation is causal and structural. This suggests that many applicants, including those who do not reapply, compare their initial assignments and other schools.
In addition, the amount of choice reversals reapplicants exhibit is strongly correlated with the preference rank of their initially assigned school (Figure 1-3). These correlations are also consistent with my model. In my framework, the more preferred school an appli-cant is initially assigned, the smaller the expected benefit of reapplying is for her. Thus, those assigned to more preferred initial assignments need to experience larger demand changes to find it worth reapplying, compared with those assigned to less preferred ini-tial assignments. As a result, conditional on reapplying, the amount of observed choice reversals, which reflect demand changes, should be decreasing in the preference rank of the initially assigned school, implying a pattern as in Figure 1-3.
These facts suggest that many families behave in ways consistent with deliberate reap-plication decisions. If some people behave according to inattention unrelated to initial assignments, their behavior is likely to be absorbed by reapplication costs in my model. This misspecification concern is common in empirical studies on switching costs.
Truthful Behavior in Initial Applications. The model assumes that each applicant
makes the initial preference >- as a non-strategic rank-ordered discrete choice based on old utilities Us 's. This should be a reasonable assumption since (1) a majority of applicants
(more than 70%) do not exhaust preference lists and rank 11 or fewer schools, and (2) the deferred acceptance algorithm used in the initial application process is strategy-proof for applicants and guarantees that the above truthful behavior is always optimal for any applicant who does not exhaust her preference list. Even for those who exhaust their preference lists, the deferred acceptance algorithm makes it always optimal for any
applicant to truthfully report her relative preference order over ranked schools.
The above discussion ignores the presence of the reapplication process. In principle, applicants may strategize in initial applications for switching to a more preferred school in the reapplication process. However, such strategic behavior is unlikely to benefit reap-plicants: The reapplication acceptance rate is low (21%), and it is rare that reapplicants can switch to more preferred schools. Also, the reapplication process is a discretionary process with no algorithmic rule. It is thus unclear how to strategize in initial applica-tions to benefit in the reapplication process. For example, one may suspect that in the reapplication process, it may be easier to be transferred to a school that is not ranked in initial applications, making it profitable to strategically drop some schools from initial applications. However, in the data, reapplication acceptances are more likely to be given to schools ranked in the first round.
Finally, there is an additional tractability consideration that forces me to ignore po-tential strategic behavior. With strategic behavior, I need to consider applicants' choices over combinations (lists) of schools, but the number of such combinations is prohibitively large in my setting with hundreds of schools. In light of these computational and concep-tual reasons, I assume away strategic behavior in initial applications. Existing studies also use similar truth-telling assumptions (Hastings et al., 2008; Ajayi, 2013; Abdulkadiroglu
et al., 2015b).
Outside Option. I do not explicitly model the outside option because it is unclear
whether the data is informative about the outside option. Many applicants do not exhaust their initial preference lists, but it does not necessarily mean that all unranked schools, which are almost all of NYC schools, are less preferred over the outside option for them. A more reasonable interpretation seems to be that they are optimistic and expect that they will be assigned to one of the ranked schools for sure; see Robbins (2011) for an article that reports about such optimistic families. In this scenario, the data does not provide any information about the comparison between the outside option and NYC schools. I thus refrain from modeling the outside option.
1.3.2
Identification
My model allows for preferences (,3a), frictions in initial choices (fa), reapplication costs
(ca), and initial assignment effects (-y). This flexibility may create an identification
concern, because it is often difficult to separately identify heterogenous preferences and switching costs (Chamberlain, 1983; Heckman, 1991). In fact, no other model reviewed in the related literature seems to allow for all of the above model components simultane-ously. This section explains which aspects of my data allow me to distinguish the model components. For brevity, I focus on the above key parameters and ignore school-specific effects Uj and unobserved utility shocks E.