HAL Id: halshs-01706627
https://halshs.archives-ouvertes.fr/halshs-01706627
Preprint submitted on 12 Feb 2018HAL is a multi-disciplinary open access archive for the deposit and dissemination of sci-entific research documents, whether they are pub-lished or not. The documents may come from teaching and research institutions in France or abroad, or from public or private research centers.
L’archive ouverte pluridisciplinaire HAL, est destinée au dépôt et à la diffusion de documents scientifiques de niveau recherche, publiés ou non, émanant des établissements d’enseignement et de recherche français ou étrangers, des laboratoires publics ou privés.
second-hand market?
Roar Adland, Pierre Cariou, François-Charles Wolff
To cite this version:
Roar Adland, Pierre Cariou, François-Charles Wolff. Does energy efficiency affect ship values in the second-hand market?. 2018. �halshs-01706627�
EA 4272
Does energy efficiency affect ship
values in the second-hand market?
Roar Adland*
Pierre Cariou**
François-Charles Wolff***
2018/06
(*) Norwegian School of Economics
(**) Kedge Business School
(***) LEMNA - Université de Nantes
Laboratoire d’Economie et de Management Nantes-Atlantique Université de Nantes
Chemin de la Censive du Tertre – BP 52231 44322 Nantes cedex 3 – France http://www.lemna.univ-nantes.fr/ Tél. +33 (0)2 40 14 17 17 – Fax +33 (0)2 40 14 17 49
Docum
ent
de Tra
vai
l
W
or
ki
ng P
ape
r
Roar ADLAND (corresponding author), Department of Business and Management Science, Norwegian School of Economics (NHH), Helleveien 30, 5045 Bergen, Norway, Tel: +47 5595 9467. E-mail:
Pierre CARIOU, Kedge Business School, 680 Cours de la Libération, 33405, Talence, France. Tel: +33 (0)5 56 84 55 56. E-mail: [email protected]
François-Charles WOLFF, LEMNA, University of Nantes, BP 52231 Chemin de la Censive du Tertre, 44322 Nantes Cedex 3, France ; and INED, Paris, France. Tel: +33 (0)2 40 14 17 79. E-mail:
Abstract: This paper investigates whether the energy efficiency of vessels is reflected in sales prices in the second-hand market. Using unique data of nearly 1,600 sales transactions over a 21-year period, we consider a hedonic pricing framework in which we control for market conditions, vessel specifications and buyers’ country of origin to identify the specific impact from energy efficiency. Using two indicators for energy efficiency, we find a negative relationship between energy efficiency and sale price with an elasticity around 0.4. Furthermore, our results show a reduction in the influence of energy efficiency on asset values during the drybulk market boom in 2003-2008 compared to the remainder of the sample.
1. Introduction
There are several mechanisms by which the energy efficiency of a ship should influence its asset value in the second-hand market. First, improving energy efficiency can be a way to restore profit margins, particularly when freight rates are low and fossil energy price are expected to increase in the future. Second, because users (final customers and vessel owners or charterers) are increasingly aware of the negative environmental impact from transport, energy efficiency may be a competitive factor when buying or hiring new or second-hand assets (Raucci et al., 2017). Third, differences in operating costs and the environmental profile of an asset may translate into differences in utilization (Prakash et al., 2016). For instance, an energy efficient ship may have less idle time between contracts or a lower probability of being mothballed. Therefore, energy efficient assets could potentially obtain a premium in contracted revenue, reflecting higher demand from increasingly environmentally conscious users in a two-tier market.
Given that the present asset values should reflect earnings from future employment and resale values, and not just current market conditions and policies, these incentives for private operators to invest in energy efficient assets are not straightforward to estimate separately. For instance, the present value of the cost savings due to lower fuel consumption depends on the uncertain lifespan of the asset, the conditions under which the asset is operated and, perhaps most importantly, expectations on fuel price. This issue is further complicated by the fact that ships can be employed on a variety of short and long-term contracts, in any region of the world, and on different types of freight contracts with varying allocation of fuel costs between the buyers and sellers of the transportation service.
Because asset values should reflect expectations about the future, they are also subject to uncertainty in environmental policies that could affect the cost of fuel, the lifespan of the asset, or limit the geographical regions in which they can be operated. Regulatory uncertainty manifests itself in different ways, for instance, the timeline of implementation, the speed and scope of ratification of international law, financial penalties of non-conformance and the impact on market prices. In the shipping industry, an example is the phasing out of single-hull tankers (Tamvakis, 1995), where the IMO set deadlines after which such tonnage could only trade among a limited number of non-signatory countries and otherwise faced premature demolition or conversion. In the general energy efficiency literature, these sources of risk are generally classified as external risks (Sorrell et al., 2000) and complements general business risks (access to financing) and technical risk (asset performance) or as supply-side and demand-side risks (Raucci et al., 2017).
While the impact of energy efficiency and, indirectly, environmental policy risk is clearly of interest to the owners and financiers of real assets and policy makers alike, there has been little empirical research in this area. One notable exception is Fuerst and McAllister (2011) who investigate the impact of energy performance certificates on commercial real estate values using a hedonic pricing model. Opinion concerning shipping assets are mixed and not based on thorough empirical analysis. Faber et al. (2009, p. 255) simply state that “environmental performance is generally not reflected in the asset price”. However, drawing on interviews with shipbrokers and ship financiers, Mitchell and Rehmatulla (2015) find the general opinion to be that efficiency is priced by the market, even though energy efficiency may not always be explicitly assessed in lending decisions.
This paper represents, to our knowledge, the first empirical analysis of the relationship between energy efficiency and the value of ships. Specifically, we consider the second-hand values of small oceangoing bulk carriers, so-called Handysize bulkers with a deadweight (DWT) carrying capacity of 10,000 – 40,000 tonnes. This market segment is an ideal candidate to test the relationship between energy efficiency and asset values. First, as ships are mobile assets and relatively fungible within a segment (i.e. a size range of a particular ship type), the second-hand market can be considered as a global single market. Second, while cashflow shocks influence the investment decisions of shipping
firms (Drobetz et al., 2016), the trading flexibility and modest investment size of small bulkers means that the second-hand market for Handysize bulkers remains sufficiently liquid throughout the shipping market cycle. Third, shipping assets have seen a gradual tightening of environmental policy in the past decade with the introduction of stricter sulphur limits in marine fuels – leading to higher fuel costs - first in regional Emission Control Areas (Adland et al., 2017a) and globally from 2020. Fourth, the assets are known to be subject to policy risks, with both the EU and the International Maritime Organization (IMO) trying to reach an agreement on some form of carbon taxation (Lee et al., 2013; Hermeling, 2015; Wang et al., 2015) which would increase the future fuel costs.
The remainder of our paper is structured as follows. Section 2 reviews the relevant literature on the impact of energy efficiency in shipping. Section 3 provides a description of the data. Section 4 presents our econometric results along with many robustness checks. Finally, Section 5 contains our concluding remarks and suggestions for future research.
2. Literature review
Until now, empirical analyses of the pricing of energy efficiency in shipping have mainly examined the impact on the freight rate agreed for individual contracts (fixtures). This follows a long tradition of microeconomic analysis of freight market fixtures based broadly on the hedonic pricing framework of Rosen (1974) as undertaken by Bates (1969), Tamvakis (1995), Dick et al. (1998), Tamvakis and Thanopoulou (2000) and Alizadeh and Talley (2011a, 2011b). In these studies, the price (freight rate) of each individual fixture is regressed on vessel specifications (such as age and DWT) and contract characteristics (such as route and duration) to control for variations due to observable differences. Adland et al. (2016a) expand on this methodology by accounting for unobservable charterer, owner and owner-charterer match effects in fixed-effects regression models and find that the influence of charterers is greater than that of owners for large tankers and bulkers.
Only a small subset of this literature on the microeconomic modelling of freight rates explicitly considers the impact of energy efficiency on the pricing of contracts. We note here that vessels can be chartered on two main types of contracts in the freight market: voyage charters and timecharters (TC). Under a voyage charter, the shipowner is paid on a dollar per tonne cargo basis and pays all costs including fuel expenses. Under a TC, the shipowner gets paid on a dollar per day basis for the duration of the hire period, but fuel expenses and other voyage costs are borne by the charterer (Stopford, 2009). The differentiation between these two main types of contracts is closely related to the split incentives problem. Split incentives occur when the costs and benefits of energy efficiency accrue to different agents (Blumstein et al., 1980; Fisher and Rothkopf, 1989; Howarth and Winslow, 1994). In the context of a TC, the cost of building or upgrading an energy-efficient vessel is borne by the shipowner, while the benefits in terms of fuel cost savings accrue to the charterer.
The literature has focused on how the savings in fuel costs are shared between owners and charterers through higher TC rates, thus reducing the split incentives problem. Agnolucci et al. (2014) estimate a microeconomic model for TC rates in the Panamax drybulk market and find that approximately 40% of the energy efficiency savings are shared with the shipowner for the period 2008 - 2012. Adland et al. (2017b) expand the analysis to several drybulk vessel sizes over a 15-year time period and find that only 14%-27% of the fuel cost savings are shared with shipowners by way of higher TC rates, and only during normal market conditions. Importantly, they find that energy inefficient tonnage is rewarded in strong markets, suggesting that revenue-enhancing attributes such as speed and capacity trump the value of fuel savings during such market conditions. This is an important finding, as it suggests the pricing of energy efficiency in TC contracts is market dependent and that owners of energy efficient tonnage could even be penalized in very strong markets.
investigate the presence of a quality premium in the Panamax drybulk TC market using Generalized Additive models and a non-linear relationship. They find that only vessels with very high fuel consumption have to accept a discount in rates. Prakash et al. (2016) suggest that there is little or no evidence of a freight rate premium for better greenhouse gas (GHG)-rated ships (the Rightship GHG rating being used as a proxy for energy efficiency) and that no significant difference is observed in terms of productivity for ships with better GHG ratings. Mitchell and Rehmatulla (2015) also observe that only a minority of shipping financiers take into account energy efficiency. We refer to Rehmatulla and Smith (2015a,b) for a thorough review of the barriers to energy efficiency in shipping.
To summarize, the above literature review has identified several important factors in the study of energy efficiency and pricing. In particular, the impact may vary with the market cycle and may be non-linear across the population of assets as a function of their energy efficiency. We contribute to the literature by providing the first empirical evaluation of the impact of energy efficiency on asset values in the second-hand shipping market.
3. Description of the data
Our empirical analysis focuses on Handysize vessels which are small bulk carriers with a carrying capacity in the range between 10,000 DWT and 40,000 DWT (Clarkson Research, 2017). Due to their modest size and onboard cranes, they can call at a very large number of ports around the world and transport a wide range of commodities and semi-finished goods such as grain, coal, sugar, alumina and steel products. Their operational flexibility and relatively low investment cost make Handysize vessels the preferred vessels for many small shipowners in both developed and developing countries around the world.
As of mid-2017, the global Handysize bulk carrier fleet consisted of 3,350 vessels, averaging 28,500 DWT and owned by 1,177 different shipowners in 68 different countries. It follows that the ownership of the fleet is highly fragmented, with an average fleet size per shipowner of only three vessels. Market concentration in terms of ownership is also low, with the top-ten owners controlling 401 vessels or 12% of the overall fleet (all numbers being from Clarkson Research as of mid-2017). This is an important observation in our context, as it means the influence of buyers and sellers on second-hand transaction values is likely to be low in comparison to earlier studies on freight rates in more concentrated markets such as those for large bulkers and tankers (Adland et al., 2016a).
Our transaction data for the second-hand market correspond to reported Handysize bulker sales between January 1996 and March 2016 and are sourced from Clarkson Research (2017), which collects such information from shipbrokers and other industry sources. We have essentially two types of information in the database. First, there is a detailed description of the vessel characteristics. This includes the date when the vessel was built, the deadweight (in tonnes), the name of the builder and the country where the ship was built, the design speed, the fuel consumption, the engine power, the grain capacity, the number of holds, the number of hatches, and capacities of both derricks and cranes. Second, there are characteristics related to the transaction. This includes the date of sale, the sale price, and country of both buyer and seller. Using the date of sale, we calculate the age of each vessel at the time of sale. We complement the transaction data with the time series of one-year TC rates for a standard 28,000 DWT Handysize vessel as reported by Clarkson Research (2017) to serve as a proxy for market conditions at the time of sale.
The original sample includes 1,715 transactions collected over 21 years. After deleting observations with missing information on either fuel consumption or other vessel characteristics, we end up with a sample comprising 1,586 transactions. The three years characterized by the highest numbers of transactions are 2006 (N=117), 2007 (N=154) and 2009 (N=162). Conversely, there were only 69 sales in 2008, corresponding to the onset of the financial crisis. The number of annual sales is at most 50
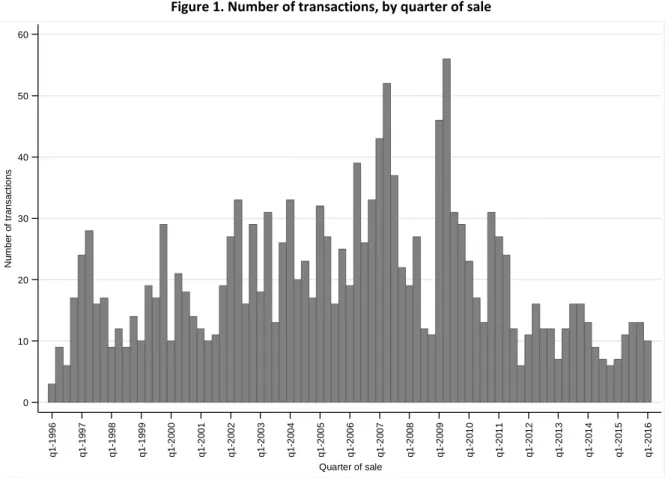
since 2012. We present the number of transactions by quarter of sale in Figure 1. The quarterly number of sales vary between 3 (1st quarter of 1996) and 56 (2nd quarter of 2009), with an average of 19.6 and a standard deviation of 10.8. There is substantial variation over time in the number of sales, but the data does not exhibit a specific time trend. Instead, market conditions seem to have a strong influence.
Figure 1. Number of transactions, by quarter of sale
Source: authors’ calculations, data from Clarkson Research.
On average, the sale price of a Handysize bulker is 9.0 million US$ over the whole period, with a standard deviation of 7.6 million US$ (the median price being at 6.5 million US$). However, as shown in Figure 2, there are substantial changes in the sale price over the period, reflecting the freight and commodity market supercycle between 2003 and the financial crisis in 2008. Not surprisingly, prices on the second-hand sale market are strongly correlated with freight market conditions, as represented by the one-year and three-year TC rate (expressed in US dollar per day) presented in Figure 2 (see Adland and Jia, 2015, for a mathematical model linking the two markets).
0 10 20 30 40 50 60 N um b er of t ran s ac ti o n s q1 -19 96 q1 -19 97 q1 -19 98 q1 -19 99 q1 -20 00 q1 -20 01 q1 -20 02 q1 -20 03 q1 -20 04 q1 -20 05 q1 -20 06 q1 -20 07 q1 -20 08 q1 -20 09 q1 -20 10 q1 -20 11 q1 -20 12 q1 -20 13 q1 -20 14 q1 -20 15 q1 -20 16 Quarter of sale
Figure 2. Sales prices and market indices, by quarter of sale
Source: authors’ calculations, data from Clarkson Research.
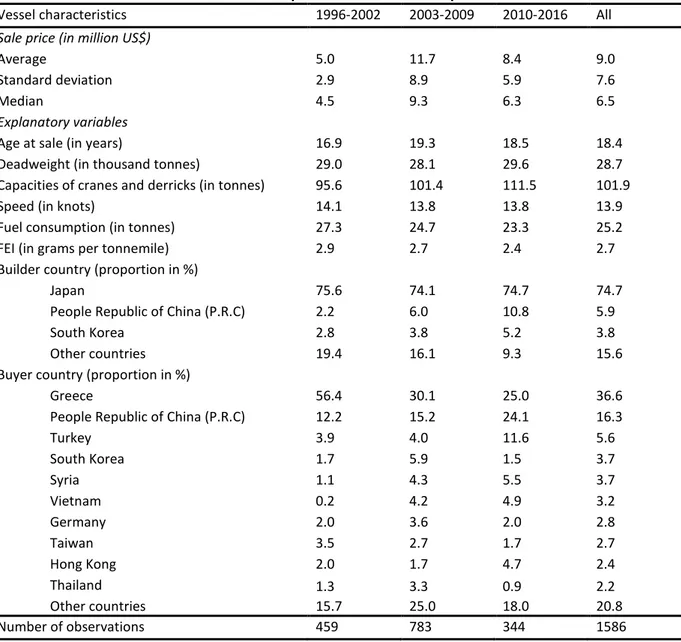
Besides market conditions, we expect the price of a Handysize bulker to be correlated with its technical specifications. In Table 1, we present descriptive statistics for the main vessel attributes in our transaction database. The average age at sale is 18.4 years, the average capacity is 28,688 DWT, the average capacities of cranes and derricks is 102 tonnes, and the average speed is 13.9 knots. We consider two different measures of vessel energy efficiency. First, standard fuel consumption measures fuel consumed per day at design speed and is equal to 25.2 tonnes on average. Second, we construct a fuel efficiency index (FEI) which also considers the size of the vessel and the design speed1. We find an average FEI of 2.7 grams of fuel per tonnemile. Finally, around three-quarters of Handysize bulkers were constructed in Japan while the two main countries in which second-hand vessels are purchased are Greece (36.6%) and China (16.3%).
1 The fuel efficiency index is defined as FEI = daily fuel consumption*1,000,000/(24*speed*DWT) and is
expressed in grams per tonnemile.
0 10000 20000 30000 40000 50000 T ime -ch a rt e r ra te (i n U S$ /d a y) 0 5 10 15 20 25 S al e pr ic e ( in m ill io n US $) q1 -19 96 q1 -19 97 q1 -19 98 q1 -19 99 q1 -20 00 q1 -20 01 q1 -20 02 q1 -20 03 q1 -20 04 q1 -20 05 q1 -20 06 q1 -20 07 q1 -20 08 q1 -20 09 q1 -20 10 q1 -20 11 q1 -20 12 q1 -20 13 q1 -20 14 q1 -20 15 q1 -20 16 Quarter of sale
Table 1. Descriptive statistics of the sample
Vessel characteristics 1996-2002 2003-2009 2010-2016 All
Sale price (in million US$)
Average 5.0 11.7 8.4 9.0
Standard deviation 2.9 8.9 5.9 7.6
Median 4.5 9.3 6.3 6.5
Explanatory variables
Age at sale (in years) 16.9 19.3 18.5 18.4
Deadweight (in thousand tonnes) 29.0 28.1 29.6 28.7
Capacities of cranes and derricks (in tonnes) 95.6 101.4 111.5 101.9
Speed (in knots) 14.1 13.8 13.8 13.9
Fuel consumption (in tonnes) 27.3 24.7 23.3 25.2
FEI (in grams per tonnemile) 2.9 2.7 2.4 2.7
Builder country (proportion in %)
Japan 75.6 74.1 74.7 74.7
People Republic of China (P.R.C) 2.2 6.0 10.8 5.9
South Korea 2.8 3.8 5.2 3.8
Other countries 19.4 16.1 9.3 15.6
Buyer country (proportion in %)
Greece 56.4 30.1 25.0 36.6
People Republic of China (P.R.C) 12.2 15.2 24.1 16.3
Turkey 3.9 4.0 11.6 5.6 South Korea 1.7 5.9 1.5 3.7 Syria 1.1 4.3 5.5 3.7 Vietnam 0.2 4.2 4.9 3.2 Germany 2.0 3.6 2.0 2.8 Taiwan 3.5 2.7 1.7 2.7 Hong Kong 2.0 1.7 4.7 2.4 Thailand 1.3 3.3 0.9 2.2 Other countries 15.7 25.0 18.0 20.8 Number of observations 459 783 344 1586
Source: authors’ calculations, data from Clarkson Research.
Figure 3 presents the time trends on a yearly basis for some of the vessels characteristics. Average age at the time of sale increases with year of sale essentially till 2008 (with a peak in 2011 at 24 years), but has strongly decreased since then. In the first quarter of 2016, the average age at sale was 9.9 years. This reflects in part a renewal of the fleet, with large volumes of new deliveries since 2008, but could also in part reflect preferences for more modern tonnage in the second-hand market. It could also reflect a greater share of distressed sales by owners who invested heavily in modern tonnage at the peak of the market. There is no clear time trend for vessel size in our transaction data, with average DWT varying between 27,500 and 30,000 tonnes. However, we can observe a significant increase in the cargo handling capacity of the vessels, with total capacity of cranes and derricks increasing from 85 tonnes in 1996 to 120 tonnes in 2016.
Figure 3. Trends in vessel characteristics, by year of sale
Source: authors’ calculations, data from Clarkson Research.
Handysize bulkers purchased on the second-hand market show modest variations in design speed over time, declining only marginally from 14.4 knots in 1996 to a range of 13.7-13.9 knots since 2004. Both fuel consumption and FEI exhibit a decreasing trend, reflecting an improvement in nominal energy efficiency, although we note a slowdown for fuel consumption at the end of the period. For instance, the average fuel consumption was around 29 tonnes per day in 1995 and 1996, 25 tonnes per day during the mid of the 2000s and 23 tonnes per day since 2012. This corresponds to a decrease of
10 15 20 25 A g e ( in y e ar s ) 19 96 19 97 19 98 19 99 20 00 20 01 20 02 20 03 20 04 20 05 20 06 20 07 20 08 20 09 20 10 20 11 20 12 20 13 20 14 20 15 20 16 Year of sale Age 25 27 29 31 33 D ea dw e igh t ( in t ho us a nd t o ns ) 19 96 19 97 19 98 19 99 20 00 20 01 20 02 20 03 20 04 20 05 20 06 20 07 20 08 20 09 20 10 20 11 20 12 20 13 20 14 20 15 20 16 Year of sale Deadweight 80 90 100 110 120 C ap ac it y ( in t o nn es ) 19 96 19 97 19 98 19 99 20 00 20 01 20 02 20 03 20 04 20 05 20 06 20 07 20 08 20 09 20 10 20 11 20 12 20 13 20 14 20 15 20 16 Year of sale Capacity of cranes/derricks 13.6 13.8 14.0 14.2 14.4 D es ig n s p ee d ( in k n ot s ) 19 96 19 97 19 98 19 99 20 00 20 01 20 02 20 03 20 04 20 05 20 06 20 07 20 08 20 09 20 10 20 11 20 12 20 13 20 14 20 15 20 16 Year of sale Design speed 22 24 26 28 30 F ue l c on s um pt io n ( in t on ne s pe r d ay ) 19 96 19 97 19 98 19 99 20 00 20 01 20 02 20 03 20 04 20 05 20 06 20 07 20 08 20 09 20 10 20 11 20 12 20 13 20 14 20 15 20 16 Year of sale Fuel consumption 2.2 2.4 2.6 2.8 3 3.2 3.4 F u el e ff ic ien c y i nd ex ( in gr am s pe r t o nn em ile) 19 96 19 97 19 98 19 99 20 00 20 01 20 02 20 03 20 04 20 05 20 06 20 07 20 08 20 09 20 10 20 11 20 12 20 13 20 14 20 15 20 16 Year of sale
around 18 percentage points over the period and is in line with the general decrease in design speed. The decrease is even higher for the FEI (56.0 percentage points), from 3.409 grams per tonnemile in 1996 to 2.185 grams per tonnemile in 2016, with the latter also accounting for the “economies of scale” in energy efficiency due to larger average vessel capacity.
By construction, the average level of fuel consumption which is presented in Figure 3 is the product of the average level of fuel consumption for a given year of construction by the proportion of vessels built that specific year in our sample2. Figure 4 presents the relationship between our two energy efficiency indices and the year of construction. We now find a U-shape profile for fuel consumption, with a strong decrease from the beginning of the 1970s (at around 35 tonnes per day) till the beginning of the 1990s (at around 20 tonnes per day) followed by a slight increase. This U-shape profile is due to the continuous increase in the average vessel size as larger vessel requires more power to achieve the same speed. This also explains the differing time trend of the FEI, which accounts for DWT in the denominator, and which decreased strongly till the mid-1980s and has remained rather stable since.
Figure 4. Vessel fuel consumption and FEI, by year of construction
Source: authors’ calculations, data from Clarkson Research.
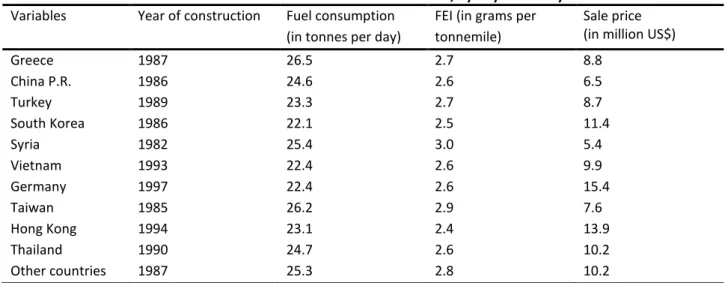
Most Handysize bulkers sold on the second-hand market were built in Japan (74.7%), followed by P.R.C. (5.9%) and South Korea (3.8%). The main buyers are found in Greece (36.6%) and China (16.3%). As reported in Table 2, the characteristics of vessels bought by shipowners located in Greece and in China are fairly similar. The vessels have an average year of construction around 1986-1987, their fuel consumption is 24.6-25.5 tonnes per day and their fuel efficiency at approximatively 2.6-2.7 grams per tonnemile. Across buyer countries, the 30 vessels bought by German interests are the youngest with
2 Let 𝑓𝑓
𝑖𝑖 the fuel consumption of a vessel 𝑖𝑖 and 𝑛𝑛 the number of transactions. The average level of fuel consumption
is 𝑓𝑓̅ =∑ 𝑓𝑓𝑖𝑖 𝑖𝑖
𝑛𝑛 . Let 𝑛𝑛𝑡𝑡 the number of vessels built in year 𝑡𝑡. It follows that 𝑓𝑓̅ =
∑ 𝑓𝑓𝑡𝑡 𝑡𝑡
𝑛𝑛𝑡𝑡
𝑛𝑛𝑡𝑡
𝑛𝑛 = 𝑓𝑓̅𝑡𝑡𝑠𝑠𝑡𝑡 with 𝑠𝑠𝑡𝑡 the share of
vessels constructed in year 𝑡𝑡 in our sample.
18 23 28 33 38 F ue l c on s um p ti on ( in t o nn e s p er da y ) 19 69 19 72 19 75 19 78 19 81 19 84 19 87 19 90 19 93 19 96 19 99 20 02 20 05 20 08 20 11 Year of construction Fuel consumption 2.00 2.50 3.00 3.50 4.00 4.50 F ue l ef fi c ie nc y in de x ( in gr a m s pe r ton ne m ile) 19 69 19 72 19 75 19 78 19 81 19 84 19 87 19 90 19 93 19 96 19 99 20 02 20 05 20 08 20 11 Year of construction
an average year of construction in 1997 and the highest sale value (15.4 million US$). The lowest sale values are observed for buyers from Syria (5.4 million US$), China (6.5 million US$) and Taiwan (7.6 million US$).
Table 2. Selected characteristics of transaction, by buyer country
Variables Year of construction Fuel consumption
(in tonnes per day)
FEI (in grams per tonnemile)
Sale price (in million US$)
Greece 1987 26.5 2.7 8.8 China P.R. 1986 24.6 2.6 6.5 Turkey 1989 23.3 2.7 8.7 South Korea 1986 22.1 2.5 11.4 Syria 1982 25.4 3.0 5.4 Vietnam 1993 22.4 2.6 9.9 Germany 1997 22.4 2.6 15.4 Taiwan 1985 26.2 2.9 7.6 Hong Kong 1994 23.1 2.4 13.9 Thailand 1990 24.7 2.6 10.2 Other countries 1987 25.3 2.8 10.2
Source: authors’ calculations, data from Clarkson Research.
4. Results from hedonic price regressions
We turn to a hedonic price equation framework à la Rosen (1974) to estimate the effect of fuel-efficiency on asset values. In the first-stage of Rosen’s model, the reported selling price of a vessel is regressed as a function of its attributes and market conditions. For the presentation, let ln 𝑃𝑃𝑖𝑖𝑡𝑡 be the logarithm of the price for transaction 𝑖𝑖 done on date 𝑡𝑡. Denoting by ln 𝐹𝐹𝑖𝑖𝑡𝑡 the logarithm of the fuel consumption (or alternatively the FEI), we estimate the following linear model:
ln 𝑃𝑃𝑖𝑖𝑡𝑡 = 𝛿𝛿 ln 𝐹𝐹𝑖𝑖𝑡𝑡+ 𝑋𝑋𝑖𝑖𝑡𝑡𝛽𝛽 + 𝜀𝜀𝑖𝑖𝑡𝑡 (1)
where 𝛿𝛿 is the parameter of interest (expressed as elasticity), 𝑋𝑋𝑖𝑖𝑡𝑡 is a set of control variables dealing with market conditions and vessel characteristics, 𝛽𝛽 is a vector of coefficients to estimate, and 𝜀𝜀𝑖𝑖𝑡𝑡 is a residual perturbation with 𝐸𝐸(𝜀𝜀𝑖𝑖𝑡𝑡) = 0. Focusing first on the mean level of the dependent variable, we estimate (1) using Ordinary Least Squares. Since some vessels have been transacted repeatedly over the period (representing 28.6% of total transactions), we cluster standard errors at the vessel level3. In addition to fuel consumption, we control for the following explanatory variables when investigating the sale price. First, we account for market conditions using the logarithm of the one-year TC rate as proxy. This is a common approach in the literature on vessel valuation due to the strong positive correlation between the TC rate and sale price (Adland and Koekebakker, 2007). Second, we introduce information on the most important attributes of Handysize bulkers: vessel age at sale, deadweight tonnes, capacities of cranes/derricks, design speed and builder country. We also consider the number of times the vessel has been sold before the current transaction. For each continuous covariate, we rely on a quadratic profile to account for possible non-linearity (except for capacities of cranes/derricks).
In our linear regression framework, a potential concern is related to the fact that market cycle and age are not necessarily separable additive functions. For instance, we expect the asset value depreciation
3 The sample comprises 1,133 distinct vessels: 790 have been transacted only once (69.7%), 257 twice (22.7%),
to be lower with a longer economic life of the ship when markets are booming. Adland and Koekebakker (2007) solve this concern by estimating a multivariate nonparametric function of age, DWT and the TC rate. In our parametric framework, we add an interaction term corresponding to the product of the TC rate and age at sale. Finally, we account for the country of domicile of the buyer using a set of country dummies. In doing so, we attempt to control for differences across buyer countries with regards to, for instance, their willingness-to-pay for second-hand vessels and the environmental awareness within a given country.
Results for four different specifications are presented in Table 3. In a first step (column 1), we only account for the role of market conditions with the one-year TC rate as control variable. We find a positive correlation which is highly statistically significant and the elasticity of TC rate to the sale price is 0.853 (with t=29.00). Furthermore, variations in TC rate explain one-third of variation in sale prices (R²=0.33), which is substantial. As an alternative of this first result, we can also control for market conditions by considering a broader specification with quarter dummies rather than the time-charter rate as control variables. The time fixed effects are expected to pick up the influence of time-charter rate as well as that of other factors (either observed or unobserved) affecting supply and demand on the second-hand market for bulkers. Adland et al. (2017c) propose a similar specification to account for market conditions in the spot market for offshore vessels.
Let 𝕝𝕝𝑖𝑖𝑡𝑡 be a set of quarter dummies and ln 𝑇𝑇𝑇𝑇𝑖𝑖𝑡𝑡 the logarithm of the TC rate. In a first stage, we estimate the hedonic price function ln 𝑃𝑃𝑖𝑖𝑡𝑡 = ∑ 𝛾𝛾𝑡𝑡𝕝𝕝𝑖𝑖𝑡𝑡+ 𝜀𝜀𝑖𝑖𝑡𝑡. We find a slightly higher explanatory power for the quarter dummies, with an R² equal to 0.3914. Then, we estimate a second-stage regression explaining the estimated quarter fixed effects as a function of the average TC rate calculated for each quarter such that 𝛾𝛾�𝑡𝑡 = 𝜗𝜗 ln 𝑇𝑇𝑇𝑇𝑖𝑖𝑡𝑡+ 𝜁𝜁. The estimated coefficient 𝜗𝜗 is equal to 0.839 and the R² is now equal to 0.806. This means that four-fifth of the time variation of price sales is imputable to changes in the TC rate, confirming that the TC rate is a very good proxy for changes in market conditions.
Next, we introduce vessel characteristics in the regression (column 2). The R² is now equal to 0.902, suggesting that market conditions and vessel attributes contribute to about one-third and two-thirds of variations in sale price, respectively. If we only introduce the TC rate and age in the regression, we find a value of 0.847 for the R² meaning that age is the dominant factor among vessel characteristics. Compared to column 1, the elasticity associated to the TC rate is substantially lower (0.568 against 0.863). The relationship between ship values and age is negative, reflecting decreasing remaining earnings potential as the vessel approaches the end of its life. However, the positive estimate for the second-order age term suggests that the average depreciation curve is slightly convex5. Adland and Koekebakker (2007) find a similar relationship and argue that this is due to the lower bound represented by the scrap value of a vessel.
4 The detailed results are available upon request.
Table 3. Estimates of the log sale price of Handysize vessels
Variables (1) (2) (3) (4)
Log of fuel consumption (in tonnes per day) -0.387*** (-9.32)
Log of FEI (in grams per tonnemile) -0.385*** (-9.21) Log of one-year TC rate (in US$ per day) 0.853*** 0.568*** 0.624*** 0.624***
(29.00) (7.93) (9.23) (9.23) Age at sale (in years) -0.446*** -0.363*** -0.364***
(-4.87) (-4.23) (-4.24) Age at sale squared /100 (in years) 0.617** 0.412 0.415
(2.25) (1.61) (1.62) Age at sale in years x log of TC rate 0.042*** 0.033*** 0.033***
(4.27) (3.57) (3.58) Age at sale in years squared /100 x log of TC rate -0.073** -0.050* -0.050*
(-2.53) (-1.83) (-1.84) Number of times sold before current purchase 0.047*** 0.034*** 0.034***
(5.48) (4.16) (4.13) Deadweight (in thousand tons) 0.038*** 0.056*** 0.024***
(3.93) (5.97) (2.62) Deadweight squared /100 (in thousand tons) -0.026 -0.050*** -0.019
(-1.60) (-3.14) (-1.20) Speed (in knots) 0.439*** 0.434*** 0.382***
(3.12) (3.01) (2.63) Speed squared /100 (in knots) -1.693*** -1.513*** -1.428***
(-3.33) (-2.85) (-2.68) Capacities of cranes/derricks / 100 (in tonnes) 0.101*** 0.090*** 0.090***
(3.41) (3.23) (3.21) Builder country Japan 0.058*** 0.008 0.007 (ref: other countries) (2.64) (0.34) (0.33)
P.R.C. -0.063** -0.073** -0.074**
(-1.96) (-2.24) (-2.25)
S. Korea 0.044 -0.007 -0.009
(1.04) (-0.18) (-0.21) Buyer country Greece -0.056*** -0.049*** -0.049*** (ref: other countries) (-3.18) (-2.86) (-2.85)
China P.R. -0.017 -0.035* -0.035* (-0.78) (-1.68) (-1.66) Turkey 0.031 0.017 0.017 (1.02) (0.56) (0.58) South Korea -0.070** -0.086*** -0.085*** (-2.22) (-2.70) (-2.66) Syria 0.043 0.037 0.037 (1.00) (0.93) (0.93) Vietnam 0.033 0.017 0.017 (0.96) (0.52) (0.50) Germany -0.018 -0.021 -0.023 (-0.55) (-0.73) (-0.80) Taiwan -0.109*** -0.096*** -0.096*** (-2.79) (-2.60) (-2.60) Hong Kong 0.063* 0.044 0.044 (1.94) (1.51) (1.53) Thailand -0.232*** -0.236*** -0.236*** (-4.76) (-4.98) (-5.00) Constant -6.044*** -5.876*** -5.747*** -5.403*** (-22.07) (-5.02) (-4.73) (-4.42) Number of observations 1,586 1,586 1,586 1,586 R² 0.332 0.902 0.909 0.909
Source: authors’ calculations, data from Clarkson Research. Note: estimates from linear models, with standard errors clustered at the vessel level. Significance levels are 1% (***), 5% (**) and 10% (*).
The number of times a vessel has been purchased previously on the second-market, which may be considered as an indicator of demand for that specific vessel, has a positive effect on price. The relationship between deadweight and price is significantly positive. Buyers are obviously expected to pay more for vessels with higher transportation capacities because they obtain higher daily earnings all else equal (Köhn and Thanopoulou, 2011; Adland et al., 2017b), but we note that the effect is non-linear with a decreasing rate of increase per DWT as the vessel size gets larger. A similar effect is found in the non-parametric vessel value model of Adland and Koekebakker (2007). This could be related to the non-linearity sometimes observed with regards to DWT utilization (Adland et al., 2016b), where vessels whose size is far away from the fleet average have lower utilization due to the standardization of cargo sizes.
The sale price is positively correlated to the design speed, though again we observe a negative second-order term for design speed6. This suggests that the gain in asset value attributable to higher design speed is decreasing. It is likely that very high design speeds cannot be easily utilized in practice, for instance due to adverse weather conditions or lower contractual speeds, such that this vessel attribute has a relatively lower incremental value to the operator. A higher total capacity of cranes and derricks has a positive impact on second-hand values. Vessels characterized by high discharge speed will be able to save time in ports and are thus more profitable. Compared to other countries, vessels built in Japan are 6.0 percentage points more expensive on average while those built in P.R.C. are 6.1 percentage points cheaper, reflecting perceived differences in build quality7. Concerning buyer effects, we observe that prices are significantly lower when buyers are located either in Greece, South Korea, Taiwan or Thailand compared to other countries, possibly reflecting the opportunistic “asset play” strategies often followed by shipowners in, for instance, Greece.
In columns 3 and 4, we examine the effect of energy-efficiency by introducing the fuel consumption and the FEI as control variables, respectively. In both cases, the correlation is statistically significant and negative, but we also note that accounting for energy-efficiency adds little to the R². On average, a one-percent decrease in fuel consumption is associated with an increase of 0.4 percentage points in sale price. The energy-efficiency elasticity is almost the same for fuel consumption and FEI. As this negative correlation is the central result of our paper, we next implement several robustness checks. First, we have to account for the possibility that our estimated relationship is affected by unobserved heterogeneity. If there are some variables that have an influence on sale prices but are omitted, then our estimation of 𝛿𝛿 will be biased in an unknown direction (either upward or downward). Since we have repeated sales for some vessels, we turn to panel data models. Specifically, considering equation (1), we decompose the residual term 𝜀𝜀𝑖𝑖𝑡𝑡 such that 𝜀𝜀𝑖𝑖𝑡𝑡 = 𝜑𝜑𝑖𝑖+ 𝜔𝜔𝑖𝑖𝑡𝑡 where 𝜑𝜑𝑖𝑖 is an unobserved vessel-specific component. A first solution to obtain an unbiased estimate of 𝛿𝛿 is to rely on a between estimator. For each vessel, the average sale price ln 𝑃𝑃�𝑖𝑖 = ∑ ln 𝑃𝑃𝑡𝑡 𝑖𝑖𝑡𝑡 is regressed as a function of the time-invariant fuel consumption ln 𝐹𝐹𝑖𝑖 and the time-average 𝑋𝑋�𝑖𝑖 of 𝑋𝑋𝑖𝑖𝑡𝑡. In doing so, we find an estimated coefficient of -0.399 for fuel consumption and of -0.397 for the FEI. Both estimates are very close to those reported in columns 3 and 4 of Table 3. Another solution that accounts for unobserved heterogeneity is a two-stage estimation strategy. In a first step, we estimate the model ln 𝑃𝑃𝑖𝑖𝑡𝑡 = 𝑋𝑋𝑖𝑖𝑡𝑡𝛽𝛽 + 𝜑𝜑𝑖𝑖+ 𝜀𝜀𝑖𝑖𝑡𝑡 using a fixed effect estimator. By construction, all variables that are time-invariant are included in the fixed effect and the corresponding coefficients are not identified. This is the case in our context for fuel consumption 𝐹𝐹𝑖𝑖𝑡𝑡 which does not change for a given vessel. In a second step, we regress the estimated fixed effect 𝜑𝜑�𝑖𝑖 as a function of ln 𝐹𝐹𝑖𝑖. We obtain a coefficient equal to -0.132 for fuel consumption which is highly significant (𝑡𝑡 = −3.99). The coefficient for the FEI is much higher in
6 The optimal speed which maximizes the sale price is 13.0 knots, which is slightly below the average speed in
our sample of transactions (13.9 knots).
7 Since the dependent variable is the logarithm of the price, the marginal effect of a dummy variable whose
absolute value, equal to -0.698 (𝑡𝑡 = −23.74). Overall, we conclude that our results remain robust when controlling for unobserved heterogeneity at the vessel level.
Second, we account for a potential non-linear effect of energy-efficiency over prices. Rather than considering a parametric specification for fuel consumption, we turn to a semi-parametric model such that both TC rate and other vessels attributes enter the regression in a parametric way as in Table 3, while fuel consumption (or FEI) enters the model nonlinearly. For that purpose, we rely on the double residual estimator originally proposed in Robinson (1988) and consider a kernel weighted local polynomial fit for the nonparametric estimator. We find a monotonously decreasing relationship between sale price and fuel consumption such that the shape of the curve appears almost linear. The profile is very similar for the FEI, with some slight changes in the shape of the curve for large values of the index8.
Third, we investigate whether the energy-efficiency premium varies along the distribution of vessel prices. For instance, bulkers with low sale prices may reflect less attractive tonnage transacted during poor market conditions when investors are more conscious about energy efficiency, while high-priced vessels should mainly reflect sales of modern tonnage during booming markets and when energy efficiency is found to matter less, at least in the pricing of TC rates (Adland et al., 2017b). Consequently, we expect that the elasticity of asset values with regards to energy efficiency is decreasing (in absolute value) with increasing vessel values.To account for this configuration, we rely on quantile regressions which provide estimates of the marginal effect of covariates at various locations in the distribution of the dependent variable (Koenker and Bassett, 1978). Quantile regressions provide robust estimates, particularly with respect to misspecification errors related to heteroskedasticity. Let 𝑞𝑞𝜃𝜃(ln 𝑃𝑃𝑖𝑖𝑡𝑡) the 𝜃𝜃th conditional quantile of the logarithm of sale price. The model that we estimate is now:
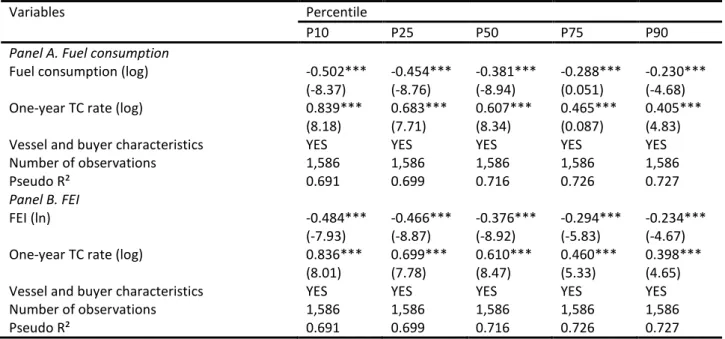
𝑞𝑞𝜃𝜃(ln 𝑃𝑃𝑖𝑖𝑡𝑡) = 𝛿𝛿(𝜃𝜃) ln 𝐹𝐹𝑖𝑖𝑡𝑡+ 𝑋𝑋𝑖𝑖𝑡𝑡𝛽𝛽(𝜃𝜃) + 𝜀𝜀𝑖𝑖𝑡𝑡 (2) where 𝛿𝛿(𝜃𝜃) provides the effect of fuel consumption at the 𝜃𝜃th quantile of the price distribution. In our empirical analysis, we estimate the log sale price as a function of energy efficiency at the 10th, 25th, 50th, 75th and 90th percentile of the price distribution. We present results from quantile regressions in Table 4, where we only report the coefficient obtained for the one-year TC rate and for energy efficiency variables.
As expected, the main result is that the coefficient associated with fuel consumption tends to decrease (in absolute value) as we move up along the distribution of sale prices9. At the 10th percentile, the price-fuel consumption elasticity is estimated at -0.502, while it is equal to -0.381 at the median and -0.230 at the 90th percentile (panel A). Results are very similar for the FEI (panel B, Table 4). In absolute values, the corresponding elasticity is more than twice as high at the bottom of the distribution (-0.484 at the 10th percentile) than at the top (-0.234 at the 90th percentile).
8 These additional curves are available upon request.
9 Another interesting result from Table 3 is that the coefficient associated to the TC rate decreases along the
Table 4. Estimates of the log sale price of Handysize vessels along the price distribution
Variables Percentile
P10 P25 P50 P75 P90
Panel A. Fuel consumption
Fuel consumption (log) -0.502*** -0.454*** -0.381*** -0.288*** -0.230***
(-8.37) (-8.76) (-8.94) (0.051) (-4.68)
One-year TC rate (log) 0.839*** 0.683*** 0.607*** 0.465*** 0.405***
(8.18) (7.71) (8.34) (0.087) (4.83)
Vessel and buyer characteristics YES YES YES YES YES
Number of observations 1,586 1,586 1,586 1,586 1,586
Pseudo R² 0.691 0.699 0.716 0.726 0.727
Panel B. FEI
FEI (ln) -0.484*** -0.466*** -0.376*** -0.294*** -0.234***
(-7.93) (-8.87) (-8.92) (-5.83) (-4.67)
One-year TC rate (log) 0.836*** 0.699*** 0.610*** 0.460*** 0.398***
(8.01) (7.78) (8.47) (5.33) (4.65)
Vessel and buyer characteristics YES YES YES YES YES
Number of observations 1,586 1,586 1,586 1,586 1,586
Pseudo R² 0.691 0.699 0.716 0.726 0.727
Source: authors’ calculations, data from Clarkson Research.
Note: estimates from quantile regression models. Significance levels are 1% (***), 5% (**) and 10% (*). The full set of explanatory variables is described in Table 3.
Fourth, we investigate whether there is any variation in the relationship between sale price and fuel consumption over the period. Time-variations in the intensity of the elasticity support at least two explanations. On the one hand, the sensitivity of buyers to fuel consumption may depend on the oil price and, more generally, demand conditions. Such effect will essentially be controlled for through the inclusion of the TC rate as explanatory variable. On the other hand, preferences may have changed, especially at the end of the period, due to an increased focus on policy risk and more stringent regulations on emissions from ships. We note here that the relationship between vessel earnings, or TC rates, and oil or fuel prices is not obvious a priori. Adland et al. (2017b) find that higher fuel prices have a negative impact on TC rates, suggesting that some of the additional fuel costs are indirectly passed on to the shipowner. At the same time, the oil price can often be taken as a proxy for general economic activity, such that higher fuel prices may be positively correlated with the demand for seaborne transportation and shipping assets. To assess whether the elasticity of fuel consumption depends on time, we estimate the following regression:
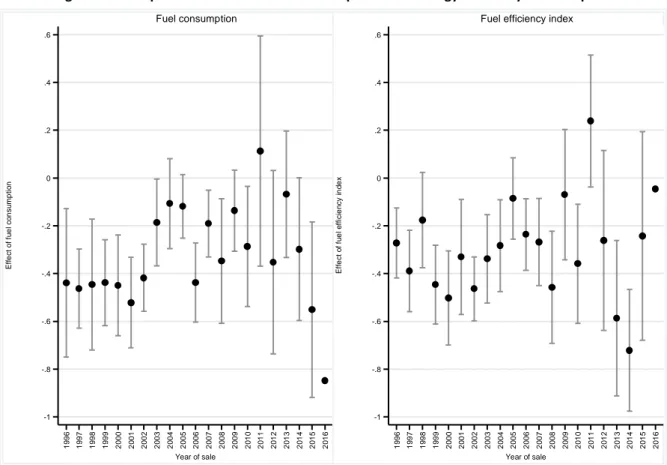
ln 𝑃𝑃𝑖𝑖𝑡𝑡 = ∑ 𝛾𝛾𝑡𝑡𝕝𝕝𝑖𝑖𝑡𝑡+ ∑ 𝜏𝜏𝑡𝑡𝕝𝕝𝑖𝑖𝑡𝑡ln 𝐹𝐹𝑖𝑖𝑡𝑡 + 𝑋𝑋𝑖𝑖𝑡𝑡𝛽𝛽 + 𝜀𝜀𝑖𝑖𝑡𝑡 (3) where the 𝕝𝕝𝑖𝑖𝑡𝑡 are year-specific dummies. The parameters of interest are now the set of coefficients 𝜏𝜏𝑡𝑡 associated to the interaction terms crossing the logarithm of the fuel consumption and the year-specific dummies. If the elasticity of fuel consumption remains time-invariant, then the various coefficients 𝜏𝜏𝑡𝑡 should be equal. To make the interpretation easier, Figure 5 plots the year-specific coefficients 𝜏𝜏𝑡𝑡 along with their 95% confidence interval for fuel consumption and FEI, respectively.
Figure 5. Year-specific effects of the relationship between energy-efficiency and sale price
Source: authors’ calculations, data from Clarkson Research.
Note: estimates from linear regressions, with 95% confidence interval. The full set of explanatory variables is described in Table 3. We do not report the confidence interval for the year 2016 because of the low number of transactions for that year (N=10).
We note the general reduction (in absolute terms) in the influence of energy efficiency on asset values during the drybulk market boom in 2003 - 2008, from negative and mainly significant values pre-2003. This is in line with the recent findings in the empirical literature on energy efficiency premia in the drybulk freight market (Adland et al, 2017b), where energy efficiency is found to matter only during normal (or poor) market conditions. The picture from 2011 onwards is less clear, principally because of differing time trends between our two energy-efficiency indicators. While the FEI exhibits the largest observed (negative) elasticity in 2013 and 2014, the fuel consumption elasticity reaches a low point in 2015/2016. We are therefore not able to conclude unequivocally that the increased focus on energy efficiency and environmental policy risk in shipping in recent years has had a clear impact also among investors in the second-hand market for ships.
5. Concluding comments
In this paper, we have investigated how the technical energy efficiency of a vessel affects its value in the second-hand market. We find that energy efficiency is a significant determinant of asset values, with higher energy efficiency increasing sale prices. Moreover, we show that this effect is robust and holds across the range of observed vessel values as well as across time. A general finding is that the elasticity of energy efficiency is larger (in absolute terms) for low asset values, which typically refers to transactions of old vessels and/or transactions taking place in poor markets. This is in line with recent empirical research on fixture data which also finds market dependency in the impact of energy efficiency. -1 -.8 -.6 -.4 -.2 0 .2 .4 .6 E ff e c t of f ue l c on s um p ti on 19 96 19 97 19 98 19 99 20 00 20 01 20 02 20 03 20 04 20 05 20 06 20 07 20 08 20 09 20 10 20 11 20 12 20 13 20 14 20 15 20 16 Year of sale Fuel consumption -1 -.8 -.6 -.4 -.2 0 .2 .4 .6 E ff e c t of f ue l ef fi c ie nc y in de x 19 96 19 97 19 98 19 99 20 00 20 01 20 02 20 03 20 04 20 05 20 06 20 07 20 08 20 09 20 10 20 11 20 12 20 13 20 14 20 15 20 16 Year of sale
While the impact of energy efficiency is the core result of our work, we also bring new insights to the emerging literature on the microeconomic pricing of second-hand vessels. Notably, we broaden the number of variables from the limited DWT, age and TC rates in the non-parametric study of Adland and Koekebakker (2007) to include a wide variety of technical specifications, country of build, buyer country and the number of previous sales. Particularly interesting is the observation that a vessel with previous reported transactions obtains a higher sales price. This is relevant for the well-known “lemon problem” of second-hand markets in economics as discussed in Akerlof (1970). In our context, one possible interpretation is that the number of previously reported transactions is a signal of attractiveness and quality, or at the very least that other investors have inspected a vessel and found it a suitable candidate, thus reducing the information asymmetry.
We note that the link between the pricing of energy efficiency in freight rates in the literature (Agnolucci et al., 2014, Adland et al., 2017b) and the impact on asset values is not straightforward. There are two main reasons for this. First, asset values reflect the expected fuel savings (and/or gains in TC rates) and impact of policy risk over the remaining life of the ship and not just contemporaneous fuel prices and TC rates. Second, asset values reflect expectations about the future contract mix and corresponding allocation of fuel savings between owners and charterers, as well as related time-varying risks such as vessel unemployment risk and charter default risk. It follows that our findings of an energy efficiency premium also in asset values are, in some sense, more robust.
However, some of the criticism against studies on the impact of energy efficiency on freight rates is also valid in our case. Most importantly, all existing studies consider nominal energy efficiency only (i.e. design values for fuel consumption and speed under idealized conditions). There are two problems with this. First, actual operational energy-efficiency depends on how the ship is run, which refers to the chosen sailing speed. Indeed, it is possible to employ a ship that is nominally inefficient in an energy efficient way. Second, the true energy efficiency of ships is heavily influenced by weather conditions and hull fouling. This kind of information is not easily observable to ship investors. Accordingly, given that investors are facing asymmetric or even incomplete information, there is a risk that the true operational energy efficiency in the seaway is not fully represented in asset values. If investors are risk averse, this should mean that the value of energy efficiency is discounted by the market. Accordingly, the fact that we find robust empirical evidence of an energy efficiency premium/discount is encouraging. Future research in this area should expand the empirical investigation on energy efficiency and asset values to other sectors of the shipping markets to verify the general applicability of our findings.
References
Adland, R., Cariou, P., and Wolff, F.C. (2016a), The influence of charterers and owners on bulk shipping freight rates, Transportation Research Part E: Logistics and Transportation Review, vol. 86, pp. 69-82. Adland, R., Jia, H. and Strandenes, S.P. (2016b), The determinants of vessel capacity utilization: the case of Brazilian iron ore exports, Transportation Research Part A: Policy and practice, doi: 10.1016/j.tra.2016.11.023
Adland, R., Fonnes, G., Jia, H., Lampe, O.D., Strandenes, S.P. (2017a): The impact of regional environmental regulations on empirical vessel speeds, Transportation Research Part D: Transportation and the environment, vol. 53, pp. 37-49.
Adland, R., Alger, H., Banyte, J. and Jia, H. (2017b), Does fuel efficiency pay? Empirical evidence from the drybulk time-charter market revisited, Transportation Research Part A: Policy and Practice, vol. 95, pp. 1-12.
Adland, R., Cariou, P. and Wolff, F.C. (2017c), What makes a freight market index? An empirical analysis of vessel fixtures in the offshore market, Transportation Research Part E: Logistics and Transportation Review, vol. 104, pp. 150-164.
Adland, R. and Jia, H. (2015), Shipping market integration – the case of sticky newbuilding prices, Maritime Economics and Logistics, vol. 17(4), pp. 389-398.
Adland, R. and Koekebakker, S. (2007), Ship valuation using cross-sectional sales data, Maritime Economics and Logistics, vol. 9, pp. 105- 118.
Agnolucci, P., Smith, T. and Rehmatulla, N. (2014), Energy efficiency and time charter rates: Energy efficiency savings recovered by ship owners in the Panamax market. Transportation Research Part A: Policy and Practice, vol. 66, pp. 173-184.
Akerlof, G.A. (1970), The market for “Lemons”: Quality uncertainty and the market mechanism. The Quarterly Journal of Economics, vol. 84, pp. 488-500.
Alizadeh, A.H., Talley, W.K. (2011a), Vessel and voyage determinants of tanker freight rates and contract times. Transport Policy, vol. 18(5), pp. 665-675.
Alizadeh, A. H., and Talley, W. K. (2011b) Microeconomic determinants of dry bulk shipping freight rates and contract times. Transportation, vol. 38(3), pp. 561-579.
Bates, T.H. (1969), A linear regression model of ocean tramp rates, Transportation Research, vol. 3, pp. 377-395.
Blumstein, C., Krieg, B., Schipper, L., York, C. (1980), Overcoming social and institutional barriers to energy conservation, Energy, vol. 5, pp. 355-371.
Clarkson Research (2017), Shipping Intelligence Network database, www.clarksons.net.
Dick, van D., Haralambides, H.E., and Veenstra, A.W. (1998), Modelling of ocean charter rates; an investigation into non-linearity and parameters. In: 8th World Conference on Transport Research (WCTR), Antwerp, Belgium, July 1998.
Drobetz, W., Haller, R. and Meier, I. (2016), Cash flow sensitivities during normal and crisis times: Evidence from shipping, Transportation Research Part A: Policy and Practice, vol. 90, pp. 26-49. Faber, J., Markowska, A., Nelissen, D., Davidson, M., Eyring, V., Cionni, I., Selstad,E., Kågeson, P., Lee, D., Buhaug, Ø., Lindstad, H., 2009. Technical support for European action to reducing greenhouse gas emissions from international maritime transport. CEDelft,
http://ec.europa.eu/clima/policies/transport/shipping/docs/ghg_ships_report_en.pdf
Fisher, A. and Rothkopf, M. (1989), Market failure and energy policy, Energy Policy, vol. 17(4), pp. 397-406.
Fuerst, F. and McAllister, P. (2011), The impact of Energy Performance Certificates on the rental and capital values of commercial property assets, Energy Policy, vol. 39(10), pp. 6608- 6614.
Hermeling, C., Klement, J.H., Koesler, S.; Köhler, J. And Klement, D. (2015), Sailing into a dilemma: An economic and legal analysis of an EU trading scheme for maritime emissions, Transportation Research Part A: Policy and Practice, vol. 78, pp. 34- 53.
Howarth, R. and Winslow, M. (1994), Energy use and CO2 emission reduction: integrating pricing and regulatory policies, Energy, vol. 19(8), pp. 855-867.
Koenker, R. and Bassett, G. (1978), Regression Quantiles, Econometrica, vol. 46, pp. 33-50.
Köhn, S. and Thanopoulou, H. (2011), A GAM Assessment of quality premia in the drybulk timecharter market. Transportation Research Part E: Logistics and Transportation Review, vol. 47, pp. 709-721.
Lee, T.-C., Chang, Y.-T. and Lee, P.T.W. (2013), Economy-wide impact analysis of a carbon tax on international container shipping, Transportation Research Part A: Policy and Practice, vol. 58, pp. 87-102.
Mitchell, J. and Rehmatulla, N. (2015), Dead in the water: an analysis of industry practices and perceptions on vessel efficiency and stranded ship assets, 2nd Shipping in Changing Climates conference 2015, 24th-26th November 2015, Glasgow.
Prakash, V, Smith, T, Rehmatulla, N, Mitchell, J and Adland, R. (2016), Revealed preferences for energy efficiency in the shipping markets,
http://www.lowcarbonshipping.co.uk/files/ucl_admin/Revealed_preferences_for_energy_efficiency
_in _shipping_markets.pdf.
Raucci, C., Prakash, V., Rojon, I., Smith, T., Rehmatulla, N. and Mitchell, J. (2017), Navigating Decarbonisation: An approach to evaluate shipping’s risks and opportunities associated with climate change mitigation policy, UMAS, London.
Rehmatulla, N. and Smith, T. (2015a), Barriers to energy efficient and low carbon shipping, Ocean Engineering, vol. 110, pp. 102-112.
Rehmatulla, N. and Smith, T. (2015b), Barriers to energy efficiency in shipping: A triangulated approach to investigate the principal agent problem, Energy Policy, vol. 84, pp. 44-57.
Robinson, P. (1988), Root- N-Consistent Semiparametric Regression, Econometrica, vol. 56, pp. 931-954.
Rosen, S. (1974), Hedonic prices and implicit markets: Product differentiation in pure competition, Journal of Political Economy, vol. 82, pp. 34-55.
Smith, T. W. P., Jalkanen, J. P., Anderson, B. A., Corbett, J. J., Faber, J., Hanayama, S., O’Keeffe, E., Parker, S., Johansson, L., Aldous, L.; Raucci, C., Traut, M., Ettinger, S., Nelissen, D., Lee, D. S., Ng, S., Agrawal, A., Winebrake, J. J., Hoen, M., Chesworth, S. and Pandey, A. (2015). Third IMO GHG Study. International Maritime Organization (IMO) London, UK.
Sorrel, S., Schleich, J., Scott, S., O’Malley, E., Trace, F., Boede, U., Ostertag, K., and Radgen, P., 2000. Barriers to energy efficiency in public and private organizations, Final report, SPRU—Science and Technology Policy Research, University of Sussex, Brighton, UK.
Stopford, M. (2009), Maritime economics, Routledge: London.
Tamvakis, M.N. (1995), An investigation into the existence of a two-tier spot freight market for crude oil tankers. Maritime Policy and Management, vol. 22, pp. 81-90.
Tamvakis, M.N., Thanopoulou, H.A. (2000), Does quality pay? The case of the dry bulk market. Transportation Research Part E: Logistics and Transportation Review, vol. 36, pp. 297-307.
Wang, K., Fu, X. and Luo, M. (2015), Modeling the impacts of alternative emission trading schemes on international shipping, Transportation Research Part A: Policy and Practice, vol. 77, pp. 35-49.