Who Gets a Swiss Passport? A Natural Experiment in
Immigrant Discrimination
JENS HAINMUELLER
Massachusetts Institute of Technology
DOMINIK HANGARTNER
London School of Economics & University of Zurich
W
e study discrimination against immigrants using microlevel data from Switzerland, where, until recently, some municipalities used referendums to decide on the citizenship applications of foreign residents. We show that naturalization decisions vary dramatically with immigrants’ attributes, which we collect from official applicant descriptions that voters received before each referen-dum. Country of origin determines naturalization success more than any other applicant characteristic, including language skills, integration status, and economic credentials. The average proportion of “no” votes is about 40% higher for applicants from (the former) Yugoslavia and Turkey compared to observ-ably similar applicants from richer northern and western European countries. Statistical and taste-based discrimination contribute to varying naturalization success; the rewards for economic credentials are higher for applicants from disadvantaged origins, and origin-based discrimination is much stronger in more xenophobic municipalities. Moreover, discrimination against specific immigrant groups responds dynamically to changes in the groups’ relative size.I
mmigration has emerged as a divisive political is-sue in many countries in recent decades. One of the most controversial debates over immigration policy involves the integration of already-settled mi-grants and, in particular, their access to citizenship.1 In the U.S., there are heated debates about restrict-ing birthright citizenship for children of unauthorized immigrants.2 Throughout Europe, right-wing parties use citizenship policies as a vehicle to mobilize vot-ers against immigration with campaigns that emphasize the societal dangers of naturalizing increasing numbers of immigrants (Dancygier 2010; Helbling 2008; Howard 2009). These groups reject the integration offoreign-Jens Hainmueller is Associate Professor, Department of Polit-ical Science, 77 Massachusetts Avenue, Cambridge, MA 02139 ([email protected]).
Dominik Hangartner is Lecturer, Department of Methodology, Houghton Street, London WC2A 2AE, and Institute of Political Science, Affolternstrasse 56, 8050 Zurich ([email protected]).
This article received the 2012 Robert H. Durr Award from the Midwest Political Science Association for “the best paper apply-ing quantitative methods to a substantive problem.” We thank Ken Benoit, Suzanne Berger, Adam Berinsky, Catherine De Vries, Marc Girardelli, Marc Helbing, Gabe Lenz, Rick Locke, Ben Rissig, Di-dier Ruedin, Lily Tsai, the editors, four anonymous reviewers, and participants in seminars at Princeton, Harvard, Stanford, MIT, the University of Bern, the European University Institute, and the Mid-west Political Science Meeting for helpful comments. For excellent research assistance, we thank Andreas Besmer, Matthias Christen, Roman Kuster, Fabian Morgenthaler, Emilia Pasquier, Giuseppe Pietrantuono, Rocco Pietrantuono, Livio Raccuia, Mirjam R ¨utsch, Laura Schmid, and Tess Wise. We especially would like to thank Marco Steenbergen for his valuable support and all the munici-pality officials for participating in our survey. Funding for this re-search was generously provided by Swiss National Science Grant No. 100017_132004. The usual disclaimer applies.
1The supplementary online appendices A, B, and C for this article are posted on the authors’ home page at http://www.mit.edu/jhainm/ Paper/passportappendix.pdf .
2See, for example, Marc Lacey, “Birthright Citizenship Looms as Next Immigration Battle,” The New York Times, January 4, 2011. Julia Preston, “Citizenship From Birth Is Challenged on the Right,”
The New York Times, August 6, 2010.
ers as citizens because they view immigrants as unde-serving outsiders who poach jobs from native workers, unsettle local communities, and undermine traditional values; such outsiders should not be rewarded with equal access to the political and social rights of the host country (Brubaker 1989; Givens 2007; Koopmans et al. 2005). Intense debates over naturalization poli-cies are likely to escalate further in the years ahead in light of increased migration flows; immigrants already account for about 10% of the population across ad-vanced industrialized countries (Dumont, Spielvogel, and Widmaier 2010).
Why do some natives oppose and others favor im-migration and naturalization of immigrants? Do na-tives discriminate against particular types of immi-grants, and if so, which immigrants are welcomed and which immigrants are rejected? A large body of lit-erature has examined attitudes toward immigration in Europe, the U.S., and several other countries, but scholars still disagree about the prevalence and causes of anti-immigrant sentiment (Ceobanu and Escandell 2010; Hainmueller and Hopkins 2012). One important limitation of existing research is the absence of de-tailed behavioral data on anti-immigrant sentiment. Most published studies to date are based on attitu-dinal measures from public opinion surveys, which have their merits, but also impose important limits on the inferences we can draw. For example, most existing surveys are fairly blunt instruments that ask respondents only to describe their attitudes toward immigration in general, although we expect that na-tives’ views vary in important ways across different types of immigrants (e.g., country of origin, skill level, etc.).3 Another limitation is that many studies rely on
3Exceptions include recent survey experiments that differentiate immigrants with different attributes such as Brader, Valentino, and Suhay (2008); Sniderman, Hagendoorn, and Prior (2004); Hain-mueller and Hiscox (2010); Hopkins (2011); Harell, Soroka, and Iyengar (2011). Due to constraints on survey design, these studies
cross-sectional surveys, which makes it difficult to as-sess how hostility toward immigrant groups varies over time.4Moreover, surveys put participants in an artificial research setting where responses have almost no real-life consequences, and therefore often boil down to “top of the head” reactions that may inaccurately cap-ture true beliefs (Bertrand and Mullainathan 2001; Tay-lor and Fiske 1978). Another well-recognized problem is that answers to sensitive questions about immigra-tion and racial policies can be biased by social desirabil-ity effects, because respondents are unwilling to admit to discriminatory attitudes in times when discrimina-tion has become illegal and socially unacceptable in many countries (Berinsky 1999; Kuklinski, Cobb, and Gilens 1997).5
In light of these problems, some scholars have turned to field experiments such as audit studies to behaviorally measure racial discrimination in the labor market and other economic domains (Adida, Laitin, and Valfort 2010; Bertrand and Mullainathan 2004; Jowell and Prescott-Clarke 1970; List 2004). We take a complementary approach and study discrimination in naturalization decisions, drawing upon a natural ex-periment from Switzerland that allows us to overcome some of the inferential challenges mentioned above and illuminates how discrimination against immigrants varies across different types of immigrants and over time.
In Switzerland, each municipality autonomously de-cides on the naturalization applications of its for-eign residents who seek Swiss citizenship. We focus on the group of municipalities that until 2003 used referendums6with closed ballots to decide on natural-ization requests. A typical naturalnatural-ization referendum involved two stages. Local voters first received official voting leaflets that explained the pending naturaliza-tion request with a detailed descripnaturaliza-tion of each im-migrant applicant. Voters then cast a secret ballot on each individual request, and applicants with a majority of “yes” votes were granted Swiss citizenship. Draw-ing upon local municipality archives, we collected a new dataset that contains applicant characteristics and voting outcomes for the 2,400 recorded naturalization referendums held between 1970 and 2003 in the 44 Swiss municipalities that used secret ballot referen-dums with voting leaflets. We use these data to exam-ine how applicant characteristics affect the outcome of naturalization referendums.
This research design has at least three advantages compared to previous work. First, naturalization ref-erendums enable us to measure revealed preferences regarding immigrants based on actual behavior in a
typically distinguish only a small number of attributes (but see Hain-mueller and Hopkins (2012)).
4Exceptions include studies such as Scheve and Slaughter (2001); Semyonov, Raijman, and Gorodzeisky (2006); Hopkins (2010). 5A recent report from the National Research Council’s Committee on National Statistics summarizes these inferential problems in racial discrimination (Blank, Dabady, and Citro 2004).
6We use “referendums” rather than “referenda” as the plural fol-lowing the Oxford English Dictionary and previous literature.
real-world setting. Social desirability bias is not a con-cern, because voters used secret ballots and needed to provide no justification for their votes. Voters also had to face the consequences of their voting behav-ior, as naturalized immigrants instantly acquired the same rights as existing members of the local citizenry (including the right to vote and permanently stay in the municipality). The data should therefore reveal a fairly accurate assessment of the immigration prefer-ences of the local voting population. As Bell Jr. (1978, 14) put it, referendum voting “enables voters’ racial beliefs and fears to be recorded and tabulated in their pure form.” Second, much like a real-world vignette experiment, our data covers comparable application decisions regarding thousands of immigrants with rad-ically different attributes and at different points in time, allowing us to pinpoint particular immigrant at-tributes that are valued or disliked by local voters. This data set also allows us to examine how discrimination against particular immigrant groups varies over time in response to immigration waves. Third, our design enables us to minimize potential omitted variable bias, since we measure and control for the same applicant information from the official voting leaflets that voters had at their disposal when they decided on the natu-ralization requests. We also show that our main results are insensitive to hidden bias that could arise from the fact that some knowledgeable voters decided based on private information about particular applicants that extended beyond the information provided in the leaflets.
When interpreting our results, it is important to em-phasize the we capture only the effects of the applicant characteristics in the last hurdle of the application pro-cess, once a naturalization request was put to a popu-lar vote. Since we do not capture additional forms of potential discrimination that may have deterred immi-grants from applying for citizenship in the first place, our estimates are best understood as a lower bound on the overall prevalence of discrimination in naturaliza-tion outcomes in the sample municipalities.
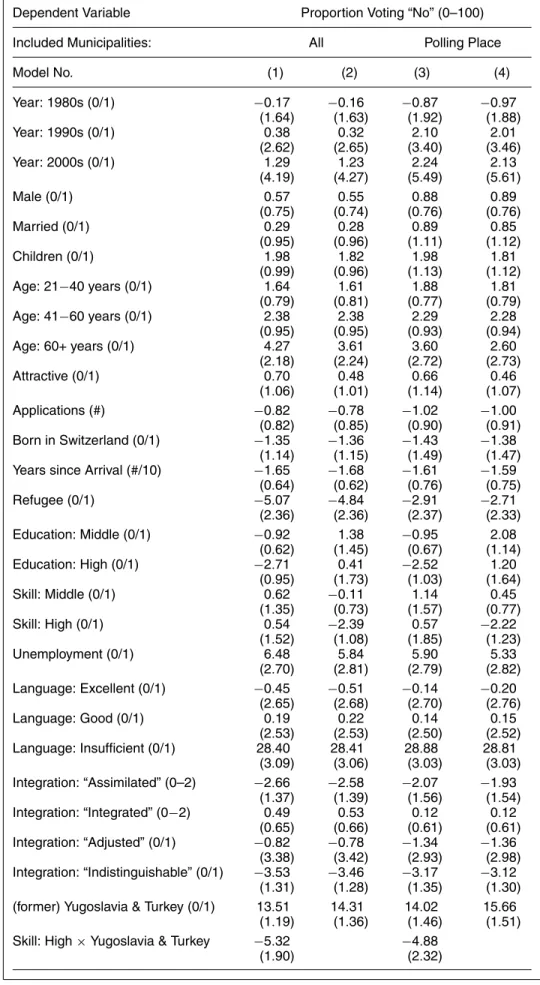
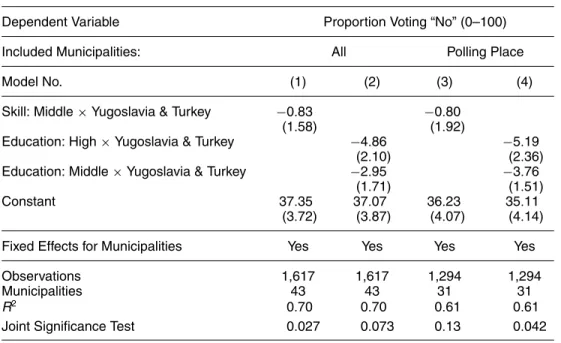
We find that naturalization outcomes vary dramati-cally across and within municipalities. Country of origin is by far the most important determinant of natural-ization success. The average proportion voting “no” in the naturalization referendums is about 13–15 per-centage points higher for applicants from (the former) Yugoslavia and Turkey compared to observably sim-ilar applicants from richer northern and western Eu-ropean countries who apply in the same municipality at the same time; this corresponds to a 40% increase over the average proportion of “no” votes (or about a 120% increase over the average probability of be-ing rejected). This massive origin disadvantage is very similar in smaller and larger municipalities and in-sensitive to unobserved confounders with Rosenbaum Gamma values between 9 and 11, indicating that it would take an enormous hidden bias to explain away the origin effects. We also find smaller origin penalties for applicants from other groups, including applicants from central and eastern European countries (6 per-centage points), Asia (3 perper-centage points), and other
non-European countries (7 percentage points), but no disadvantage for applicants from southern Europe. Taken together, origin alone accounts for about 40% of the within-municipality variation in the proportion of “no” votes.
Other immigrant characteristics also influence the naturalization success. Voters systematically prefer ap-plicants with better economic credentials (as measured by occupational skill, education, and prior unemploy-ment), applicants born in Switzerland, and applicants with longer residency, but the effects of these charac-teristics are very small compared to the origin effects. We also find that language skills have almost no ef-fect on naturalization success. Even applicants who are described to voters as “perfectly fluent” in the Swiss-German dialect earn no significant advantage. Simi-larly, the assessed integration status of the applicant plays very little role overall (the exception is applicants who earn a slight advantage because they are described to voters as being “completely indistinguishable” from a Swiss native).
We use additional tests that consider statistical and taste-based discrimination theories to illuminate the mechanisms that may explain the varying treatment of applicants based on their country of origin. Theo-ries of statistical discrimination (Arrow 1972; Phelps 1972) suggest that if the average integration level of immigrants varies by origin group, then voters, even if all they care about is that applicants are sufficiently well integrated, find it optimal to place some weight on an applicant’s origin to make a better guess about her true integration level (which is measured with noise in the voting leaflets). This logic implies that voters will reward an applicant more strongly for additional observable credentials that are informative about her integration status (such as higher educational attain-ment) if the applicant belongs to an origin group that is believed to have a lower average integration level. Consistent with this theoretical expectation, better eco-nomic credentials strongly decrease the proportion of “no” votes among applicants from Turkey and (the for-mer) Yugoslavia but have no effect among applicants from richer northern and western European countries. We also find evidence for theories of taste-based discrimination (Allport 1979; Becker 1971) where a “taste for discrimination” directly enters the utility function of voters who are assumed to hold xenopho-bic animus against immigrants from particular origin groups. Consistent with this logic, we find that origin-based discrimination steeply increases with the xeno-phobic preferences of the local population (as mea-sured by vote shares from federal anti-immigration referendums); the origin penalty for applicants from (the former) Yugoslavia and Turkey almost triples in the most, compared to the least, xenophobic munici-palities. Overall, these results indicate that statistical discrimination may account for about 40% and taste-based discrimination for about 60% of the origin-taste-based discrimination in our sample.
Consistent with group conflict theories that link the rise of xenophobic animus to a defensive reaction of natives who view immigrant out-groups as a threat to
the natives’ dominant position (Blalock 1967; Blumer 1958; Quillian 1995), we also find that origin-based discrimination is dynamically correlated to changes in the relative sizes of the different origin groups. While discrimination against applicants from Turkey and (the former) Yugoslavia increases following the rapid growth of these groups during the 1990s, dis-crimination against immigrants from southern Euro-pean origins abates as the relative size of this group decreases.
Our study contributes to several literatures. First, our findings have important implications for the re-search that studies the prevalence and drivers of anti-immigrant sentiment (e.g., Brader, Valentino, and Suhay 2008; Dustmann and Preston 2007; Hainmueller and Hiscox 2007; 2010; Sides and Citrin 2007; Snider-man, Hagendoorn, and Prior 2004). Although most studies to date are based on survey data and consider only attitudes toward immigration in general, our re-sults provide clear behavioral evidence that natives do not treat all immigrants equally but instead draw important distinctions between different types of im-migrants and that these preferences are not static but vary over time. Our results also show that measure-ment matters: the immigrant preferences revealed in our behavioral data contrast sharply with immigra-tion preferences as measured by comparable public opinion surveys, which are prone to social desirability bias. Second, our findings resonate with the literature on racial discrimination (e.g., Altonji and Blank 1999; Blank, Dabady, and Citro 2004; Pager and Shepherd 2008). While most of this work has focused on race-and gender-based discrimination in the labor market, our results demonstrate that naturalization decisions for resident aliens can be subject to similar types of discrimination, and that similar theoretical mech-anisms provide explanatory leverage to account for this discrimination. Third, by comparing microlevel data about individual naturalization decisions across several municipalities, our study adds to the small but growing literature in immigration studies that has be-gun to examine outcomes and policies at the local level, where more focused comparisons are less vul-nerable to biases from unobserved heterogeneity that often plague cross-national research (e.g., Adida 2011; Dancygier 2010; Helbling 2008; Hopkins 2010). Fourth, our findings add new empirical evidence to the ex-tensive literature and policy debates about citizenship policies and the integration of already settled immi-grants (e.g., Freeman 2004; Givens 2007; Hochschild and Mollenkopf 2009). Finally, our study contributes to the literature that studies the relationship between direct democracy and the protection of minorities’ civil rights (e.g., Frey and Goette 1998; Gamble 1997; Hajnal, Gerber, and Louch 2002; Maskin and Tirole 2004). Our results provide evidence that, in the absence of other institutional safeguards, referendum voting can result in systematic discrimination against particu-lar minority groups who find themselves at the whim of the native majority. This finding informs ongoing pol-icy debates about reforming the Swiss naturalization system.
CITIZENSHIP POLICY IN CONTEXT
Before we turn to the empirical analysis, it is helpful to put the Swiss naturalization system in a compara-tive perspeccompara-tive and discuss the potential benefits of obtaining Swiss citizenship.
The Swiss Naturalization System
Ever since classical Athens, states have used citizen-ship as a closure mechanism to define a select group of members who belong to a polity and enjoy special privileges denied to nonmembers. Historically, eligi-bility criteria for citizenship often included attributes such as class, wealth, ethnicity, race, and gender, and requirements frequently changed over time to accom-modate developments in state capacity (Bellamy 2008). In Switzerland, this link between citizenship and state building gave rise to a system of triple citizenship, which defines Swiss citizenship based on citizenship in a mu-nicipality, a canton, and the Confederation (Helbling 2008, 12–17). This three-tiered system is unique in that it delegates responsibility for naturalizing foreigners largely to the municipal level. Federal laws impose formal naturalization requirements, but an immigrant cannot obtain a Swiss passport without acquiring citi-zenship of a municipality, and municipalities enact the naturalization procedures and ultimately decide on the applications.7This contrasts with many other countries where naturalization procedures and criteria are typi-cally defined at the federal level and implemented by federal ministries or agencies (as in the U.S., France, Canada, and Belgium). Other countries have hybrid regimes where rules are stipulated at the federal level, but applications are checked and decided at the re-gional level (as in Germany and Austria).8
In general, Switzerland is often categorized as part of the group of countries with relatively restrictive citi-zenship regimes, such as Germany, Denmark, Austria, and Greece (Goodman 2010). In the other pool are countries with more liberal citizenship regimes such as France, the UK, Belgium, and the U.S. Although naturalization regimes are complex and generally dif-ficult to compare across countries, the more restrictive countries are typically characterized by the fact that they rely on the jus sanguinis principle, which implies that citizenship is passed on from the citizenship of the parents, rather than granted based on the place of birth. More liberal countries also typically require around 5 years of permanent residence, while more restrictive regimes require up to 8 to 10 years before resident im-migrants become eligible for citizenship.9More restric-7The federal level exclusively controls access to Swiss citizenship through descent, marriage, and adoption. Cantons rarely regulate local naturalization policies, with the exception of Geneva where naturalizing foreigners is centralized at the canton level.
8Some studies suggest that significant within-country variation ex-ists in the handling of naturalization applications. Such differences have been found between German L ¨ander, Austrian regions, French regional offices, and even U.S. district offices (Helbling 2008, 18–19). 9Switzerland requires 12 years of residence, but years between ages 10 and 20 count double; at least 3 of the 12 years must fall within
tive regimes also typically require renunciation of prior citizenship and do not allow naturalized immigrants to hold multiple passports. Switzerland introduced mul-tiple citizenship for naturalized immigrants in 1992, in contrast to many of the traditionally more restric-tive countries. Almost all Western countries, including Switzerland, also have additional naturalization crite-ria that require a clean criminal record, some evidence of financial self-sufficiency, and, in many cases, demon-strated mastery of the country’s official language(s). Several countries, such as Switzerland, also require that applicants demonstrate knowledge of the country and meet a standard of integration.10
About 2 in 100 foreigners were naturalized in Switzerland in 2000. Although southern European countries like Spain, Italy, and Portugal experienced even lower naturalization rates in the same year, sev-eral OECD countries had higher rates with 2.5% in Germany, 3% in the U.S., and 4% in the UK (OECD 2003, 93). Despite the relatively low naturalization rate, Switzerland has experienced a sizeable immigration inflow over the last three decades. By 2000, the share of the non-naturalized immigrant population reached 25% in Switzerland, by far the highest level among all other Western countries except Luxembourg; for comparison, the share of the foreign-born population in the same year was 15% in the United States, 13% in Germany, and 9% in the UK (Dumont, Spielvogel, and Widmaier 2010).
With the increased immigration flows in recent decades, citizenship policies have become heavily politicized in many Western countries, as right-wing parties have discovered the topic is an effective spring-board for mobilizing voters against immigration. In Switzerland, the Swiss People’s Party has repeatedly emphasized the need to restrict access to citizen-ship and immigration inflows, campaigning against “mass naturalizations” with signs that portray brown, black, and white hands snatching Swiss passports. Anti-immigrant political movements such as the Freedom Party in Austria, the National Front in France, the DVU in Germany, and the Danish People’s Party in Denmark have similarly mobilized voters against immigration by highlighting the societal dangers of liberal citizenship policies. Conflicts over naturalization policy are there-fore an important part of the general phenomenon
the 5 years preceding the naturalization request (B ¨urgerrechtsgesetz, Chap. 15).
10In Switzerland the federal requirements for ordinary naturaliza-tion are as follows: the applicant is integrated into the Swiss context, is familiar with the Swiss way of life, adapts to the laws, traditions, and customs, respects the legal order, and poses no threat to the internal and external security of Switzerland (B ¨urgerrechtsgesetz, Chap. 14). Regarding the integration requirement, Switzerland may be most comparable to countries such as Austria, the Netherlands, Luxembourg, and Germany that have explicit or implicit integration requirements for applicants. France requires “assimilation.” The U.S. requires applicants to demonstrate English proficiency and basic knowledge of U.S. history and government. The U.S. also requires that applicants are of “good moral character,” which is usually de-fined to mean that applicants are law abiding and provide truth-ful information during the interviews. See Goodman (2010) for a summary.
of anti-immigrant sentiment (Brubaker 1989; Dancy-gier 2010; Givens 2007; Howard 2009; Koopmans et al. 2005).11
The Benefits of Swiss Citizenship
Why would immigrants seek Swiss citizenship? For the 1970–2003 period covered in our study, almost all eli-gible immigrants applying for ordinary naturalization have a settlement permit, and therefore share many of the same rights and benefits as Swiss citizens, such as the right to choose their employers, access to health benefits, the right to travel and return, and the respon-sibility to pay taxes. However, Swiss citizenship still carries an important symbolic value as a visible marker of full membership in the host country. Citizenship also comes with several tangible benefits. First, only citi-zens have the right to vote in the many local, cantonal, and federal referendums and elections, and the right to run for office or express their concerns at municipality assemblies.12Second, only children born to citizens au-tomatically receive Swiss citizenship at birth; children born to foreign residents have to apply through natural-ization procedures. Third, only citizens have the right to stay in Switzerland indefinitely, while the settlement permit can theoretically be challenged if immigrants return to their home country for more than 6 months (Wanner and Piguet 2002, 919). Fourth, certain jobs formally require Swiss citizenship.13 Fifth, citizenship may improve immigrants’ economic prospects. Corre-lational studies from several countries document a pos-itive relationship between naturalization and higher wages and employment (see, for example, OECD 2011). Citizenship can signal to employers higher lev-els of human capital and lower risk of return migra-tion. Citizenship can also give immigrants an edge in the hiring process when employers discriminate based on nationality. Fibbi, Kaya, and Piguet (2003) doc-ument strong discrimination against non-naturalized immigrants among Swiss employers. In sum, a Swiss passport provides more than just symbolic value for immigrants. Citizenship marks the difference between being a tolerated resident who may express her views and being “entitled to have them heard on an equal basis” (Bellamy 2008, 12).14 Naturalization therefore 11This link between immigration and naturalization policy is also present in public opinion data. For example, in the U.S. a 2006 Gallup poll found that among respondents who supported a decrease in the level of immigration, 60% were also in favor of denying birthright cit-izenship to children of unauthorized immigrants (compared to only 29% among respondents who favored an increase in immigration levels). In Switzerland, voting results from referendums that involve restrictions on immigration are typically highly correlated with vot-ing results from referendums that involve changes to naturalization policy.
12Only very few (and none of our sample) municipalities allow im-migrants with settlement permits to vote at the municipal or cantonal level.
13For example, several public employers only hire Swiss citizens: the military, publicly owned defense companies, several cantonal police forces, the border guard corps, and the Foreign Service.
14Although rejected applicants keep their permit, at the moment we can only speculate about how a rejection may affect an immigrant’s
provides an important indicator for the level of soci-etal integration and reciprocity between natives and immigrant populations.
EXPLAINING NATURALIZATION DECISIONS
Immigrants who seek Swiss citizenship have to apply via the ordinary naturalization procedure at three ad-ministrative levels: federal, cantonal, and municipal.15 Although the federal and cantonal authorities check if an applicant fulfills the basic eligibility requirements such as the residency period and clean criminal record, each municipality evaluates the merits of its applicants and ultimately decides on naturalization requests. In our sample period, 1973–2003, municipalities used a wide variety of institutions to vote on local naturaliza-tion requests. Most municipalities used direct demo-cratic arrangements in which citizens voted on appli-cations in popular votes by hand-raising at regular meetings of the citizens’ assembly. Other municipali-ties delegated the naturalization decision to the elected municipality council where politicians voted on the ap-plications (see Hainmueller and Hangartner 2012 for an overview of the various institutions).
In this study, we focus on the relatively small sub-sample of “ballot box” municipalities that used popular votes with secret ballots to decide on citizenship appli-cations. This institutional arrangement provides per-haps the purest form of direct democracy and resonates with the political culture in Switzerland, which empha-sizes local autonomy and direct democratic principles. This arrangement also has historical antecedents in the
polis of Athens.16A typical naturalization referendum in our ballot box municipalities involved a two-step process in which citizens received an official voting leaflet with r ´esum ´es that detailed information about each immigrant applicant (below we provide a list of reported applicant characteristics). Voters then cast a secret ballot to reject or approve each naturalization request, and applicants with a majority of “yes” votes were granted Swiss citizenship. Voting on citizenship requests was part of the typical Swiss direct democratic routine in which referendums were used at regular intervals to decide on a wide variety of municipal,
life. In a follow-up project, we use a regression discontinuity design to study the impacts of citizenship by surveying immigrants whose applications were narrowly decided.
15Here and for the rest of the study, we focus on “ordinary” natural-ization which is by far the most common naturalnatural-ization mode. We do not consider “facilitated” naturalization granted by a special process that does not involve the municipality. This special track is open only for immigrants who have been married to a Swiss citizen for at least three years and have been living in Switzerland a total of five years. Also notice that children who are born to a Swiss mother or Swiss father are typically granted citizenship at birth. This is not the case for children who are born in Switzerland to immigrant parents. Such children typically have to apply through the regular process for “ordinary” naturalization and are thus included in our analysis. 16In ancient Athens, the citizens’ assembly ecclesia decided on the naturalization applications of individuals and sometimes even whole groups (e.g., after outstanding services in wars) by closed ballot voting (cf. (Pseudo-)Demosthenes against Neaera (Demosthenes 1949)).
cantonal, and federal matters. Typically, voters cast their ballots at the local polling place, and naturaliza-tion referendums appeared on the ballots alongside other referendums that took place on the same day.17
Although, historically, relatively few municipalities used naturalization referendums to decide on citizen-ship applications, the practice recently sparked political debates following media reports about seemingly dis-criminatory rejection of applicants. One such case was brought before the Swiss Federal Court, which in July 2003 ruled that closed ballot voting for naturalization referendums violates the Swiss Constitution (BGE 129 I 232 and BGE 129 I 217). The Federal Court argued on two different levels. The key reason for ruling against naturalization referendums was that immigrants have the right to appeal rejected applications (BGE 129 I 217), and therefore the decision-making body is obli-gated to provide justification for the rejection.18 Since the very nature of closed ballot referendums means that voters do not have to justify their decisions, the court reasoned that such procedures cannot be used for naturalization. Interestingly, the Federal Court also explicitly mentioned the danger that an applicant may be rejected simply because of her affiliation in a certain “ethnic-cultural group” (BGE 129 I 232: 241), which violates the antidiscrimination clause provided by the Swiss Constitution.19In response to the Federal Court rulings, ballot box municipalities changed their nat-uralization procedures, and most transferred the au-thority for naturalization decisions to the municipality council.20
The court rulings triggered heated debates about the use of closed ballot naturalization referendums. The Swiss People’s Party launched persistent campaigns ar-guing that “the people” should have full discretion over the naturalization process, and public support for this position remains strong.21 In 2006, the Swiss People’s 17Although the format of the voting leaflets varied somewhat across our ballot box municipalities, the leaflets contained broadly similar information about the applicants. The ballots used to vote on citizen-ship requests were also broadly similar, but there was some variation in the amount of applicant information listed on the ballot. Some ballots just listed the applicant’s name while others included more characteristics drawn from the voter leaflets, such as age, country of origin, or job title. To the best of our knowledge, ballots never in-cluded additional applicant information that was not inin-cluded in the leaflets. The format of the leaflets and ballots typically did not change over time in a given municipality in our sample period. These time-invariant factors will therefore be absorbed into the municipality fixed effects in the regression analysis. Appendix C shows examples of leaflets and ballots that we extracted from municipal archives. 18Otherwise, the decision-making body violates paragraph§29 II of the Swiss Constitution that covers general procedural safeguards. 19The relevant paragraph §8 II of the Swiss Constitution states: Nobody may be discriminated against, namely, because of origin, race, gender, age, language, social position, or way of life; religious, ideological, or political convictions, or because of a physical or mental disability.
20In a follow-up project, we exploit this shift to identify the effects of different institutional regimes on naturalization outcomes (Hain-mueller and Hangartner 2012).
21In a 2008 poll, 47% of Swiss voters agreed that naturaliza-tion must be decided by the Swiss people (“ ¨Uber Einb ¨urgerungen muss das Schweizer Volk entscheiden k ¨onnen” Vox poll 06/01/2008. Item: arg01x). In a 2004 poll, 40% of Swiss voters agreed that the
Party successfully collected the 100,000 signatures nec-essary for a federal initiative that, by changing the Swiss Constitution, would grant municipalities full discretion over naturalization (including, of course, secret ballot voting) and remove the rejected applicant’s right to appeal. Although this particular initiative “for demo-cratic naturalization” was rejected by 64% of voters in 2008, related popular initiatives at the cantonal level are already being prepared and will ensure continuing politicization of the issue in the ongoing reform debates about naturalization policy.
Empirical Strategy
Closed ballots and voting leaflets are the two main features of the research design that allow us to over-come some of the inferential challenges typically asso-ciated with studying immigrant discrimination (Blank, Dabady, and Citro 2004). The first feature addresses the measurement problem: the anonymity of closed ballot voting guards against social desirability effects. Unlike surveys in which answers bear almost no real-life con-sequences for respondents, in our case, preferences are revealed by voters in a real-world setting where the respondents are not aware of the research context and must face the consequences of their voting behavior.
The second feature addresses the causal identifica-tion problem: Official voting leaflets summarizing the applicant characteristics were sent to all citizens usu-ally about two to six weeks before each naturalization referendum. Since we retrieved the voting leaflets from the municipal archives, we measure the same applicant information from the leaflets that the citizens observed when they voted on the citizenship applications. Since most voters simply draw on the leaflets to decide on the applicants, this design enables us to greatly mini-mize potential omitted variable bias and attribute dif-ferences in naturalization outcomes to the effects of differences in measured applicant characteristics. For example, imagine that voters are faced with observably similar applicants who only differ in their country of origin, say Italy and (the former) Yugoslavia. If voters reject the Yugoslavian applicants at a higher rate than Italians, then we can attribute the difference in natu-ralization success to the difference in the country of origin, based on the assumption that a typical voter has no private information about the applicants that goes beyond the information provided in the leaflets and can be used to systematically discriminate between the applicants. Notice that this assumption may be violated for a subset of knowledgeable voters who cast their bal-lot based on private information about an applicant, for example, because they are friends with the applicant or have been exposed to gossip about the applicant that goes beyond the information provided in the leaflet. We discuss this possibility in separate sections below
federal level should not interfere with cantonal and municipal au-tonomy to regulate naturalization policy (“Der Bund hat sich nicht in die Kompetenzen der Kantone und Gemeinden auf dem Gebiet des Einb ¨urgerungswesens einzumischen” Vox poll 09/26/2004. Item: arg06x).
and show that our main results are robust to hidden bias that may arise from private information.
Before we proceed to the estimation, we remind readers that the scope of our analysis is limited to estimating the effects of applicant characteristics, con-ditional on the fact that the application was put to a popular vote. The internal validity of our estimates is therefore not compromised by the selection of immi-grants into applying for citizenship in the first place. Once an application was put to the vote, we observe and control for the same applicant characteristics that vot-ers learned about from the voting leaflets. That said, the fact that we condition on the voting stage implies that we can detect potential discrimination only among the group of fairly well-integrated immigrants who have completed the eligibility criteria and chosen to apply for citizenship. Our study is not designed to capture ad-ditional forms of discrimination that may deter eligible immigrants from applying for citizenship in the first place because they are discouraged by municipality officials, anticipate a discriminatory voting outcome, or deem the costs of applying to be higher than the expected benefits (Steiner and Wicker 2004). Our re-sults are therefore best interpreted as a lower bound for the overall prevalence of discrimination against immigrants in the naturalization process of ballot box municipalities.22
Data and Sample
To construct our data, we first identified ballot box municipalities that used referendum voting with secret ballots to decide on naturalization requests before the court ruling in 2003. Since data on municipal decision making was unavailable, we compiled a list of all mu-nicipality offices and fielded a survey to the
Gemein-deschreiber (head secretaries) to collect information
about the history of the local naturalization process. This survey yielded an overall response rate of 60%; the coverage was 74% for larger municipalities that had at least 10 naturalizations in 2000.23To complement the data, we also contacted canton officials and searched 22Empirically, the number of applications in a municipality is closely proportional to its size, which suggests that the selection into applying is mostly driven by the demand side and does not vary much across municipalities. One reason is that the spatial mobility of immigrant applicants is very limited. For the pre-2003 period covered by this study, immigrants were required to have a job in Switzerland before entering the country and therefore chose the area for their initial set-tlement mainly based upon geographic proximity to their workplace. Moreover, immigrants whose naturalization requests were rejected could not simply move to a neighboring municipality and immedi-ately re-apply for citizenship. Instead, they had to wait for several years because municipalities commonly require that applicants have to reside in the municipality for four to six years before applying for citizenship. Also note that once an applicant has reached the voting stage, withdrawals of applications are extremely rare (one case out of the 2,430 applicants in our sample).
23We fielded the survey in 2010 using an online survey tool. The questionnaire is available upon request. The included municipalities capture about 80% of the Swiss population since the nonresponse is concentrated among the smallest municipalities that had no natural-ization requests during our period and therefore did not complete our survey.
newspaper archives and municipality websites for ad-ditional reports about municipalities with naturaliza-tion referendums.24 Overall, we identified 44 ballot box municipalities, which are defined as municipalities that (1) used secret ballot naturalization referendums at some point before 2003 and (2) sent voters leaflets with information about applicants. To the best of our knowledge, this constitutes a complete list.25Members of the research team then visited each municipality and extracted the official voting leaflets with applicant information and the vote counts for all ordinary nat-uralization requests documented in the municipality archive for the period from 1970 to 2003.
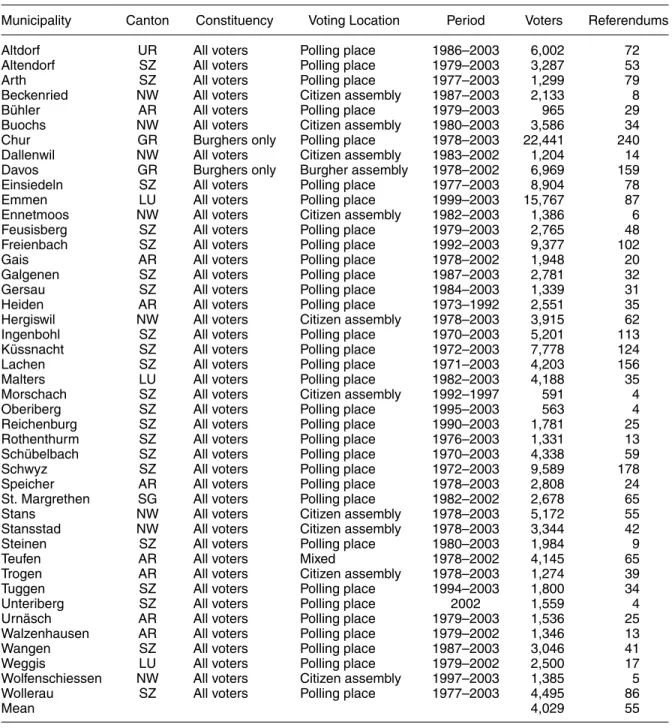
Table 1 displays basic information about the sample. Ballot box municipalities were located in seven dif-ferent cantons, and all were in the German-speaking region. The average municipality had 4,029 registered voters (in 2003), although the size varied considerably from 563 registered voters in Oberiberg to 22,441 vot-ers in Chur. Overall, the sample includes 2,429 nat-uralization referendums. The period coverage varies somewhat due to differences in data availability, but for most municipalities, we collected data on all natural-ization referendums going back to the 1970s and 1980s. The average municipality had about 55 naturalization referendums in our sample period, and the number of referendums was strongly proportional to the mu-nicipality size (a bivariate regression indicates that a 1% increase in the number of voters is associated with about a 1.1% increase in the number of applications (t value> 8.6)).
Although all municipalities in our sample used pop-ular votes with secret ballots to decide on naturaliza-tion requests, the details of the voting process var-ied somewhat. In 70% of the municipalities, voters cast their secret ballots for the naturalization refer-endums at the local polling place and usually with their votes on other contemporaneous municipal, can-tonal, or federal referendums.26 Turnout for such nat-uralization referendums was about 40% on average, and was mainly driven by the turnout for referen-dums on the other municipal, cantonal, and federal matters that were voted on the same day.27 In a small 24We searched the archives of the Neue Z ¨urcher Zeitung and
Tage-sanzeiger as well as the website of the watchdog group GRA.
25One exception is the recently merged municipalities Glarus, Glarus Nord, and Glarus S ¨ud, which were not able to locate the applicant data after the merger. We also did not include a few very small municipalities that had fewer than four applicants in this time period.
26Voters typically received the ballots by mail so that they could fill them out at home before submitting them at the local polling place. 27Average turnout for federal referendums was about 44–46% during our sample period. To investigate the link between federal referendums and local naturalization referendums, we merged the turnout data for our naturalization referendums with municipality-level turnout for federal referendums that were voted on during the same day and found that both are very highly correlated. A one percentage point increase in turnout for federal referendums is associated with about a one percentage point increase in turnout for naturalization referendums (t value> 6), and the link gets even stronger when municipality and year fixed effects are included in the regression (t value> 13). This suggests that similar voters typically participated in both types of referendums.
TABLE 1. Ballot Box Municipalities with Naturalization Referendums
Municipality Canton Constituency Voting Location Period Voters Referendums
Altdorf UR All voters Polling place 1986–2003 6,002 72
Altendorf SZ All voters Polling place 1979–2003 3,287 53
Arth SZ All voters Polling place 1977–2003 1,299 79
Beckenried NW All voters Citizen assembly 1987–2003 2,133 8
B ¨uhler AR All voters Polling place 1979–2003 965 29
Buochs NW All voters Citizen assembly 1980–2003 3,586 34
Chur GR Burghers only Polling place 1978–2003 22,441 240
Dallenwil NW All voters Citizen assembly 1983–2002 1,204 14
Davos GR Burghers only Burgher assembly 1978–2002 6,969 159
Einsiedeln SZ All voters Polling place 1977–2003 8,904 78
Emmen LU All voters Polling place 1999–2003 15,767 87
Ennetmoos NW All voters Citizen assembly 1982–2003 1,386 6
Feusisberg SZ All voters Polling place 1979–2003 2,765 48
Freienbach SZ All voters Polling place 1992–2003 9,377 102
Gais AR All voters Polling place 1978–2002 1,948 20
Galgenen SZ All voters Polling place 1987–2003 2,781 32
Gersau SZ All voters Polling place 1984–2003 1,339 31
Heiden AR All voters Polling place 1973–1992 2,551 35
Hergiswil NW All voters Citizen assembly 1978–2003 3,915 62
Ingenbohl SZ All voters Polling place 1970–2003 5,201 113
K ¨ussnacht SZ All voters Polling place 1972–2003 7,778 124
Lachen SZ All voters Polling place 1971–2003 4,203 156
Malters LU All voters Polling place 1982–2003 4,188 35
Morschach SZ All voters Citizen assembly 1992–1997 591 4
Oberiberg SZ All voters Polling place 1995–2003 563 4
Reichenburg SZ All voters Polling place 1990–2003 1,781 25
Rothenthurm SZ All voters Polling place 1976–2003 1,331 13
Sch ¨ubelbach SZ All voters Polling place 1970–2003 4,338 59
Schwyz SZ All voters Polling place 1972–2003 9,589 178
Speicher AR All voters Polling place 1978–2003 2,808 24
St. Margrethen SG All voters Polling place 1982–2002 2,678 65
Stans NW All voters Citizen assembly 1978–2003 5,172 55
Stansstad NW All voters Citizen assembly 1978–2003 3,344 42
Steinen SZ All voters Polling place 1980–2003 1,984 9
Teufen AR All voters Mixed 1978–2002 4,145 65
Trogen AR All voters Citizen assembly 1978–2003 1,274 39
Tuggen SZ All voters Polling place 1994–2003 1,800 34
Unteriberg SZ All voters Polling place 2002 1,559 4
Urn ¨asch AR All voters Polling place 1979–2003 1,536 25
Walzenhausen AR All voters Polling place 1979–2002 1,346 13
Wangen SZ All voters Polling place 1987–2003 3,046 41
Weggis LU All voters Polling place 1979–2002 2,500 17
Wolfenschiessen NW All voters Citizen assembly 1997–2003 1,385 5
Wollerau SZ All voters Polling place 1977–2003 4,495 86
Mean 4,029 55
Note: Teufen voted on naturalization requests at the polling place. Cantons are Appenzell Outer-Rhodes (AR), Grisons (GR), Lucerne (LU), Nidwalden (NW), Schwyz (SZ), St. Gall (SG), and Uri (UR). Voting location refers to the place where voters submit their secret ballots. Number of voters is measured in 2003. Referendums refers to the total number of collected naturalization referendums that were voted on in a given municipality over the period. See text for details.
number of our municipalities, voting on local matters— including citizenship requests—took place at the citi-zens’ assembly. Secret ballots were also used in these cases, but the average turnout was lower (around 18%) since fewer citizens typically attended the assembly meetings. Two municipalities, Chur and Davos, fur-ther restricted the voting on naturalization requests to the Burghers, a select group of about 20% of fam-ilies who have lived in the municipality for a long time.
Before we turn to the empirical analysis, we consider how the sample of ballot box municipalities compares with other Swiss municipalities. Overall, our sample covers about 4% of all municipalities and about 4% of the Swiss population in our time period. One concern for external validity is that the municipal naturaliza-tion procedure is endogenous to the local community’s immigration preferences. If, for example, more xeno-phobic municipalities opted for popular votes because this institution makes it easier to discriminate against
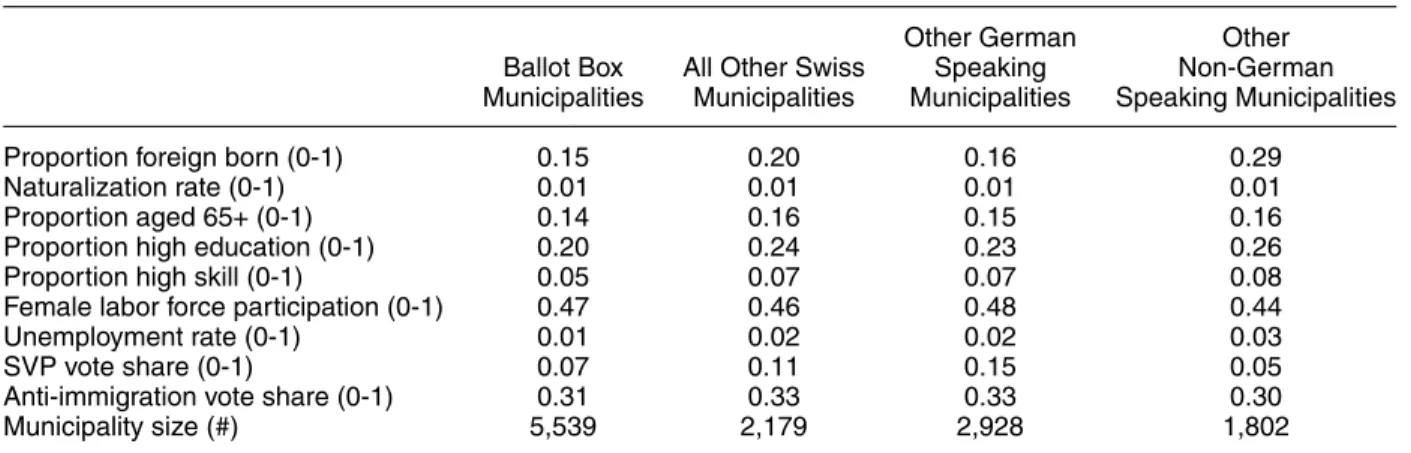
TABLE 2. Ballot Box Municipalities in Comparison
Other German Other
Ballot Box All Other Swiss Speaking Non-German
Municipalities Municipalities Municipalities Speaking Municipalities
Proportion foreign born (0-1) 0.15 0.20 0.16 0.29
Naturalization rate (0-1) 0.01 0.01 0.01 0.01
Proportion aged 65+ (0-1) 0.14 0.16 0.15 0.16
Proportion high education (0-1) 0.20 0.24 0.23 0.26
Proportion high skill (0-1) 0.05 0.07 0.07 0.08
Female labor force participation (0-1) 0.47 0.46 0.48 0.44
Unemployment rate (0-1) 0.01 0.02 0.02 0.03
SVP vote share (0-1) 0.07 0.11 0.15 0.05
Anti-immigration vote share (0-1) 0.31 0.33 0.33 0.30
Municipality size (#) 5,539 2,179 2,928 1,802
Note: Covariates are measured in the year 1990 except for SVP vote share which is measured in 1991, the anti-immigration vote share which is measured in 1988, and the age distribution, the proportion of citizens with high education (qualification required for university entrance), and the female labor force participation which are all based on the 2000 census. All means are weighted by the size of the native population except for municipality size.
immigrants, then our results may be best interpreted as an upper bound for the overall level of discrimination (compared to other Swiss municipalities). Although systematic data on this issue has not been collected, the available anecdotal evidence suggests that munic-ipalities commonly chose their naturalization proce-dures many decades before our sample period when immigration became politicized and presumably did not radically alter their institutions until forced to do so by the 2003 Federal Court decision (Argast 2006).28
In Table 2, we compare ballot box municipalities with other Swiss municipalities on various characteris-tics in 1990 (roughly the middle of our study period). We find that ballot box municipalities are fairly sim-ilar to the rest of Switzerland regarding the share of the foreign-born population, the naturalization rate, the proportion of elderly, highly educated, and highly skilled, the female labor force participation, and the un-employment rate. The average vote share of the Swiss People’s Party in the 1991 federal elections and support for a federal anti-immigration referendum advocating restrictive immigration laws in 1988 are lower in ballot box municipalities than in the rest of Switzerland, indi-cating that the former are on average perhaps slightly less xenophobic. The only considerable difference is that ballot box municipalities are somewhat larger on average. Most municipalities in Switzerland are fairly small, while our sample includes a relatively high share of larger towns such as Chur, Emmen, and Schwyz. In sum, the comparison reveals that ballot box mu-nicipalities are not very different for a range of rel-evant characteristics from other Swiss municipalities, in particular municipalities in the German-speaking region.
28For example, based on our municipality survey, about 90% of all Swiss municipalities did not change their naturalization institution between 1990 and 2003.
Outcome and Explanatory Variables
The goal of our analysis is to examine how immigrant attributes affect the outcome of naturalization referen-dums, conditional on applying. For our main dependent variable, we focus on the proportion of “no” votes, which for each applicant is defined as the fraction of “no” votes to total valid votes. Since referendums were decided by simple majority rule, a naturalization request was rejected if the proportion of “no” votes exceeded 50%. We also replicate the regressions using a binary dependent variable coded as 1 for rejected and 0 for accepted applications; the results from this alternative measure are very similar. We prefer the proportion of “no” votes as our main measure, because it captures information about the intensity with which voters rejected an application.
We measure an array of personal characteristics from the voting leaflets that described each applicant to the voters. We manually code the covariates mentioned in the applicant descriptions, using a consistent set of coding rules. Descriptive statistics for the variables are reported in Appendix A. These variables fall into four categories. The first category involves sociode-mographic information such as the applicant’s gender, age, marital status, number of children, and our re-search assistants’ binary coding of the picture (attrac-tive or average).29 The second category captures the applicant’s integration status. Prospective applicants were interviewed by municipality officials who eval-uated whether the applicant was sufficiently well inte-grated. Officials tested the applicant’s language skills and assessed whether the applicant was sufficiently fa-miliar with Swiss habits, customs, and traditions. The results of these assessments were reported in the voter 29For a random sample of applicants, we also experimented with more complex codings, including rankings derived from contests be-tween randomly paired candidates scored by multiple coders, but the substantive results were similar to those from the simple binary coding.
leaflets. We classify applicants according to whether their assessed language skills were described to voters as “excellent,” “good,” “sufficient,” or “insufficient” command of Swiss-German. We also code several vari-ables that measure the applicant’s integration status, differentiating between candidates who were described to voters as “assimilated” (1 if assimilated, 2 if highly assimilated), “integrated” (1 if integrated, 2 if highly in-tegrated), “adjusted,” “indistinguishable from a Swiss citizen,” and “familiar with Swiss customs and tradi-tions.” These variables capture the definition of the language and integration requirements in the federal citizenship law.30
The third set of characteristics measures the appli-cant’s immigration history. This includes an indicator for whether the applicant was born in Switzerland, a variable that measures the number of years the ap-plicant has lived in Switzerland before the application, an indicator for whether the applicant entered Switzer-land as a refugee, and a variable that captures the num-ber of applications (a few immigrants re-applied). We also record the country of origin and classify applicants into the following groups: applicants from richer north-ern and westnorth-ern European countries (Germany, the UK, Netherlands, Austria, Scandinavia, etc.); southern European countries (Italy, Spain, Portugal); (the for-mer) Yugoslavia;31 Turkey; other central and eastern European countries (Hungary, Poland, the Czech Re-public, Russia, etc.); Asian countries (Vietnam, Tibet, the Philippines, etc.), and a residual category of other non-European countries (Latin American countries, African countries, the Middle East, etc.). This grouping is based on immigration history and roughly follows the frequency distribution of the origin countries. Ap-plicants from Turkey and (the former) Yugoslavia are coded separately because they constitute the largest recent immigrant groups and are often at the center of the current Swiss immigration debate. Applicants from Italy, Spain, and Portugal are grouped together because these were historically the sending countries of the early waves of immigrants in the 1970s. Overall, about 21% of the applicants in our sample are from richer northern and western European countries, 18% are from southern European countries, 31% are from (the former) Yugoslavia, 15% are from Turkey, 6% are from other central and eastern European countries, 7% are from Asia, and 2% are from other non-European countries.
The fourth set of characteristics measures the appli-cant’s economic and social credentials. We measure the
30Notice that there is potentially some heterogeneity in the integra-tion assessments across municipalities because interviews were con-ducted by the local municipality official. However, we do not expect much over time variation in the heterogeneity of the assessments in a given municipality since turnover among local municipality officials was very limited in our sample period and assessments were there-fore typically handled by the same official. Notice that the between-municipality heterogeneity in the assessments will be absorbed in the municipality fixed effects that we include in the regressions. 31This includes applicants from the Socialist Federal Republic of Yu-goslavia, Slovenia, Croatia, Bosnia and Herzegovina, Montenegro, Serbia, Kosovo, and Macedonia.
number of years of schooling and code three categories: low education (9 years or less of schooling), medium education (between 10 and 14 years, corresponding to a vocational school degree), and high education (more than 14 years, corresponding to a university degree). We also record the applicant’s skill level, which is coded from the first digit of the ISCO-88 occupational clas-sification code. We combine the first two categories (managers and professionals) as highly skilled, groups three to five (technicians and associate professionals, clerical support workers, service and sales workers) as medium skilled, and the rest (craft workers, assem-blers, elementary occupations) as low skilled. We also include a binary indicator for whether the applicant’s description mentioned any period of unemployment.32
RESULTS
Opposition to Naturalization Requests
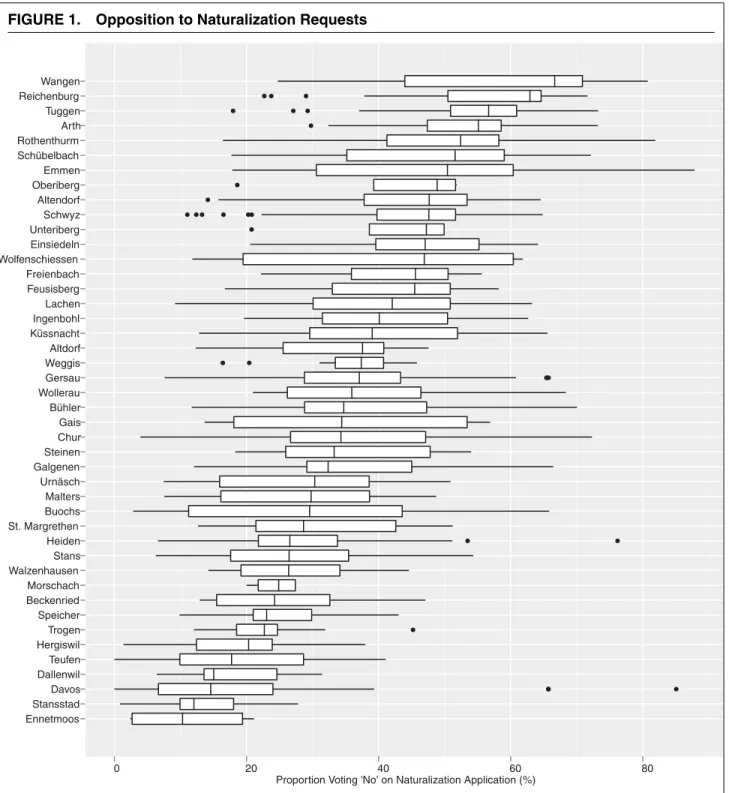
The box plots in Figure 1 visualize for each municipality the distribution of the proportion of “no” votes in the naturalization referendums over the entire study pe-riod. We find a striking variation across and within mu-nicipalities (the between variation is about as large as the within variation). The average proportion of “no” votes is 37%, but some municipalities such as Wangen (the average proportion of “no” votes is 58%) are much more opposed to naturalizing immigrants than other municipalities such as Stansstad (the average propor-tion of “no” votes is 12%). This is remarkable given that these two municipalities are less than 80 kilome-ters apart, are very similar in size, and have almost the exact same number of naturalization requests (cf. Table 1). This between variation may reflect systematic differences in the pool of applicants, the preferences of the local electorate, and/or residual variation in the institutional process. One apparent difference is that municipalities where voting in the naturalization ref-erendums took place at the citizens’ assembly have somewhat weaker opposition to naturalization com-pared to the larger group of municipalities where bal-lots were cast at the local polling place (recall that all municipalities used voting leaflets and closed ballots). This difference is partly driven by the fact that the former group of municipalities has a lower share of
32Due to variations in the format of the voting leaflets, some appli-cant characteristics were not reported to voters in some municipal-ities in certain periods. Note that this is not missing data in the tra-ditional sense; voters simply could not observe this information. We therefore do not use common missing data techniques (such as multi-ple imputation), but follow Rosenbaum (2009, 241) and augment the covariate set for the regressions with missingness indicators so that we can use the complete data for the estimation. Each missingness indicator is coded as 1 if information on a particular characteristic was not reported to voters and 0 otherwise. Additionally, we fill in the missing data for the original variables that measure the respective characteristics with arbitrary fixed values that are not observed for any applicant (such as−1 for age). Notice that these fill-in values affect only the coefficients on the missingness indicators (which are arbitrary and therefore not shown in the regression tables) but not the coefficients on the actual applicant characteristics.
FIGURE 1. Opposition to Naturalization Requests
Proportion Voting 'No' on Naturalization Application (%) Ennetmoos Stansstad Davos Dallenwil Teufen Hergiswil Trogen Speicher Beckenried Morschach Walzenhausen Stans Heiden St. Margrethen Buochs Malters Urnäsch Galgenen Steinen Chur Gais Bühler Wollerau Gersau Weggis Altdorf Küssnacht Ingenbohl Lachen Feusisberg Freienbach Wolfenschiessen Einsiedeln Unteriberg Schwyz Altendorf Oberiberg Emmen Schübelbach Rothenthurm Arth Tuggen Reichenburg Wangen ● ● ● ● ● ● ● ● ● ● ● ● ● ● ● ● ● ● ● ● ● ● ● ● ● ● ● ● 0 20 40 60 80
Note: Distribution of proportion of “no” votes across naturalization referendums in each ballot box municipality. Width of box measures the interquartile range, the vertical line decodes the median.
applicants from (the former) Yugoslavia and Turkey who—as we show below—have the highest proportion of “no” votes.33Apart from the variation between mu-nicipalities, the most striking feature in Figure 1 is that 33Other factors may have contributed to this difference. Turnout was typically lower at the citizens’ assembly since fewer voters were willing to sit through the meetings. This selection effect could have increased the proportion of “no” votes if the meetings attracted more voters concerned about voting against immigrants. However,
meetings were typically dominated by decisions about other mu-nicipal affairs (e.g., budget, expenditures, etc.) and therefore may have attracted citizens with more political interest. Empirical data on attendance is limited, but according to a survey of municipality of-ficials by Ladner et al. (2009), older residents and residents who have lived in a community for a long time are typically over-represented at assembly meetings, while residents with higher incomes and ed-ucation levels are typically under-represented. This suggests that the selection effect increased opposition to naturalization requests
opposition to naturalization requests also varies dra-matically within each municipality. The interquartile range of the proportion of “no” votes is about 20 per-centage points on average, which suggests that aside from the general differences between municipalities, local voters reveal very heterogenous preferences for different types of immigrants who apply in the same municipality.
Effects of Immigrant Attributes
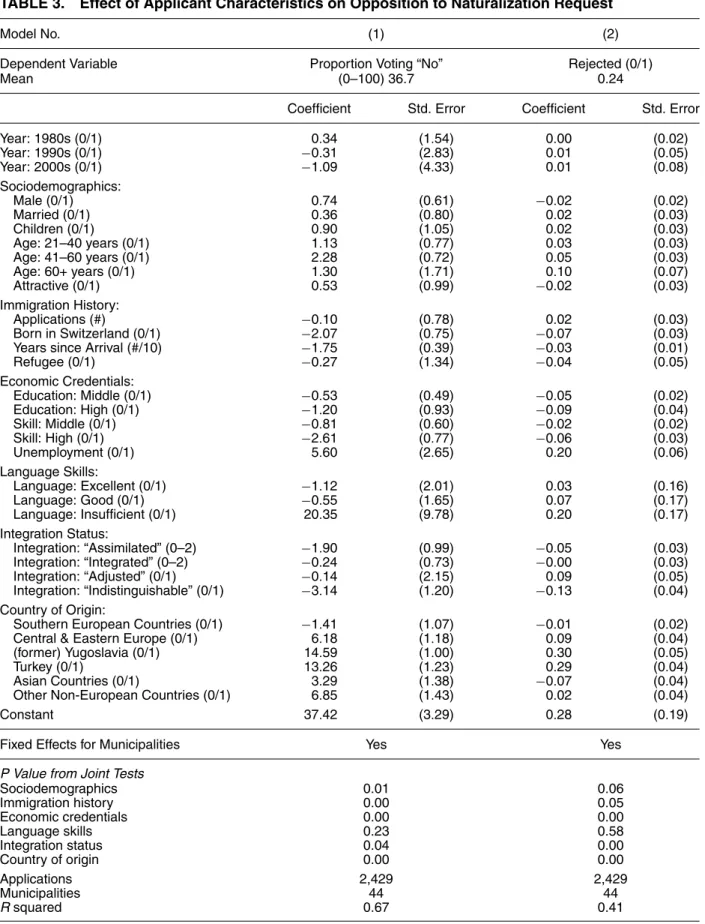
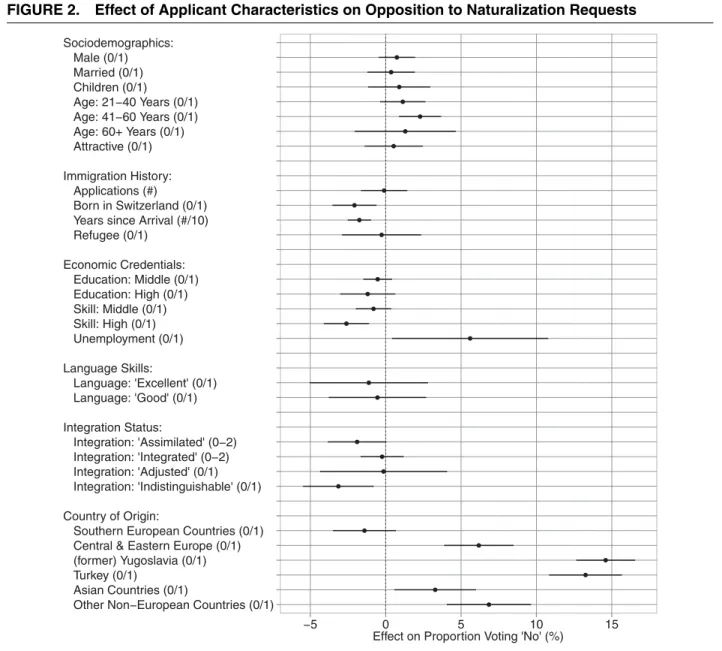
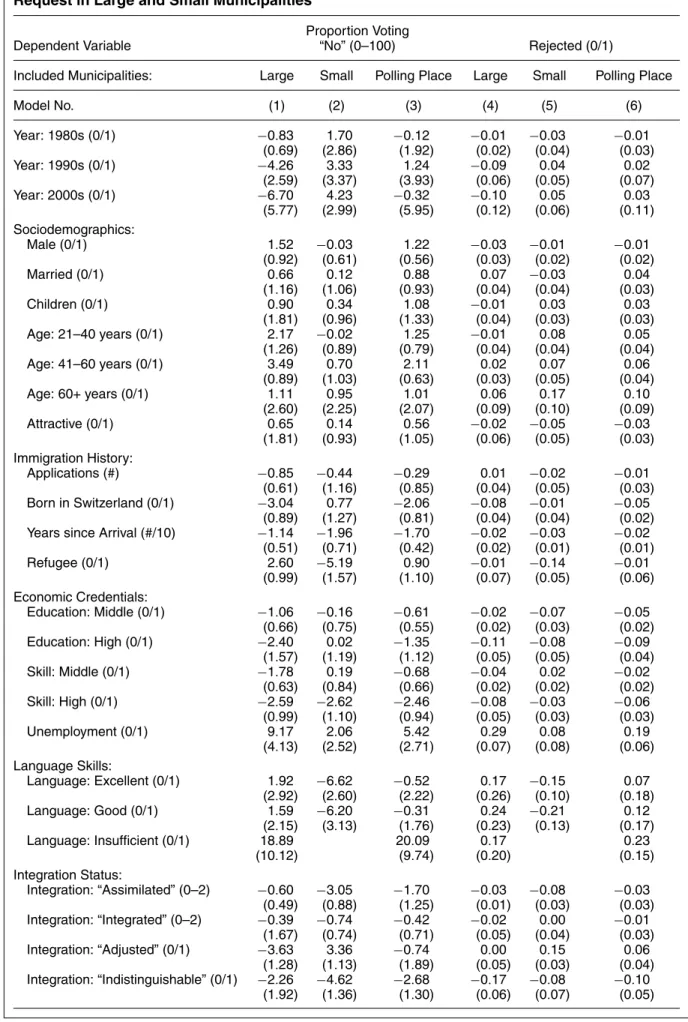
Why do natives regard some immigrant applicants as worthy of earning Swiss citizenship while rejecting oth-ers? To explore the revealed immigration preferences, we regress the proportion of “no” votes on the appli-cant characteristics and a full set of municipality fixed effects so that the effects of the applicant characteristics are identified purely based on the within-municipality variation. We also include a full set of decade fixed effects to account for common temporal trends in the naturalization rate and cluster standard errors at the municipality level. Model 1 in Table 3 presents the regression results. To facilitate the interpretation, Figure 2 plots the marginal effects with 95% confidence intervals.
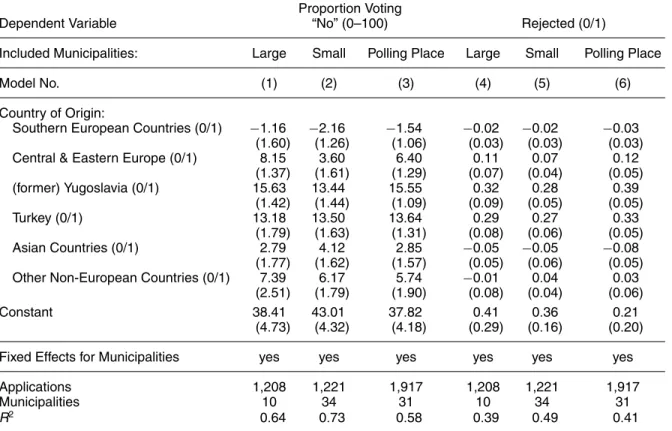
The applicant’s country of origin has the most im-portant impact on the outcome of naturalization ref-erendums. Holding other characteristics constant, the proportion of “no” votes for applicants from (the for-mer) Yugoslavia is about 15 percentage points higher (t value> 14.5) than for observably similar applicants from richer northern and western European countries (the reference category). This constitutes an increase of about 40% over the average proportion of “no” votes. Turkish applicants fare just as poorly with an average proportion of “no” votes that is 13 percentage points higher (t value> 10.7), a 35% increase over the average level of opposition. We find similar penalties of about 6 percentage points (t value> 5.2) for appli-cants from other central or eastern European countries, about 3.5 percentage points (t value> 2.3) for appli-cants from Asian countries, and about 7 percentage points (t value> 4.7) for applicants from other non-European countries. Applicants from southern Euro-pean countries are the only ones who earn a lower proportion of “no” votes compared to observably sim-ilar applicants from richer northern and western Euro-pean countries, although the premium is small at about 1.4 percentage points and falls short of conventional significance levels. Taken together, country of origin accounts for about 40% of the within-municipality variation in the levels of opposition to naturalization requests.
(in survey studies, education and income are commonly negatively correlated, and age is positively correlated with anti-immigrant sentiment). Finally, social interaction at the assembly meetings could have also affected the votes in subtle ways. Voters may have felt a greater sense of scrutiny by others, and this social pressure could have affected votes even though voting occurred by closed ballots and naturalization requests were rarely openly discussed.
What else affects the likelihood of being rejected for citizenship? We find that sociodemographics such as age, gender, marital status, attractiveness, or chil-dren have little effect overall. If anything, middle-aged applicants (21–60 years) earn a penalty of about 2 per-centage points compared to the reference category of younger applicants (≤20 years), but there is no such penalty for older applicants (≥60 years).
The applicant’s immigration history matters some-what for the naturalization success. Applicants who are born in Switzerland earn a premium of about 2 percentage points (t value> 2.7) compared to foreign-born applicants. This effect may seem surprisingly small from a comparative perspective given that place of birth is the main requirement for granting citizenship in
jus soli countries such as the United States. Natives also
reward applicants for longer residency in Switzerland, but the rewards are rather paltry. A 10-year increase in residency decreases the proportion of “no” votes by merely 1.7 percentage points on average (t value> 4.4); given this modest effect size, even an implausibly large increase from the shortest to the longest residency in our sample (75 years) would not be sufficient to com-pensate for the disadvantage that applicants from (the former) Yugoslavia and Turkey face due to the country of origin effects. History as a refugee and the number of prior applications have no consistent effects on the level of opposition.
We find that voters systematically reward appli-cants for better economic credentials. Appliappli-cants in the highest occupational skill category (managers, se-nior officials, professionals, etc.) earn a premium of about 2.6 percentage points compared to applicants in the lowest skill category (elementary occupations, assemblers, etc.). Similarly, immigrants with high edu-cational attainment earn a premium of about 1.2 per-centage points compared to observably similar appli-cants with low education levels, again a very mod-est gain compared to the magnitude of the origin disadvantages.34Applicants who experienced a period of unemployment face a penalty of about 6 percent-age points, suggesting that voters have a rather strong distaste for such applicants. This effect is fairly ro-bust but not very precisely estimated since there are few applicants with unemployment experience in our sample.
Assessed language skills have almost no effect on naturalization success. There are no significant dif-ferences in the proportion of “no” votes for appli-cants who are described to voters as having suffi-cient or a good command of German. Even applicants who speak the local Swiss-German dialect perfectly (“perfekt Mundart”) earn no significant advantage. The only exceptions are applicants for whom officials de-scribe their language skills as insufficient. The pro-portion of “no” votes for this group is 20 percentage
34The results are similar if we use the continuous years of schooling measure; for example, it would require an implausible 56 years of education for an applicant from Turkey to make up for her origin-based disadvantage.
TABLE 3. Effect of Applicant Characteristics on Opposition to Naturalization Request
Model No. (1) (2)
Dependent Variable Proportion Voting “No” Rejected (0/1)
Mean (0–100) 36.7 0.24
Coefficient Std. Error Coefficient Std. Error
Year: 1980s (0/1) 0.34 (1.54) 0.00 (0.02) Year: 1990s (0/1) −0.31 (2.83) 0.01 (0.05) Year: 2000s (0/1) −1.09 (4.33) 0.01 (0.08) Sociodemographics: Male (0/1) 0.74 (0.61) −0.02 (0.02) Married (0/1) 0.36 (0.80) 0.02 (0.03) Children (0/1) 0.90 (1.05) 0.02 (0.03) Age: 21–40 years (0/1) 1.13 (0.77) 0.03 (0.03) Age: 41–60 years (0/1) 2.28 (0.72) 0.05 (0.03) Age: 60+ years (0/1) 1.30 (1.71) 0.10 (0.07) Attractive (0/1) 0.53 (0.99) −0.02 (0.03) Immigration History: Applications (#) −0.10 (0.78) 0.02 (0.03) Born in Switzerland (0/1) −2.07 (0.75) −0.07 (0.03)
Years since Arrival (#/10) −1.75 (0.39) −0.03 (0.01)
Refugee (0/1) −0.27 (1.34) −0.04 (0.05) Economic Credentials: Education: Middle (0/1) −0.53 (0.49) −0.05 (0.02) Education: High (0/1) −1.20 (0.93) −0.09 (0.04) Skill: Middle (0/1) −0.81 (0.60) −0.02 (0.02) Skill: High (0/1) −2.61 (0.77) −0.06 (0.03) Unemployment (0/1) 5.60 (2.65) 0.20 (0.06) Language Skills: Language: Excellent (0/1) −1.12 (2.01) 0.03 (0.16) Language: Good (0/1) −0.55 (1.65) 0.07 (0.17) Language: Insufficient (0/1) 20.35 (9.78) 0.20 (0.17) Integration Status: Integration: “Assimilated” (0–2) −1.90 (0.99) −0.05 (0.03) Integration: “Integrated” (0–2) −0.24 (0.73) −0.00 (0.03) Integration: “Adjusted” (0/1) −0.14 (2.15) 0.09 (0.05) Integration: “Indistinguishable” (0/1) −3.14 (1.20) −0.13 (0.04) Country of Origin:
Southern European Countries (0/1) −1.41 (1.07) −0.01 (0.02)
Central & Eastern Europe (0/1) 6.18 (1.18) 0.09 (0.04)
(former) Yugoslavia (0/1) 14.59 (1.00) 0.30 (0.05)
Turkey (0/1) 13.26 (1.23) 0.29 (0.04)
Asian Countries (0/1) 3.29 (1.38) −0.07 (0.04)
Other Non-European Countries (0/1) 6.85 (1.43) 0.02 (0.04)
Constant 37.42 (3.29) 0.28 (0.19)
Fixed Effects for Municipalities Yes Yes
P Value from Joint Tests
Sociodemographics 0.01 0.06 Immigration history 0.00 0.05 Economic credentials 0.00 0.00 Language skills 0.23 0.58 Integration status 0.04 0.00 Country of origin 0.00 0.00 Applications 2,429 2,429 Municipalities 44 44 R squared 0.67 0.41
Note: Point estimates and parenthesized standard errors (clustered by municipality) shown from OLS regressions with municipality fixed effects. The dependent variable is the proportion of “no” votes in Model 1 and a binary indicator coded as 1 for rejected and 0 for accepted applications in Model 2. The reference categories for the various contrasts are as follows: an indicator for the years 1970–1979, applicants with age<20 years, with low education, in low skilled jobs, with “sufficient” command of one of the Swiss languages, who are familiar with “Swiss traditions and customs,” and originating from a richer northern and western European country.
Pvalues shown from anFtest for joint significance of the batch of variables for sociodemographics, immigration history, economic credentials, language skills, integration status, and country of origin, respectively.