HAL Id: cea-01004374
https://hal-cea.archives-ouvertes.fr/cea-01004374
Submitted on 3 Nov 2020
HAL is a multi-disciplinary open access
archive for the deposit and dissemination of
sci-entific research documents, whether they are
pub-lished or not. The documents may come from
teaching and research institutions in France or
abroad, or from public or private research centers.
L’archive ouverte pluridisciplinaire HAL, est
destinée au dépôt et à la diffusion de documents
scientifiques de niveau recherche, publiés ou non,
émanant des établissements d’enseignement et de
recherche français ou étrangers, des laboratoires
publics ou privés.
redshift: passive early-type galaxies in a cluster at
redshift 2
V. Strazzullo, R. Gobat, Emanuele Daddi, M. Onodera, M. Carollo, M.
Dickinson, A. Renzini, N. Arimoto, Alessandro Cimatti, A. Finoguenov, et al.
To cite this version:
V. Strazzullo, R. Gobat, Emanuele Daddi, M. Onodera, M. Carollo, et al.. Galaxy evolution in
overdense environments at high redshift: passive early-type galaxies in a cluster at redshift 2.
The Astrophysical Journal, American Astronomical Society, 2013, 772 (2), pp.17.
�10.1088/0004-637X/772/2/118�. �cea-01004374�
arXiv:1305.3577v1 [astro-ph.CO] 15 May 2013
GALAXY EVOLUTION IN OVERDENSE ENVIRONMENTS AT HIGH REDSHIFT: PASSIVE EARLY-TYPE GALAXIES IN A CLUSTER AT REDSHIFT 2
V. STRAZZULLO1, R. GOBAT1, E. DADDI1, M. ONODERA2, M. CAROLLO2, M. DICKINSON3, A. RENZINI4, N. ARIMOTO5,6, A. CIMATTI7, A. FINOGUENOV8, R.-R. CHARY9
Draft version October 29, 2018 ABSTRACT
We present a study of galaxy populations in the central region of the IRAC-selected, X-ray detected galaxy cluster Cl J1449+0856 at z = 2. Based on a sample of spectroscopic and photometric cluster members, we in-vestigate stellar populations and morphological structure of cluster galaxies over an area of ∼0.7Mpc2around the cluster core. The cluster stands out as a clear overdensity both in redshift space, and in the spatial distri-bution of galaxies close to the center of the extended X-ray emission. The cluster core region (r < 200 kpc) shows a clearly enhanced passive fraction with respect to field levels. However, together with a population of massive passive galaxies mostly with early-type morphologies, it also hosts massive actively star-forming, often highly dust-reddened sources. Close to the cluster center, a multi-component system of passive and star-forming galaxies could be the future BCG still assembling. We observe a clear correlation between passive stellar populations and an early-type morphology, in agreement with field studies at similar redshift. Passive early-type galaxies in this clusters are typically a factor 2-3 smaller than similarly massive early-types at z ∼ 0, but also on average larger by a factor ∼ 2 than their field analogs at z ∼ 2, lending support to recent claims of an accelerated structural evolution in high-redshift dense environments. These results point towards the early formation of a population of massive galaxies, already evolved both in their structure and stellar populations, coexisting with still-actively forming massive galaxies in the central regions of young clusters 10 billion years ago.
Subject headings: galaxies: clusters (Cl J1449+0856) – galaxies: evolution – galaxies: high redshift – galaxies:
structure – galaxies: stellar content
1. INTRODUCTION
In the nearby Universe and at least up to z∼1, over-dense environments, and specifically galaxy cluster cores, are invariably found to preferentially host galaxy popula-tions dominated by massive, passive early-type galaxies (e.g.,
among many others, Dressler 1980, Postman et al. 2005,
Baldry et al. 2006, van der Wel et al. 2007, Patel et al. 2009, Rosati et al. 2009, Peng et al. 2010b, Wetzel et al. 2012). The way these galaxies are formed and evolve is a longstand-ing matter of debate, with different pieces of their forma-tion history, and in particular peculiarities with respect to field galaxies, being put together thanks to high-redshift observa-tions (e.g., van Dokkum & van der Marel 2007, Gobat et al. 2008, Mei et al. 2009, Rettura et al. 2010) as well as fossil-record studies (e.g., Thomas et al. 2005 2010). Most stud-ies agree on the early formation of a population of massive cluster early-types, with their stars formed at high redshift (z ∼ 2 or beyond), and their mass largely assembled
be-1CEA Saclay, Orme des Merisiers, 91191 Gif sur Yvette, France 2Institute for Astronomy, ETH Z ¨urich Wolfgang-Pauli-strasse 27, CH-8093 Z ¨urich, Switzerland
3National Optical Astronomy Observatory, P.O. Box 26732, Tucson, AZ 85726, USA
4INAF, Osservatorio Astronomico di Padova Vicolo dellOsservatorio 5, 35122 Padova, Italy
5Subaru Telescope, 650 North Aohoku Place, Hilo, HI 96720, USA 6Graduate University for Advanced Studies, 2-21-1 Osawa, Mitaka, Tokyo 181-8588, Japan
7Universit`a di Bologna, Dipartimento di Astronomia, via Ranzani 1, 40127 Bologna, Italy
8Department of Physics, University of Helsinki, Gustaf H¨allstr¨omin katu 2a, FI-00014 Helsinki, Finland
9Division of Physics, Mathematics and Astronomy, California Institute of Technology, Pasadena, CA 91125, USA
fore z ∼ 1 (e.g., De Propris et al. 2007, Lidman et al. 2008, Andreon 2008, Mancone et al. 2010, Strazzullo et al. 2010).
While detailed studies of cluster galaxy populations are rel-atively common up to redshift one, they become increasingly rarer at higher redshifts, and in particular beyond z ∼ 1.5, due to observational challenges both in reliably identifying clusters, and in accurately determining the properties of their galaxies. Nonetheless, the z > 1.5 range is a crucial epoch to study massive cluster galaxies close to their main forma-tion epoch. Indeed, recent observaforma-tions of z & 1.5 clusters started to show that massive galaxy populations are often in a still active formation stage, even in the cluster core (e.g., Tran et al. 2010, Hilton et al. 2010, Hayashi et al. 2010 2011, Santos et al. 2011, Fassbender et al. 2011b).
From the theoretical point of view, current models, while invoking an early formation for the stars ending up in mas-sive early-type galaxies today, maintain their hierarchical na-ture in predicting the late assembly of their stellar mass from smaller, mostly passive progenitors (e.g., De Lucia et al. 2006, Johansson et al. 2012). The relevance of such merg-ing events, as well as of other processes (e.g., AGN or stellar feedback), possibly affecting both the star formation history and the galaxy structure in the evolutionary path of these sys-tems, may be probed by the (albeit biased and complicated) comparison of cluster galaxy samples at different redshifts.
Reaching the cosmic epochs when massive cluster galax-ies are still forming is thus fundamental in order to directly observe the formation of the bulk of the stars, the way stel-lar mass is assembled, and their morphological evolution, that together lead to the massive early-types dominating cluster cores at later times.
clus-ters which are not pre-selected based on the characteristics of their galaxy populations, but rather based on their mass or overdensity. At this redshift, and with current facilities, X-ray selection becomes very challenging for the identifica-tion of moderately massive systems representative of the pro-genitors of typical lower-redshift clusters. On the other hand, “IRAC-selected” clusters identified based on overdensities of stellar mass-limited galaxy samples (Eisenhardt et al. 2008, Papovich 2008), ideally with a-posteriori detection of a (gen-erally faint) X-ray emission, offer a suitable alternative for the identification of clusters beyond z ∼ 1.5.
In this work, we study galaxy populations in the IRAC-selected and X-ray detected cluster Cl J1449+0856 at z = 2 (RA = 14h49m14s, Dec = 8◦56′21′′, Gobat et al. 2011,
2013). This is among the most distant spectroscopically con-firmed galaxy clusters discovered so far, and the most distant with a detected X-ray emission. The first spectroscopic in-vestigation with VLT/VIMOS and FORS2 spectroscopy on a wide field around the cluster, found a peak in the redshift distribution of star-forming galaxies at z ∼ 2.07 (Gobat et al. 2011).
Subsequent follow-up on the cluster center with slitless HST/WFC3 spectroscopy, unveiled a much stronger peak in the redshift distribution at z=2, which is the most prominent peak in the area of the galaxy overdensity, and contains about 20 spectroscopic cluster members to date, including spectro-scopically confirmed massive passive red galaxies in the clus-ter core (Gobat et al. 2013). Cl J1449+0856 is thus now spec-troscopically confirmed to be at z=2.
Given the massive use of photometric redshifts required to carry out this work, we are not able to distinguish galaxies at z=2 from galaxies at z=2.07, and we thus retain sources belonging to the z=2.07 structure in our sample of candidate members (unless a spectroscopic redshift is available). On the other hand, as discussed in detail in the Gobat et al. (2013) companion paper, the z=2.07 redshift peak seems to be asso-ciated to a large scale, less prominent, diffuse structure, which does not significantly contribute to the overdensity in the cen-tral cluster region studied here, and is likely not to signifi-cantly affect most of the results presented in this work.
A wide multi-wavelength coverage, and high-resolution restframe optical imaging, allow us to study in detail funda-mental properties of cluster galaxies already 10 billion years ago. In particular, we focus in this paper on the identification of a population of passive candidate members, and on their structural properties. The trademark cluster-core galaxies up to z ∼ 1, massive galaxies with low star formation are in fact expected to be significantly rarer by redshift two, approaching the epoch where not only they are still forming many of their stars, but also when velocity dispersion in the cluster core is still low enough that merging-driven mass assembly can play an important role. Although conclusive evidence is still lack-ing, the early merging of already gas-poor galaxies in an over-dense environment might also affect the structural properties of the resulting massive, passive systems, producing galaxies which are structurally more evolved than their field counter-parts. While statistics are still poor, Cl J1449+0856 offers one of the very rare chances of studying passive early-types very close to their formation epoch, together with still actively forming galaxies, in an already relatively evolved cluster core.
Throughout this work we assume ΩM=0.3, ΩΛ=0.7,
H0=70 km s−1Mpc−1, and a Salpeter (1955) IMF. Magnitudes and colors are in the AB system.
2. DATA AND SAMPLE SELECTION
2.1. Catalogs and derived quantities
2.1.1. Photometry
We use photometry measured on imaging in the U,V (VLT/FORS), B,R,i,z (Subaru/Suprime-Cam), Y,J,H,Ks
(Sub-aru/MOIRCS, plus additional VLT/ISAAC data for J and Ks),
F140W (HST/WFC3), and 3.6,4.5µm (Spitzer/IRAC) bands. Sources were extracted with SExtractor (Bertin & Arnouts 1996) on the F140W image, and photometry was measured in two ways, producing two independent multi–wavelength catalogs. One catalog is based on aperture photometry (1.5”) measured with SExtractor, corrected for the different resolu-tion of the images by using aperture correcresolu-tions estimated on each image from the growth curve of point–like sources. The other catalog is based on photometry measured on each image by fitting with Galfit (Peng et al. 2002 2010a) Gaus-sian profiles, convolved with the image PSF, at the position of the F140W sources. While the two approches yield broadly consistent measurements, in most cases aperture photometry will be more accurate1. On the other hand, and especially in crowded fields typical of a cluster core, blending may be a se-vere issue and the second approach offers a way to deal with it. In order to take this into account, in the following we will use both catalogs as described in detail in section 2.1.2.
In the following we select a sample with m140 < 25.7 (corresponding to the 10σ limit in a 1” aperture), within an area of ∼3.3 square arcminutes uniformly covered in the
WFC3/F140W imaging. This catalog contains ∼370
ob-jects. Seven point-like sources (in the F140W image) down to m140∼22 were removed; at fainter magnitudes, we further removed ∼ 30 sources which may be stars based on their BzK colors (Daddi et al. 2004). The inclusion or removal of these sources has no impact on the results of this work. The galaxy sample we use in the following thus contains ∼330 galaxies down to m140= 25.7.
2.1.2. Photometric redshifts
From the 13-bands photometry, we estimated photometric redshifts (photo–zs) with EAZY, using the standard set of templates (Brammer et al. 2008 2011, Whitaker et al. 2011). Before the actual photo–z estimation, we determined pos-sible offsets in the photometry in different bands by itera-tively comparing the best-fit vs. measured photometry at fixed (spectroscopic) redshift (e.g., Capak et al. 2007, Ilbert et al. 2009) for a sample of ∼ 110 sources with redshifts mea-sured from WFC3 grism spectroscopy over the whole WFC3-covered field2 (Gobat et al. 2013). Systematic offsets be-tween measured photometry and model SED for spectro-scopic sources can be attributed to different causes includ-ing zero-point and/or aperture correction errors, as well as model uncertainties3. In the following, we use photometry corrected for these systematic offsets; we note that the off-1Note that this is not a general statement: it is true, as results from simu-lations, given the specific approach and settings we use. A further indication of the generally more accurate aperture photometry in our case, comes from photo-z performance as discussed in section 2.1.2.
2Out of these, 94 are in the uniformly covered WFC3 image area used in the following analysis of galaxy populations, the remaining being located in the external part of the WFC3 image.
3For our catalogs and with our settings, offsets were in most cases <10-20%, except for bands with large uncertainties in the determination of the photometric zero-point – as often suggested also by comparison of SEDs of stars with stellar templates – and/or in the instrument response function.
FIG. 1.— The comparison of photometric and spectroscopic redshifts for the available spectroscopic sample. All available spectroscopic redshifts are shown, but secure and less reliable zspecdeterminations are shown as black
and gray dots, respectively. The lower panel shows zphot−zspec
1+zspec vs. zspec. In
all panels, the solid line traces zphot = zspecand the dotted lines show a ∆z/(1 + z) of 5, 10, and 20%. Thin and thick gray circles around symbols highlight sources brighter than I<25 and 23 mag, respectively, as indicated in the legend.
sets determined for the two independent photometric catalogs (SExtractor- and Galfit-based) are generally consistent within ∼10%.
The interquartile redshift range of the spectroscopic sample is z=[1.1-2] (with redshifts up to z∼3), and its interquartile
m140range is m140=[22.7-24.3] (reaching up to m140∼25.5). Therefore, while compared to the whole sample of m140 < 25.7 sources the spectroscopic sample is obviously typically brighter, it can still be considered generally representative of sources in the magnitude and redshift ranges that are the focus of this study.
Photo–zs were determined for both (SExtractor- and Galfit-based) catalogs, and for the SExtractor catalog they were also determined excluding the IRAC bands. The comparison of these three different photo-z determinations was used to im-prove the photo–z accuracy, selecting for each source the best estimate to be used, as follows. By comparison with the spectroscopic catalog, we find that photo–zs determined from aperture photometry including IRAC bands show the lowest scatter, but also a significant fraction of outliers (almost 10%). For sources in the magnitude range typical of our spectro-scopic sample, outliers may be due to fatal errors and/or de-generacies (e.g., a double-peaked photo–z probability distri-bution), with these conditions worsened by systematic offsets in the photometry (of some bands) due to bad resolution (and thus contamination by neighboring sources). In such cases, the Galfit-based photometry – and thus the derived photo-z – may be more accurate than SExtractor aperture photometry, as discussed above.
We identified sources potentially affected by neighbor’s contamination by selecting in the Ksand 3.6µm bands objects
which were falling in the circle contaning 99% of the flux of a different source4. In the area and magnitude range that we use in this work, about 10% of our sample is classified as po-tentially contaminated at the K-band resolution (∼0.65”), and ∼50% at the IRAC resolution (∼2”).
For uncontaminated sources we use photo-zs from the SEx-tractor catalog, as well as for sources where only the IRAC photometry is flagged as potentially contaminated and the SExtractor-based photo-zs with and without IRAC bands are consistent. For the remaining sources (about 20% of the sam-ple) photos-zs from the Galfit catalog are used.
Applying this approach and comparing to the spectroscopic sample, and in spite of the comprehensibly smaller fraction (30%) of potentially contaminated sources in the spectro-scopic vs. the full sample (50%), we find that we can sig-nificantly reduce the fraction of catastrophic outliers, while retaining the higher photo-z accuracy obtained with aperture photometry for the majority of the sample. The final photo-z catalog we use in the following has a scatter (as estimated with the normalized median absolute deviation (NMAD), Hoaglin et al. 1983) of 5.7% in ∆z/(1+z), and 3% catastrophic outliers (|∆z|/(1 + z) > 0.2) (at least half of these have a “less reliable” spectroscopic redshift determination, see Figure 1). The comparison of photometric redshifts with the available spectroscopic sample is shown in Figure 1. For comparison with other studies, we note that, thanks to the WFC3 slitless spectroscopy, the spectroscopic sample we use is considerably deeper than those generally obtained from ground-based spec-troscopy, with the median I band magnitude of our spectro-scopic sample ∼25, and almost 80% of the sample fainter than I=24. For instance, considering only spectroscopic sources brighter than I=25 (23) the NMAD scatter of ∆z/(1 + z) would be <4.5% (< 2.5%).
2.1.3. Stellar masses
Stellar masses were determined with FAST (Kriek et al. 2009) on the 13-bands U to 4.5µm photometry, using Bruzual & Charlot (2003, hereafter, BC03) delayed expo-nentially declining star formation histories (SFHs, ψ(t) ∝
t
τ2exp(−t/τ)) with 0.01< τ <10 Gyr, solar metallicities,
Salpeter IMF, and the Calzetti et al. (2000) reddening law with E(B-V) up to 1 mag. Stellar masses were independently derived for both the SExtractor and the Galfit catalogs: for sources where contamination was expected to significantly af-fect the aperture-based SED, as discussed concerning photo-zs in section 2.1.2, stellar masses from the Galfit catalog were used.
Masses from the SExtractor catalog were corrected to ”to-tal” masses using the ratio between AUTO and aperture flux in the detection image (F140W). For the m140 < 25.7 sam-ple, more than 90% of the objects have a correction lower than 50%, and only ∼3% of sources have correction factors & 2. While this approach corrects for the bulk of the flux loss, we note that it still relies on approximating the total flux with FLUX AUTO, and it is based on just one band thus ne-glects any color gradient within the galaxy. In this respect, we note that the systematic offset between stellar masses from the Galfit catalog and the two SExtractor catalogs (with and 4This approach is quite conservative in that it does not make assumptions on the relative flux of the neighbors and includes potential contamination also from much fainter sources.
without IRAC, corrected to total masses) is less than 0.1dex, with a scatter of up to ∼0.3dex. Leaving the metallicity free, and using exponentially declining SFHs rather than delayed exponentials, would introduce no systematics for the over-all sample and a further scatter of less than 0.1dex in stellar mass (which is small compared to the scatter estimated above at fixed metallicity and SFH). With respect to the choice of the SFH, we note that it has been shown how other forms of SFHs might be more appropriate for star-forming galaxies at high redshift (Maraston et al. 2010, Papovich et al. 2011). For what directly concerns this work, rising or constant (pos-sibly truncated) SFHs would change the stellar masses of our targets negligibly, and in any case well within the estimated errors. Other parameters which may be more affected by the SFH choice (like, notably, star formation rates and ages of star-forming galaxies) are not used in this paper.
On the other hand, using Maraston (2005, hereafter, M05) rather than BC03 models would produce stellar masses sys-tematically smaller (overall for the sample of interest) by a factor ∼0.15dex, with a scatter of ∼0.15dex; this is discussed in detail below, where relevant. After accounting for the over-all 0.15dex systematic offset, the stellar mass determinations with BC03 and M05 models (with metallicity either fixed to Z⊙ or allowed to vary within a factor 2 from a Z⊙) are
con-sistent within a factor of at most 2 for >90% of the sample of interest.
Finally, the median formal error on stellar masses for our sample of candidate members is 0.2-0.3 dex (or 0.1-0.15 dex for m140 < 24.5). In summary, we thus estimate a typical accuracy of about a factor 2 for the stellar mass determination for our targets.
2.2. Morphological analysis
A rough indication of galaxy structure (early type vs. late type), effective radius and ellipticity, was obtained by model-ing of the 2D surface brightness distribution, carried out with Galfit (version 3) assuming a single Sersic profile for each F140W-detected source. The modeling was performed on the WFC3 F140W image, which has the best resolution in our data set, and probes the restframe optical light (approximately B band) at the cluster redshift. We used a PSF built from the data by using median stacking of 6 high S/N stars in the field. The background was measured and subtracted locally over the whole image, and was fixed to zero in the fit. The whole im-age (and thus each source) was fitted multiple times, split in overlapping cutouts of different sizes5, modeling simultane-ously all sources in the cutout.
In order to estimate the reliability of the results as a func-tion of magnitude and profile type, specifically for the im-age and fitting settings that we used, we carried out simula-tions of the fitting procedure by adding synthetic sources in blank parts of the image. Sources with a range of magnitudes,
nS ersic, radius, ellipticity and position angle were added and
then fitted with Galfit using the same procedure used for real objects. These simulations provide an estimate of the reliabil-ity of our analysis in somewhat “optimistic conditions”, since they assume that sources are relatively isolated, regular Ser-sic profiles, convolved with the same PSF that we use for the 5For each source, the final estimate of each parameter was calculated as the median among all fits with residuals of <25% on at least 90% of the S/N>10 pixels. Overall, 3/4 (1/2) of the sources in the magnitude range of interest (m140 .24.5, see below) has results derived from the median of at least 5 (>10) different fits, respectively.
actual fitting. The input flux is recovered within 10% down to m140= 24.5 (corresponding to ∼30 times the noise in a 1” aperture). At this magnitude, these simulations suggest that the error on the semi-major axis is ∼10, 15, 25% for profiles with nS ersic <1.5, 1.5-3, >3, respectively, while the error on
the Sersic index is between ∼ 25% for late-type profiles and ∼30% for early-type profiles. In addition, as it is known from previous work (e.g., Trujillo et al. 2006b, Sargent et al. 2007, Pannella et al. 2009) at faint magnitudes the Sersic index of high-Sersic profiles tends to be underestimated; with our set-tings, at m140= 24.5, these simulations find a median offset in the Sersic index of about −10% for early-type profiles (disk-like profiles are unaffected). This systematic underestimation is negligible down to m140∼24, where errors on semi-major axis are <5%, 20%, and errors on nS ersic<15%, 20%, for
low-and high-Sersic profiles, respectively. All parameters, for all kinds of profiles, are retrieved at better than 10% down to
m140∼23 (corresponding to S/N∼100 in a 1” aperture). Based on these simulations we set m140= 24.5 as the limit-ing magnitude where we consider our surface brightness mod-elling reliable. Beside the general m140 < 25.7 sample, we will thus consider this m140 < 24.5 sample for the morpho-logical analysis. Galaxy sizes quoted in the following are the circularised half-light radii, calculated from the Galfit-based parameters as the effective semi-major axis times the square root of the axis ratio.
2.3. The candidate member sample
A spectroscopic redshift is measured for about one fourth of the m140 <25.7 sample, and for ∼45% of the m140<24.5 sample. Based on the available spectroscopy, and otherwise on the photo-z analysis, we thus determine which sources in our sample are (candidate) cluster members.
We select as spectroscopic members all sources with spec-troscopic redshift 1.97 < z < 2.01. All other specspec-troscopic sources are considered interlopers. From the spectroscopic sample of Gobat et al. (2013), we retain 14 cluster mem-bers in the area studied in this work. One source in the 1.97 < z < 2.01 range, close to the edge of the studied area, is not in our catalog being close to a bright star. From its spectrum it is classified as a star forming source, and given its position more than 600 kpc away from the cluster cen-ter it would not alcen-ter (if anything it would rather reinforce) the conclusions of this study. Furthermore, an X-ray detected AGN classified as a cluster member in Gobat et al. (2013) is not included in our member sample. This source appears to have a very close neighbor at ∼ 0.5′′distance (with undeter-mined redshift), producing a likely significant contamination to its observed SED. Assuming that both sources belong to the cluster, and that the measured photometry is not significantly altered by the emission of the AGN, the total observed SED produced by both sources would suggest a dusty star-forming stellar population. The morphology of the AGN host appears very compact, essentially unresolved (although its magnitude is close to the limit where we can carry out a reliable morpho-logical analysis). Because of such considerable uncertainties in determining the properties of this source, we will not con-sider it in the following analysis of galaxies in Cl J1449+0856. For all sources without an available spectroscopic redshift, we rely on zs. In determining membership by photo-zs, we decided not to purely rely on the redshift probability distribution estimated by EAZY for each object. We adopted instead an hybrid approach, taking into account also the “em-pirical” photo-z uncertainty as independently determined by
comparison with the spectroscopic sample. By analysing photo-z results for spectroscopic sources (for the full spec-troscopic sample, not just cluster members) as a function of photo-z probability distribution and quality of the best fit, we first estimated the likely reliability of a photo-z given its odds and χ2 calculated by EAZY (within our catalog). Based on such comparison, we deemed as “most reliable” photo-zs with odds>98% and a χ2within three times the median χ2in our catalog. To the other extreme, we defined as “unreliable” photo-zs with odds lower than 95%, or with χ2 worse than six times the median χ2.
For the purpose of membership assignment, the full sample was then split in three classes of objects, identified as inter-lopers, “likely” candidate members, and “possible” candidate members (which are lower-priority candidates, mainly due to a more uncertain photo-z determination), as follows. Based on the observed scatter of ∆z/(1+z) (Sec. 2.1.2), and consid-ering the estimated low fraction of catastrophic failures, all galaxies with a photo-z beyond 2σ from the cluster redshift are considered interlopers, except those within 3.5σ and with a photo-z deemed unreliable, which are retained as possible members. All galaxies with a photo-z within 2σ from the cluster redshift are considered as possible members, unless they have a highly reliable z and an integrated photo-z probability distribution within 1σ of the cluster redshift6
P(zcl) >30%, which classifies them as likely members. All
galaxies with a photo-z within 1σ of the cluster redshift are selected as likely members.
Likely members make up ∼15% of the full sample, and a further 15% is made of possible members. The remaining ∼70% of the full sample is rejected as foreground (∼55%) or background (∼15%) interlopers.
For comparison with other studies, we note that ∼3/4 of galaxies selected as likely members have P(zcl) >30% (with
P(zcl) >20% for almost all likely members), and in turn >80% of galaxies with P(zcl) >30% are classified as likely
members, making the likely-member selection roughly sim-ilar to that used by e.g., Tran et al. (2010), Papovich et al. (2012). On the other hand, possible members have P(zcl)
as low as ∼ 1%, with an interquartile range of P(zcl) of
about 6-22%. The inclusion of possible members thus brings our selection closer to more conservative P(zcl)-based
cri-teria adopted by other studies as e.g., Tanaka et al. (2012), Raichoor & Andreon (2012). In fact, in this work galaxies with a P(zcl) larger than 10% are essentially always included
in the candidate sample (as either likely or possible members), unless they are spectroscopic interlopers. Overall, the selec-tion we use is thus quite conservative, which is reflected in the considerations about completeness and contamination dis-cussed below.
2.3.1. Completeness and contamination of the candidate member
sample
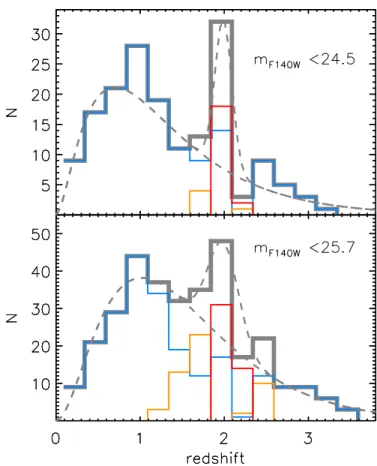
Figure 2 shows the redshift distribution in the considered area, down to m140 =24.5 and 25.7, highlighting the differ-ent contribution of interlopers vs. possible and likely can-didate cluster members. The presence of the cluster on the underlying field redshift distribution is clearly visible, even in this distribution largely based on photo-zs. By comparison with comoving number densities measured in wide fields (e.g. Muzzin et al. 2013) the comoving number density of massive
6That is, P(z
cl) =
R2+3×0.057 2−3×0.057 p(z)dz.
FIG. 2.— The redshift distribution in the cluster field. Gray lines show the distribution (of photometric redshifts, or spectroscopic where available) of all sources in the target area down to m140=24.5 and 25.7 (upper and lower panel, respectively). The contributions of galaxies identified as interlopers, ”possible” and “likely” cluster members, as described in the text, are shown as blue, orange and red lines, respectively. Dashed gray lines in both panels show a modeling of the redshift distribution in this field, with and without the cluster contribution (see text).
(> 1010M⊙) galaxies at 1.7 < z < 2.1 (the photo-z range most
affected by cluster members) in the area within 150 kpc from the cluster center, is about 30 times larger than in the general field (∆log(n/M pc3) = 1.49 ± 0.15 dex)7.
We note that, by comparison with the spectroscopic sample, our selection of candidate cluster members is highly complete (all the 19 spectroscopic cluster members in the area probed by WFC3 grism data would be classified as likely candidate members based on their photo–zs). On the other hand, as a tradeoff for completeness, the sample of candidate members is significantly contaminated by interlopers.
As a rough estimate of such contamination, we find that by comparison with the spectroscopic sample about half of the sample of “likely” cluster members would be interlop-ers. We note that this fraction increases significantly, possi-bly to ∼80%, for “possible” members, for the obvious rea-son that, by selection, this sample is made of objects with a photo-z more distant from the cluster redshift, and in most cases poorly constrained. For such (typically faint) sources, 7We verified that the comoving number density measured in our field in the 1 < z < 1.5 range, which is not affected by the cluster, is in excellent agreement with what measured by Muzzin et al. (2013). Also note that, even in the 1.7 < z < 2.1 range affected by the cluster, the comoving number density of massive galaxies beyond 200 kpc from the cluster center is only a factor ∼4 times the density in the general field (∆log(n/M pc3) = 0.58 ± 0.15 dex).
not only it is difficult to obtain a reliable redshift estimate, but also to estimate photo-z accuracy and contamination. On the other hand, as we show in the following, the vast major-ity of these uncertain candidates is made of low-mass star-forming galaxies that do not enter our mass-complete sam-ples, and have generally little weight in our conclusions. We finally note that spectroscopic interlopers classified as likely and possible members are generally close to the cluster red-shift (& 90% at 1.8 < z < 2.1 and 1.4 < z < 2.7, for likely and possible members, respectively).
As a further check of the relevance of contamination, we model the redshift distribution in Figure 2 with a f (z) =
C × βz2
Γ(3/β)z3 0
e−(z/z0)β (Brainerd et al. 1996) for the field plus a
Gaussian centered at z=2 for the cluster (dashed gray lines in the figure). The modeling is only done with the purpose of es-timating the cluster and field contributions in the 1.5 < z < 2.5 redshift range8, as relevant to membership determination.
For the m140 < 25.7 sample (lower panel of Figure 2), the σ of the Gaussian is fixed to the scatter estimated for the photo-zs, and from the modeling we estimate that, in the 1.5 < z < 2.5 range, about one third of this sample should be made of cluster galaxies. Therefore, statistically we should have in our catalog, in this redshift and magnitude ranges, about 40 cluster members: we have 14 spectroscopic mem-bers, and then 31 likely and 40 possible candidates. Assum-ing our estimated 50% contamination for likely members and 80% contamination for possible members, yields ∼ 24 mem-bers in very close agreement with the statistical estimate.
For the m140 < 24.5 sample, the photo-z scatter is smaller (∼ 5%), and furthermore many cluster members are spectro-scopically confirmed, resulting in a tighter Gaussian in the upper panel of Figure 2, thus for the bright sample we use 0.1 < σ < 0.15. For this sample, we estimate that about 50% (and at least 40%) of the galaxies should be cluster members, thus statistically ∼ 29 (and at least 23) cluster members in this magnitude and redshift range in our catalog. Since we have 13 spectroscopic members and 12 candidates, this could suggest that, for the bright sample, our membership determination is less affected by contamination (as could be expected). Over-all, this check confirms that our estimate of contamination for the whole sample is realistic, if anything somewhat too high for bright sources.
2.3.2. Final samples
In the end, we have a sample of 96 candidates, with 14 spec-troscopic members, 31 “likely” and 51 “possible” candidates9 down to m140= 25.7. Based on the considerations discussed above, we expect the whole sample of candidate members to include about 50 interlopers, for the most part (3/4) selected as possible members.
We stress that, because of the significant contamination of our candidate member sample by field galaxies at similar red-shift, in most of this paper we will not be able to investigate the detailed comparison of galaxy properties in cluster and field environment at z ∼ 2. On the other hand, in spite of the significant contamination or in some cases thanks to the 8We use β=0.72, z0=0.17 for m140 <24.5, and β=1, z0=0.51 for m140 < 25.7, but note that given the very small area we probe, and the contamination from the cluster itself, these data are not ideal for modeling f (z), and thus the parameters determined here should not be considered for general purposes.
9Four more sources classified as possible members are embedded in the halos of bright objects and were excluded, because of their unclear nature and severely corrupted photometry.
FIG. 3.— The restframe U-V vs V-J color-color plot. Larger/smaller sym-bols show galaxies brighter than the two limits used (m140 <24.5 and 25.7, respectively). The solid line shows the separation criterion between passive and star-forming galaxies at z ∼ 2 as adopted in Williams et al. (2009) – dot-ted lines are, as a reference, ±0.1 mag around this limit. Interlopers in the fore- and background are shown as light and dark gray symbols. Coloured symbols show cluster candidate members (“likely” and ”possible” as full and empty circles), red for passive and blue for star-forming sources according to the SED classification – see text for details.
extensive WFC3 spectroscopy, some properties of the cluster galaxy populations are clearly visible, even after dilution of their signal with field galaxies, as discussed below.
As discussed in section 2.2, for all analyses involving the characterisation of galaxy morphological structure, we limit our sample to objects brighter than m140 = 24.5. The sam-ple is thus reduced to ∼ 170 sources, out of which 13 and 12 galaxies are spectroscopic and candidates members, respec-tively.
The mass completeness limits corresponding to the mag-nitudes m140 =25.7 and 24.5, estimated for an SSP formed at zf = 5, with solar metallicity and no dust reddening, are ∼8.5 × 10⁹M⊙and 2.5 × 10¹⁰M⊙, respectively (Salpeter IMF).
2.4. Passive and star-forming galaxies
In order to broadly characterize the stellar population prop-erties of individual sources, we split the sample in two classes of galaxies which are either essentially passively evolving, or still actively forming stars. We initially assign galaxies to one class or the other based on their restframe U-V and V-J col-ors (e.g., Wuyts et al. 2007, hereafter UVJ classification), as calculated based on its redshift and the appropriate observed SED (as selected in Sec. 2.1.2; spectroscopic redshifts are used where available). We use here the division between pas-sive and active galaxies in the U-V vs V-J plane as adopted in Williams et al. (2009).
We then re-fit the observed SEDs of candidate members, at fixed redshift (photo-z or spectroscopic value), using com-binations of templates from two different libraries. The first library includes only BC03 passive templates (age/τ >4.5 and age ≥ 0.6 Gyr), with different metallicities, no dust attenua-tion, and a range of ages appropriate for the redshift range of the candidate members. This library is thus only appropriate for passive galaxies, in the relevant redshift range, with lit-tle dust attenuation. The second library includes only BC03 templates with constant SFH, attenuated by dust with E(B-V) up to 1.2, and with a range of ages appropriate for the
red-shift considered. This library may thus only describe actively star-forming (SF) populations with a broad range in dust at-tenuation, including highly reddened sources.
If we compare the χ2 of the best-fits for cluster members obtained with these two libraries and with the EAZY stan-dard templates, we generally find that more than half of the galaxies UVJ-classified as star-forming are best-fitted with the EAZY library (lowest χ2in 55% of cases), 40% are best-fitted by the constant SFH library, and only 4% have the lowest χ2 with the passive library. Instead, candidate members classi-fied as UVJ-passive are essentially never best-fitted by con-stant SFH templates (with the exception of a source close to the dividing line), and in 90% of cases have χ2
PAS S IV E.χ 2 EAZY
(we note that the best-fit EAZY SED can also be essentially passive, with the greatest contribution coming from templates of evolved populations)10. In the great majority of cases, this alternative classification based on the comparison of SED fit with different libraries agrees with the UVJ selection. In very few cases the two classifications do not agree (see Figure 3): these are close to the dividing line of the UVJ plot, where it is thus particularly useful to also have a different approach, and/or faint sources whose SED is poorly constrained due to large photometric errors. In these few cases we adopt the SED-based classification.
Our sample of candidate members is thus ultimately divided in 18 passive (6 secure members plus 4 likely and 8 possible candidates) and 78 actively star-forming galaxies (8 secure members plus 27 likely and 43 possible candidates).
3. GALAXIES ASSOCIATED WITH THE CL1449+0856 STRUCTURE As discussed above, our selection of candidate members should be highly complete but also significantly affected by contamination from interlopers. While it is impossible to re-move this contamination based on photometric redshifts, we can at least statistically investigate some properties of the cluster galaxy populations which are strong enough not to be diluted by the significant presence of interlopers.
3.1. Projected distribution of candidate members
We show in Figures 4 and 5 the projected distribution of candidate cluster members in the field. Note that both fig-ures show all candidate members – according to the specific selection as labeled in individual panels – and are thus af-fected by interloper contamination (as discussed in sections 2.3.1 and 2.3.2). While the more uncertain ”possible” mem-bers make up about half of the full m140<25.7 candidate sam-ple, their contribution is higher at low masses, and goes down to <30% and 25% for the logM/M⊙>9.9 and logM/M⊙>10.4
mass-complete samples highlighted in the figures. Account-ing for spectroscopic members and the estimated contamina-tion for “likely” and “possible” candidates, we estimate that these mass-complete samples are affected by an overall con-tamination of < 40% and ∼ 30%, for logM/M⊙ >9.9 and
logM/M⊙>10.4, respectively.
Figure 4 shows individually all galaxies in the field, high-lighting ”possible” and ”likely” candidate members, as well as the nature of their stellar populations as estimated from their SED (section 2.4).
10When a spectroscopic redshift is not available, as discussed above we fix the redshift to the photometric value, which is a sensible choice given that a photometric redshift is incomparably better constrained with the general template library. Nonetheless, we note that for most (70%) of the passive sources, constant SFH templates give a poorer fit even if redshift is left as a free parameter.
Figure 5 shows local density maps of the same sample of candidate cluster members (m140 < 25.7), as well as of the mass-complete sample (logM/M⊙ >9.9), to picture more
clearly their projected distribution, the density enhancement around the cluster center (taken as the center of the extended X-ray emission, as quoted in Gobat et al. 2011), and possi-ble surrounding structures. As an estimator of local (pro-jected) density, we used the density based on the distance to the 3rdnearest neighbour, Σ
3. We correct for edge effects by accounting for uncovered area within the distance to the 3rd nearest neighbour, however minor edge effects may still per-sist. Contours from the density map of the full flux-limited
m140 <25.7 sample of candidate members (top-left panel of Figure 5) are shown overlaid on the WFC3 F140W image in Figure 6. Figure 5 also shows local density maps of differ-ent sub-populations of the mass-complete sample, to highlight their different (projected) distribution.
Figures 4 and 5 clearly show the characteristic nature of the galaxies in the central concentration, including many massive, red, passive sources within 100-150 kpc of the cluster center. West of the cluster center, these figures show an overdensity of galaxies which seem distinct in nature, less massive, star-forming, and (whenever the measurement is possible) with a late-type structure (Figure 7). Half of these are spectroscopi-cally confirmed to be cluster members.
Another overdensity in the projected distribution of candi-date members is located south-east of the cluster center. How-ever, as Figure 4 shows, it is made in large part of candidates less likely to be at the cluster redshift, and it contains no spec-troscopically confirmed member. The reality of this structure could not be confirmed with the current spectroscopic cover-age, partly due to observational issues (being located at the edge of the field fully covered by WFC3 grism spectroscopy with all 4 orientations, and being made in large part of faint sources).
Considering the mass-complete sample (blue and purple squares in Figure 4), and in spite of dilution due to interloper contamination, a concentration of massive, of optically red (restframe U-V>1.311), and of passive galaxies in the clus-ter core is evident. This central concentration appears to in-clude mostly passive sources, but also some dust-reddened star-forming galaxies. These results seem to be largely sta-ble against the inclusion of interlopers. In fact, due to the se-lection criteria a large fraction of the less likely (”possible”) members is made of low-mass star-forming galaxies below the mass completeness limit (75%, vs 50% for “likely” mem-bers). More specifically, the concentration of massive, red, and passive galaxies in the cluster core does not depend on the inclusion of less-likely members.
3.2. Structural and stellar population properties
Passive systems, as well as more massive galaxies (logM/M⊙ >10.5), seem to be effectively segregated in the
central cluster region, with two thirds of these galaxies within <200 kpc from the cluster centre.
At least in the mass range probed by our morphological analysis (logM/M⊙ >10.4), this segregation is also evident
for high-Sersic systems (n > 2), which are all within a clus-tercentric distance of ∼150 kpc, as shown in Figures 5 and 7.
11The restframe U-V>1.3 threshold, as used here when referring to opti-cally red sources, is close to the observed Y-K color cut used in Gobat et al. (2011).
FIG. 4.— Left: The distribution of galaxies brighter than m140= 25.7 in the studied field. Interlopers are plotted as gray crosses, while passive and star-forming candidate members are highlighted in red and blue, respectively. Filled and empty circles show likely and possible candidates, and spectroscopically confirmed members are marked with a small green point in the center. Large and small circles show sources brighter than m140= 24.5 and m140= 25.7. Yellow squares mark candidate members with restframe U-V> 1.3, while blue and purple squares show the mass complete samples of members more massive than logM/M⊙=9.9
and 10.4, respectively. Solid gray circles show clustercentric radii of 250 and 500 kpc (proper) at the cluster redshift. North is up, East to the left. Right: A close-up of the left-hand panel in the cluster center. Symbols are the same, gray circles mark clustercentric radii of 100 and 200 kpc (proper) at the cluster redshift. Two AGNs spectroscopically confirmed to belong to the cluster (Gobat et al. 2013) are marked by green stars.
This extends to a z=2 cluster previous results showing that, already before z ∼ 1, the central regions of clusters and groups generally exhibit a segregation of more massive, older, or morphologically evolved galaxies (e.g., among oth-ers Rosati et al. 2009, Mei et al. 2012, Muzzin et al. 2012). In particular, the studies of Kurk et al. (2009), Tanaka et al. (2012 2010b), Papovich et al. (2010 2012) of two X-ray de-tected low-mass clusters at z ∼ 1.6, suggest that at least some overdense structures, even with relatively low masses and already at z > 1.5, host in their core galaxy popula-tions which are particularly evolved, in terms of their struc-ture, stellar populations, and assembled stellar mass, as com-pared to lower density regions at the same epoch, and pos-sibly in spite of the coexistence in the same volume of a population of galaxies which are instead still actively form-ing (e.g., Tran et al. 2010). Indeed, we recall results from several studies suggesting that, even at z & 2, some proto-cluster environments may already host galaxies more mas-sive, with older stars, and more evolved structure, than their surroundings (e.g., Steidel et al. 2005, Kodama et al. 2007, Tanaka et al. 2010a, Hatch et al. 2011, Zirm et al. 2012, Spitler et al. 2012).
With respect to the comparison of structural and stellar pop-ulation properties, we note the clear correlation in our sam-ple of candidate members (at least in the probed mass range) between a high-Sersic profile and evolved host stellar pop-ulations (Figure 7), consistent with previous observations at similar redshifts in both field and high-density environments (e.g., Cimatti et al. 2008, Kurk et al. 2009, Wuyts et al. 2011, Cameron et al. 2011, Bell et al. 2012, Papovich et al. 2012, Tanaka et al. 2012, Patel et al. 2012a). As discussed also in more detail below, 70+10−20%12of candidate members more mas-sive than the logM/M⊙ >10.4 threshold for morphological
analysis, and identified as passive, have nS ersic >2. A sim-12Here and in the following, errors on the fraction are calculated following Cameron (2011).
ilar early-type fraction is found in the passive population of our sample of interlopers at 1.5 < z < 2.5. Conversely, only 10+20
−4 % of star-forming candidate members more mas-sive than the same limit are classified as morphological early-types. For comparison, Papovich et al. (2012) finds that about 80% of candidate members in the cluster XMMLSS J02182-05102 at z ∼ 1.6 have nS ersic >2 (in a mass range similar to
ours).
In turn, ∼75+9−20% of the logM/M⊙ >10.4 candidate
mem-bers with an early-type morphology also appear to be pas-sive, with a similar fraction in our sample of interlopers at 1.5 < z < 3, although statistics are too poor to draw conclu-sions. For comparison, Bell et al. (2012) finds about 60% of early-type galaxies to be passive, at z ∼ 2, down to a stellar mass limit of 5.5 × 10¹⁰M⊙.
3.3. The environmental signature on galaxy populations
In Figure 8 we show the projected number density profile for the whole mass complete sample of candidate members more massive than 1010M⊙, as well as for passive galaxies in
this sample, and the related stellar mass profiles. For the pur-pose of this figure, the cluster center is taken at the center of the galaxy overdensity, roughly located on a complex multi-component galaxy system, with asymmetric halos and tails clearly suggestive of an ongoing merging, that in Gobat et al. (2011) was identified as the possible proto-BCG still in a very active formation phase. This is offset by ∼50 kpc (in projec-tion) from the estimated center of the X-ray emission. Note that this offset is similar to what observed in lower redshift clusters and groups, and is anyway comparable to the uncer-tainty on the X-ray centroid position (Fassbender et al. 2011a, George et al. 2012). All profiles shown take into account the contamination by interlopers by resampling multiple times the sample of candidate members, according to the contamination estimates discussed above. The errors shown on the number density profiles are the largest between the Poisson error on the counts and the scatter due to the resampling. For
stel-FIG. 5.— Top panels: The projected density of candidate members around the center of the extended X-ray emission. A smoothed map of Σ3for the whole flux-limited sample of candidate cluster members down to m140= 25.7 (left panel, same sample as in Figure 4), and for the mass complete samples of candidate members with logM/M⊙>9.9 and 10.4, respectively (middle and right panel). Middle and lower panels: the two rightmost panels show the Σ3maps for high
and low Sersic index candidate members, for the logM/M⊙>10.4 sample shown in the top right panel. All other panels, which do not rely on morphological
analysis, show Σ3maps for different sub-populations of the full mass complete (logM/M⊙>9.9) sample shown in the top middle panel. These sub-populations
are selected in stellar mass, restframe U-V color, or star formation classification (thus essentially specific star formation rate), as indicated at the bottom of each map. In all panels, the dashed circle shows the footprint of the catalog we used, while the two solid gray circles show clustercentric distances of 250 and 500 kpc at the cluster redshift, from the center of the extended X-ray emission. North is up, East to the left. Note that these maps refer to the full sample of candidate members, with no correction for contamination by interlopers.
FIG. 6.— The WFC3 F140W image of the studied area. Contours corre-spond to the density map of the full flux-limited sample of candidate members shown in Figure 5 (top-left panel), with colors corresponding to projected number density levels in the same color scale. The dashed circle shows the footprint of the catalog we used, as in Figure 5. In the bottom panel, a close-up of the inner cluster region (white square in close-upper panel) is shown. White circles show radii of 100 and 200 kpc (proper) at the cluster redshift. lar mass profiles, an error of a factor two on stellar mass is included. At these masses the impact of less-likely (“possi-ble”) members is marginal, and we verify that the inclusion or exclusion of these galaxies does not affect the profiles. The light gray crosses in Figure 8 show, as a simplistic illustration, the density profile obtained by deprojecting the observed pro-file (black points) assuming spherical symmetry, with a sim-ple approach similar to McLaughlin (1999), and assuming no significant contribution to the overdensity beyond 650 kpc. Based on this estimate, the average volume number density of massive galaxies (> 1010M⊙) within the region probed by
this profile (650kpc from the cluster center) would be about 250 ± 100 times the density in the field at z ∼ 2 (from wide field measurements, e.g. Muzzin et al. 2013, , see also sec-tion 2.3.1), reaching central densities 4-5 orders of magnitude larger than in the field within 100 kpc from the cluster center. We stress that this is only a simplistic approximation for illus-tration purposes, and of course we have no proof - and likely no expectations - that this cluster is spherically simmetric.
The purpose of Figure 8 is to quantitatively show the in-creased galaxy density of candidate members in the
clus-ter central region. A proper investigation of the shape
of the galaxy number density profile is beyond the scope of this work, but we show as a reference the
best-fitting projected β-model13 (Σ(r) = σ
0(1 + (rr
core)
2)−β,
Cavaliere & Fusco-Femiano 1978, with σ0 the central pro-jected density, rcore the core radius, and β the outer slope)
to the number density profile (black points) as a black line. The profile suggests that, if there is a core, it is very small
FIG. 7.— The projected distribution (top panel, as in Figure 4) and the UVJ restframe color-color plot (bottom panel) of the sample of candidate members brighter than the limit for morphological analysis m140<24.5. This sample is flux-limited, not mass complete: sources below the estimated mass complete-ness of logM/M⊙=10.4 are highlighted with gray squares. Solid/empty
sym-bols show likely/possible members, respectively. Galaxies classified as pas-sive or star-forming are colored in red and blue, while galaxies with a nS ersic
higher or below 2 are shown as ellipses and spirals, respectively. Galaxies for which no acceptable fit could be obtained are plotted as triangles: visual inspection shows that only one could be an early-type, a passive source very close to the cluster center.
13A generalization of core profiles which is often used to describe cluster galaxy number density profiles (e.g., Girardi et al. 1998, Lemze et al. 2009).
(core radius 20+30−10kpc), as also observed in low-redshift clus-ters (e.g., Biviano & Girardi 2003). The best-fit β ∼ 0.9 is close to typical values observed in the nearby Universe (e.g., Popesso et al. 2004). Given the small offset between the X-ray centroid and the center of the overdensity, we note that this figure would be essentially the same if considering the X-ray centroid as the cluster center, the only relevant effect being the increase of the core size to ∼ 50 kpc.
The upper panel of Figure 8 shows the fraction of candidate members which are classified as passive in two radial bins (within and beyond a clustercentric distance of 150 kpc), for three mass-limited samples (logM/M⊙>10, 10.5, and 11). In
spite of the relatively poor statistics and of the contamination by field galaxies, this Figure clearly shows that a larger frac-tion of galaxies has already suppressed star formafrac-tion in the cluster center, corresponding to the high-density region shown by the profile in the bottom panel. The effect is seen in all the mass-limited samples shown, with the possible exception of the most massive systems (>1011M⊙). Statistics are too poor
to draw any conclusion, but the lack of a clear environmental effect for the most massive galaxies would hint at a predom-inant role of mass-related factors (so-called “mass quench-ing”, e.g., Baldry et al. 2006, Peng et al. 2010b), rather than local density, in quenching galaxies at the highest masses, at this epoch and for this kind of environment (but see e.g., Muzzin et al. 2012, for clusters at z ∼ 1). In the outer bin (between 150 and ∼ 700 kpc) the passive fraction is consis-tent with the field value (estimated from these same data using galaxies classified as interlopers at 1.5 < z < 2.5 and keeping into account the resampling of candidate members). However, we remind the reader that where the overdensity of cluster galaxies drops, dilution from contamination dramatically af-fects the possibility to recover the properties of cluster galax-ies, which thus appear similar to those of the field sample. Statistically correcting for the contamination by interlopers, as it is done here, is expected to give lower passive fractions (if field galaxies have a higher star-forming fraction), espe-cially in the outer regions were field contamination is more significant. Finally, we note that the passive fraction that we measure in the field is consistent with previous determina-tions at redshift two, for instance we find a passive fraction
of 50 ± 15% at masses logM/M⊙ = 11.15 ± 0.35, close –
given the uncertainties – to the estimates of e.g., Daddi et al. (2005a), Brammer et al. (2011), Patel et al. (2012b).
Compared to z ∼ 1 clusters, we find as expected higher star-forming fractions, but we recall the caveat just dis-cussed above which might bias high our estimates. For in-stance, in the range 10.25.logM/M⊙ . 10.95, Muzzin et al.
(2012) finds about 20% of cluster galaxies with still active star formation within 200 kpc from the cluster core, while
we estimate about 50%. However, at high stellar masses
(logM/M⊙ >10.95) 70+10−20% of galaxies within 200 kpc
ap-pear to be already passive, a result which is not likely to be produced by field contamination, and is already similar to the low (∼ 20%) star-forming fractions estimated by Muzzin et al. in their z ∼ 1 sample.
3.4. The high-mass tail
At z < 1.5, very massive galaxies are a characteris-tic population of cluster cores, which generally exhibits the most evolved morphological structures and stellar popula-tions. However, studies of z > 1.5 clusters often show signifi-cant activity (from both the star formation and mass assembly points of view) even at the high-mass tail of cluster galaxy
FIG. 8.— Bottom: Number density profile of cluster galaxies as estimated from the sample of candidate members (see text for details). Black and red symbols show the whole population more massive than 1010M
⊙, and
the sub-sample of galaxies classified as passive, respectively (black and red symbols are slightly offset for clarity). Error bars include the Poisson error and the uncertainties in membership determination (see text). The light gray crosses show a simplistic deprojection of the observed density profile assum-ing spherical symmetry (see text; units are galaxies/Mpc3 read on the left-hand y-axis). The gray-shaded and red-hatched areas show the inferred stellar mass density profiles (right-hand scale) for the same two samples (> 1010M
⊙,
whole population and passive sources, respectively). Top: The fraction of passive galaxies in two radial bins of clustercentric radius (r < 150 kpc and 150 < r < 700 kpc, solid symbols) as estimated from the sample of candidate cluster members (see text for details). The passive fraction as measured from these same data in the field (galaxies classified as interlopers at 1.5 < z < 2.5) is shown with empty symbols. Black, dark-gray and light-gray symbols show mass-complete samples with logM/M⊙>10,10.5, 11, respectively.
populations, as discussed in the introduction.
Based on the results of SED fitting, in our sample there are nine candidate members with stellar masses exceeding 1011M
⊙, six of which are spectroscopic members. These
ob-jects are mostly concentrated close to the cluster center, with 5 of them within a clustercentric distance dcl.100 kpc. Only
two are classified as actively star-forming based on our crite-ria: one candidate at dcl>600 kpc, and one component of the
proto-BCG system that from recent analysis seems indeed to be associated with the cluster (Gobat et al. 2013). According to our criteria, its SED is classified as star-forming. While the photometry of this source is likely significantly affected by the presence of multiple components and neighbors, a de-tection in the Herschel PACS imaging indeed suggests a SFR of order ∼100M⊙/yr (Gobat et al. 2013). All the other seven
>1011M⊙candidate members are classified as passive, four of
them with an early-type morphology, although one is embed-ded in a large asymmetric halo with features suggestive of a recent interaction. The remaining three galaxies classified as passive are i) a likely member of disky morphology, ii) a pos-sible member with distorted shape showing a large tail, and
iii) a galaxy very close (∼1.5”) to the star-forming component
of the proto-BCG mentioned above, identified in Gobat et al. (2011) as a proto-BCG component itself, and for which we were not able to obtain a reliable Sersic fit, likely due to its
complicated surroundings. The F140W images of these three galaxies are shown in Figure 9.
In spite of the mentioned caveats, these observations would thus picture the high-mass end galaxy population in this clus-ter as a mix of passive galaxies with already established early-type morphologies, and of galaxies which are instead still ac-tively forming their stars, assembling their mass, or reshaping their structure, in some cases clearly through interactions. We note that, with the exception of the proto-BCG complex, the central region within <150 kpc from the cluster center hosts the most evolved of these very massive galaxies, while those star-forming or with disk or irregular morphologies typically lie outside of the cluster core, at dcl>350 kpc.
As already mentioned in section 3, the most massive galax-ies in the core of this cluster already show a very high passive fraction (83+6
−20% for the fully spectroscopically confirmed sample of M>1011M
⊙ members within 150 kpc from the
cluster center), close to the estimate by Raichoor & Andreon (2012) for very massive galaxies close to the central area of JKCS 041, assumed to be at roughly similar redshift.
As also found in other studies at this redshift, the frac-tion of very massive galaxies which have already attained an early-type morphology is significantly lower than at lower redshift. Both in our cluster and 1.5 < z < 2.5 field samples, 40±15% of galaxies more massive than 1011M
⊙are classified
as morphological early-types (or 20+20
−6 % for & 2 × 10 11M
⊙,
in agreement with Buitrago et al. 2011). On the other hand, the fraction of early-types could be larger for > 1011M⊙
pas-sive galaxies (60±15%, larger than the 35±15% estimated by
van der Wel et al. (2011), but still consistent given the signif-icant errors).
FIG. 9.— WFC3 F140W cutouts of the three massive candidate members classified as passive (from both criteria described in section 2.4), that do not have an early-type morphology (left and middle panel) or for which a reliable fit could not be obtained (right panel). Cutout size is 3”, or ∼26 kpc at z=2.
3.5. An estimate of the cluster mass from its host galaxies
As reported in Gobat et al. (2011), the total mass of Cl J1449+0856 as inferred from its X-ray luminosity would be M200 = 5.3 ± 1 1013Msun. Gobat et al. (2011) also
at-tempted an independent estimate of the cluster mass based on the stellar mass contained in the red galaxies in the very central (20”, ∼170 kpc) overdensity. We attempt here a re-finement of this estimate based on the sample of candidate members within a clustercentric radius of 500 kpc. We stress that this only gives a very rough indication of the cluster mass, since besides the biases related to the selection of candidate members, which are extensively discussed above, there are many additional important uncertainties including our igno-rance of the cluster virial radius, and of the redshift evolution up to z ∼ 2 of the relation between cluster total mass and stellar mass in galaxies.
Given the cluster redshift as well as the previous mass es-timates, it is reasonable to assume that the cluster virial
ra-dius is likely not much larger than ∼ 500 kpc, and thus that a
r < 500 kpc area accounts for most of the mass in galaxies in
this system (as would be also suggested by Figure 8). We es-timate the stellar mass in galaxies within this area14, keeping into account contamination by interlopers as discussed above, and extrapolating down to stellar masses of 107M
⊙assuming
that the shape of the mass function is similar to what mea-sured at 1.5 < z < 2 by Ilbert et al. (2010). The stellar mass calculated in this way is 2±1×10¹²M
⊙. Based on this, we then
estimate the cluster mass using its relation (in the nearby Uni-verse) with stellar mass in galaxies as determined by Andreon (2012). Since as discussed above we do not know the r500or
r20015 of this cluster, we apply both local calibrations based on stellar mass within r500and r200, in the reasonable assump-tion that the 500 kpc radius we use must be between or close to one of them. The two estimates, 4 − 5 × 10¹³M
⊙, are
consistent given the uncertainty of at least 50%. This would correspond to a stellar mass fraction within the r < 500 kpc area of ∼4-5%, also in agreement with other measurements up to z ∼ 1 (Giodini et al. 2009, Leauthaud et al. 2012, for the same IMF). On the other hand, while there is currently no evidence for a significant evolution of the stellar mass frac-tion in clusters up tp z ∼ 1, there might well be a stronger evolution between z ∼ 1 and 2. The actual amount of such evolution is difficult to quantify, and we note just for refer-ence that the Bower et al. (2006) semi-analytic model would predict a slightly lower stellar mass fraction for group/cluster-sized haloes at z = 2 (Balogh et al. 2008), which would thus mildly increase, by ∼30%, our estimate for the cluster mass.
In any case, our revised estimate of the cluster mass based on stellar mass in galaxies is close to previous determinations. We stress nonetheless once more that, given the significant assumptions and uncertainties involved, this remains only a crude guess.
4. PASSIVE EARLY-TYPE GALAXIES
According to the criteria described above, down to the com-pleteness mass limit of 8.5 × 10⁹M⊙ we identify 8 passive
“likely” members and 4 passive “possible” members. As dis-cussed above and shown in Figure 4, these candidate mem-bers – and in particular those most likely associated with the cluster – tend to be located in the cluster core, at a cluster-centric radius of <150 kpc. As expected, the fraction of can-didate members classified as passive strongly depends on stel-lar mass. At masses below logM/M⊙<10.5 passive galaxies
seem very rare: we have only two in our mass-complete sam-ple, making up 15+15
−5 % of the 9.9 <logM/M⊙ < 10.5 popu-lation of cluster candidates. Statistics are poor, and the ex-act number could be affected by contamination and photo-z uncertainties, but there seems to be a paucity of passive candidate members at low stellar masses in our sample (see also e.g., among others, Kodama et al. 2004, De Lucia et al. 2007, Ilbert et al. 2010, Rudnick et al. 2012, at lower to sim-ilar redshifts, and in different environments). The passive fraction increases at higher masses, getting to 30+20
−10% at 10.5 <logM/M⊙<11, and up to the ∼80% for logM/M⊙>11
as quoted in section 3.4.
Down to our limit for morphological analysis (m140<24.5, M> 2.5 × 10¹⁰M⊙), our passive sample contains 8 “likely”
14We correct for a small fraction of uncovered area beyond 300 kpc, see e.g., Figure 5.
15As for the usual definition, r500and r200are the radii within which the mean density of the cluster is 500 and 200 times, respectively, the critical density of the Universe at the cluster redshift.