Bundled Mobility Passes:
A Framework for Partnership Between Public Transit and New Mobility Services By
Apaar Bansal
B.S. Civil and Environmental Engineering University of California, Berkeley (2014)
Submitted to the Department of Urban Studies and Planning and the Department of Civil and Environmental Engineering in partial fulfillment of the requirements for the degrees of
Master in City Planning and
Master of Science in Transportation at the
MASSACHUSETTS INSTITUTE OF TECHNOLOGY June 2019
© 2019 Massachusetts Institute of Technology
Author ... Department of Urban Studies and Planning Department of Civil and Environmental Engineering May 23, 2019
Certified by ... Jinhua Zhao Edward H. and Joyce Linde Associate Professor of Transportation and City Planning Thesis Supervisor
Accepted by ... Professor of the Practice, Caesar McDowell Co-Chair, MCP Committee Department of Urban Studies and Planning
Accepted by ... Heidi Nepf Donald and Martha Harleman Professor of Civil and Environmental Engineering Chair, Graduate Program Committee
Bundled Mobility Passes:
A Framework for Partnership Between Public Transit and New Mobility Services
by Apaar Bansal
Submitted to the Department of Urban Studies and Planning
on May 23rd, 2019 in partial fulfillment of the requirements for the degrees of Master in City Planning
and
Master of Science in Transportation
Abstract
The emergence and proliferation of “new” mobility has the potential to fundamentally disrupt urban mobility in the 21st century. This includes bikesharing, carsharing, or on-demand vehicles that can be summoned from a smartphone through transportation network companies (TNCs) and microtransit. Competition provided by these services to public transit has often soured the relationship between public authorities and new mobility. However, in the absence of a blanket ban on these services, the public sector needs to find a way to coexist with newer mobility forms, while still upholding system-wide benefits and values of public transportation. One way to coexist is through publicly-guided regulation, but going further than this is to find mutually-beneficial forms of partnership. This thesis proposes bundled mobility passes between public transit, bikesharing, and TNCs, as a potential framework in which the popularity of new mobility can be tapped to strengthen public transit revenue and ridership while at the same time enabling public institutions to regulate these services more effectively. By bringing together stakeholders, the Superpass hopes to cement public transit’s place in urban mobility by making the transit pass more appealing. In particular, Chicago is used as a case study for this concept. Enclosed within are the results of an engagement process with employers and employees in the Chicago area, to whom surveys were administered to gauge preferences towards a hypothetical bundled “Superpass” offered by the Chicago Transit Authority (CTA). The surveys found widespread support among employers for such a pass. A discrete choice model was also made from the employee survey results to simulate the choices of employees under different pass scenarios. A scenario analysis found that from this Superpass, the CTA, bikeshare operator, and TNC operator can all at least increase either the number of passes they sell or the number of rides they provide to the market. The CTA, in particular, can potentially increase its pass holders by 6% to 35% and its revenue by 1% to 8% with a 30-day pass add-on bundle, and with a Metra Link-up add-on bundle it can increase pass holders by 11% to 36% and remain about revenue neutral. This thesis also presents an implementation framework for such a pass that could bring together the urban public transit system, the regional commuter rail, the bikeshare operator, the TNC operator, employers, and finally, employees, to ensure the success of this program.
Thesis Supervisor: Jinhua Zhao
Acknowledgements
This thesis marks the culmination of three challenging but rewarding years at MIT, and I am indebted to many who have helped and supported me along the way.
First, I would like to thank my advisors, Jinhua Zhao and John Attanucci. To Jinhua, for always giving me hope in hopeless situations and for spreading your infectious enthusiasm. To John, for giving me the chance these last three years to be an RA, for always giving your honest feedback, and for your time during our countless meetings to help move this research forward. Both of you have left an indelible mark on me in your own ways which I will carry as I leave MIT and I will be eternally grateful for having been given the opportunity to work on this exciting project. And to Fred Salvucci, it has been an honor to be in your presence and hear your wisdom over these years.
Next, I am grateful to the Chicago Transit Authority for supporting me the last three years and for having an open mind to hear my ideas. I particularly thank Laura DeCastro, Tom McKone, and President Dorval Carter for their support and positivity during the course of this project.
I also thank all the members of the Transit Lab for their friendship and help, especially, Ru, Mihir, Maud, Gabe, Jintai, Peyman and Nate. I also owe an enormous amount of gratitude to He and Mazen for all their help with this thesis. To Adham, Haleemah, Ayush, Priya, and Akash, your unwavering friendship has kept me sane these years in Cambridge. To Diego, you have been more supportive than I could ever repay. I also thank the rest of my MCP cohort for their passion and laughter, it has been a privilege to share the halls of DUSP with you.
I wish to express my unending gratitude to my parents, who have been a source of comfort, support, and affection from across the world. It has been difficult to be away from home for so long, but I hope I am making you proud. To Neal, it was actually your original suggestion that led me to pursue this path and so in a way you had a big role to play in the creation of this thesis. Thank you for always pushing me towards the right path, I am much better off because of it. To Swati, Chinka, Amit, Shashank, and the little ones, I look forward to when our family is next together again. And finally, to my home city of Delhi, which inspired me to pursue this field of study and has kept me motivated to reach this far.
Table of Contents
CHAPTER 1 INTRODUCTION ... 14
1.1 MOTIVATION ... 14
1.2 BACKGROUND ON CHICAGO MOBILITY ... 15
1.3 RESEARCH APPROACH... 17
1.4 OVERVIEW OF THE THESIS... 18
CHAPTER 2 THE CASE FOR PARTNERSHIPS WITH NEW MOBILITY ... 21
2.1 ROLE OF THE STATE IN TRANSPORTATION ... 21
2.2 BACKGROUND ON NEW MOBILITY ... 23
2.2.1 BIKESHARING ... 24
2.2.2 RIDESHARING /TRANSPORTATION NETWORK COMPANIES (TNCS) ... 25
2.2.3 MICROTRANSIT ... 26
2.2.4 CARSHARING ... 27
2.3 PUBLIC SECTOR RESPONSE TO NEW MOBILITY ... 27
2.3.1 REGULATIONS ... 27
2.3.2 PARTNERSHIPS... 28
2.3.3 BANS ... 31
2.3.4 CHICAGO’S RESPONSE ... 31
2.3.5 OBSERVATIONS ... 32
2.4 THE CASE FOR PARTNERSHIPS ... 32
CHAPTER 3 THE CASE FOR BUNDLED MOBILITY PASSES ... 35
3.1 LITERATURE ON PRODUCT BUNDLING ... 35
3.2 TRANSIT PASSES AND THE CTA ... 37
3.2.1 INTRODUCTION TO THE TRANSIT PASS... 37
3.2.2 FARE POLICY AT THE CTA ... 38
3.3 MOBILITY AS A SERVICE (MAAS) ... 41
3.3.1 OVERVIEW... 41
3.3.2 LITERATURE ON PREFERENCES AND IMPACTS ... 43
3.3.3 SALIENT EXAMPLES ... 44
3.3.4 OBSERVATIONS ... 47
3.4 APPLICATION AND RATIONALE FOR CHICAGO ... 48
3.4.1 CHICAGO MOBILITY MARKET ... 48
3.4.2 RATIONALE FOR PUBLIC SECTOR INVOLVEMENT ... 49
CHAPTER 4 THE CASE FOR WORKING WITH EMPLOYERS ... 53
4.1 WHY EMPLOYERS?... 53
4.3 EMPLOYER ENGAGEMENT IN CHICAGO... 56
4.4 EMPLOYER SURVEY AND RESULTS ... 57
4.4.1 RATIONALE AND OVERVIEW ... 57
4.4.2 RESULTS ... 58
4.4.3 IDENTIFYING COMPANIES OF INTEREST ... 66
4.5 REVENUE MODEL ... 67
4.5.1 EMPLOYEE TRAVEL PROFILE ... 68
4.5.2 BUNDLES TO TEST ON EACH COMMUTER GROUP ... 68
4.5.3 ESTIMATING SUPERPASS PURCHASES BY EACH COMMUTER GROUP ... 69
4.5.4 RESULTS ... 74
4.6 SUMMARY AND FINDINGS ... 76
CHAPTER 5 BUNDLED MOBILITY PASS CHOICE MODEL ... 78
5.1 EMPLOYEE SURVEY OVERVIEW ... 78
5.1.1 SURVEY FLOW ... 79
5.1.2 OVERVIEW OF SURVEY QUESTIONS ... 80
5.1.3 STATED PREFERENCE DESIGN ... 83
5.2 GENERAL RESULTS ... 86
5.2.1 DISTRIBUTION OF RESPONDENTS AND RESPONDENT COMPANIES ... 86
5.2.2 CHARACTERISTICS OF SAMPLE POPULATION AND WEIGHTING ... 88
5.2.3 TRAVEL BEHAVIOR AND SPENDING OF SAMPLE POPULATION ... 90
5.2.4 RECEPTION TOWARDS SUPERPASS IDEA ... 93
5.2.5 FREQUENCY OF PASS CHOICE BY INDIVIDUAL CHARACTERISTICS ... 96
5.2.6 FREQUENCY OF PASS CHOICE BY PASS CHARACTERISTICS... 97
5.2.7 SELECTED RESPONDENT COMMENTS ... 99
5.3 MODELING METHODOLOGY ... 101
5.3.1 USE OF DISCRETE CHOICE ANALYSIS ... 101
5.3.2 MODEL STRUCTURE ... 101
5.3.3 UTILITY EQUATIONS SPECIFICATION ... 104
5.4 MODEL RESULTS ... 110
5.4.1 PARAMETER ESTIMATES ... 111
5.4.2 INTERPRETATION OF PASS COEFFICIENTS ... 113
5.4.3 INTERPRETATION OF CURRENT TRAVEL BEHAVIOR COEFFICIENTS ... 116
5.4.4 INTERPRETATION OF RESIDENCE LOCATION COEFFICIENTS ... 117
5.4.5 INTERPRETATION OF SOCIOECONOMIC AND SOCIODEMOGRAPHIC COEFFICIENTS ... 118
5.4.6 MODEL PERFORMANCE ... 118
CHAPTER 6 APPLYING CHOICE MODEL TO STAKEHOLDERS ... 122
6.1 STAKEHOLDER ANALYSIS ... 122 6.1.1 CTA ... 123 6.1.2 TNCOPERATOR ... 123 6.1.3 DIVVY ... 124 6.1.4 METRA ... 125 6.1.5 EMPLOYER ... 126
6.1.6 EMPLOYEE ... 126
6.1.7 THE CITY ... 127
6.1.8 OTHER STAKEHOLDERS ... 127
6.2 MODEL APPLICATION METHODOLOGY ... 129
6.2.1 FORECASTING METHODOLOGY ... 129
6.2.2 TNCINDUSTRY VS.TNCOPERATOR ... 130
6.2.3 CALCULATING REVENUE IMPACTS ... 131
6.2.4 CALCULATING SALES IMPACTS ... 132
6.2.5 APPLYING THE METRA SUPERPASS ... 133
6.2.6 METRICS ... 133
6.2.7 KEY ASSUMPTIONS ... 133
6.3 NON-METRA SUPERPASS SCENARIOS ... 134
6.3.1 TNCINDUSTRY IMPACTS ... 134
6.3.2 TNCOPERATOR IMPACTS ... 137
6.3.3 CTAIMPACTS ... 139
6.3.4 DIVVY IMPACTS ... 142
6.3.5 COMPARING STAKEHOLDER IMPACTS ... 144
6.4 METRA SUPERPASS SCENARIOS ... 148
6.4.1 TNCINDUSTRY IMPACTS ... 148
6.4.2 TNCOPERATOR IMPACTS ... 150
6.4.3 CTAIMPACTS ... 153
6.4.4 DIVVY IMPACTS ... 155
6.4.5 COMPARING STAKEHOLDER IMPACTS ... 157
6.5 SELECTING THE “OPTIMAL”BUNDLE ... 161
6.5.1 NON-METRA SUPERPASS ILLUSTRATIVE EXAMPLE ... 164
6.5.2 METRA SUPERPASS ILLUSTRATIVE EXAMPLE ... 166
CHAPTER 7 CONCLUSION ... 168 7.1 SUMMARY OF FINDINGS ... 168 7.1.1 CHAPTER 2 ... 168 7.1.2 CHAPTER 3 ... 168 7.1.3 CHAPTER 4 ... 169 7.1.4 CHAPTER 5 ... 169 7.1.5 CHAPTER 6 ... 169 7.2 RECOMMENDATIONS ... 171
7.3 LOOKING TOWARDS IMPLEMENTATION ... 171
7.3.1 PILOT PHASE ... 172
7.3.2 REGULATIONS FOR OPERATORS ... 172
7.3.3 CHOOSING THE TNCOPERATOR ... 173
7.3.4 CHOOSING OTHER MOBILITY SERVICES TO ADD ... 173
7.3.5 OTHER FEATURES TO INCLUDE ... 173
7.3.6 CHOOSING WHO IS OFFERED SUPERPASS ... 173
7.3.7 CHOOSING WHO IMPLEMENTS... 174
7.4 FUTURE RESEARCH ... 175
LIST OF FIGURES
FIGURE 1-1: SYSTEM MAP OF CTA, PACE, AND METRA NETWORK ... 16
FIGURE 1-2: THE VENTRA APP ... 17
FIGURE 2-1: CYCLE OF PUBLIC AND PRIVATE INVOLVEMENT IN TRANSIT BUS SERVICES (ADAPTED FROM GOMEZ-IBANEZ AND MEYER, 1993) ... 23
FIGURE 2-2: OVERVIEW OF THE NEW AND SHARED MOBILITY ECOSYSTEM (SHAHEEN ET AL., 2017) ... 24
FIGURE 2-3: PARTNERSHIPS BETWEEN US CITIES AND TNCS (SCHWIETERMAN AND LIVINGSTON, 2018) ... 31
FIGURE 3-1: CTA RIDERSHIP BY TARIFF 2009-2017 (STUNTZ, 2018) ... 40
FIGURE 3-2: SCHEMATIC SHOWING DIFFERENT POTENTIAL USES OF A MAAS PLATFORM ... 42
FIGURE 3-3: OVERVIEW OF DIFFERENT LEVELS OF INTEGRATION IN MAAS ... 43
FIGURE 3-4: WHIM’S SUBSCRIPTION PLANS IN HELSINKI AS OF APRIL 2019 ... 45
FIGURE 3-5: WHIM SUBSCRIPTION PLANS IN NOVEMBER 2016 ... 46
FIGURE 3-6: AN ADVERTISEMENT FOR THE CITYMAPPER PASS ... 46
FIGURE 3-7: EXAMPLES OF SUBSCRIPTIONS AND BUNDLES TRIED BY TNCS IN THE UNITED STATES ... 47
FIGURE 4-1: NUMBER OF EMPLOYEES AT RESPONDENT COMPANY LARGEST LOCATION (N=131) ... 58
FIGURE 4-2: PERCENT OF EMPLOYEES RESERVING PRE-TAX INCOME FOR COMMUTING ... 59
FIGURE 4-3: REPORTED TRANSIT MODE SHARE VS. PERCENT OF EMPLOYEES RESERVING PRE-TAX INCOME FOR COMMUTING ... 60
FIGURE 4-4: REPORTED TRANSIT MODE SHARE VS. PERCENT OF EMPLOYEES WHO LOAD MONEY INTO VENTRA WHO USE THE 30-DAY CTA PASS ... 61
FIGURE 4-5: HOW RESPONDENT ORGANIZATION HANDLES PARKING FOR EMPLOYEES ... 62
FIGURE 4-6: RESPONDENT COMPANY INTEREST IN BUNDLED PASS ... 63
FIGURE 4-7: RANKED INTEREST IN DIFFERENT MODES IN MOBILITY BUNDLE ... 64
FIGURE 4-8: RESPONDENT COMPANY INTEREST IN BUNDLED PASS BY COMPANY SIZE ... 65
FIGURE 4-9: RESPONDENT COMPANY INTEREST IN BUNDLED PASS BY WHETHER COMPANY PROVIDES PARKING SPACES OR SUBSIDY .... 65
FIGURE 4-10: CUMULATIVE USE VALUE DISTRIBUTION VS. DIFFERENCE FROM PASS VALUE FOR CTA RIDER POPULATION ... 70
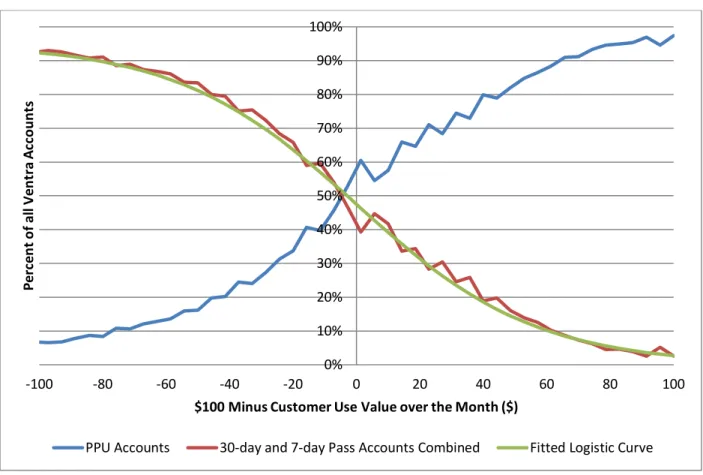
FIGURE 4-11: DISTRIBUTION OF CTA PASS AND PPU ACCOUNTS BY DIFFERENCE IN USE VALUE FROM PASS PRICE (OCT 2016 CTA VENTRA DATA)... 72
FIGURE 5-1: SURVEY FLOW OF EMPLOYEE SUPERPASS SURVEY ... 79
FIGURE 5-2: ZOOMED IN DISTRIBUTION OF EMPLOYEE SURVEY RESPONDENT HOME LOCATION (LEFT IN BLUE) AND THEIR WORKPLACE (RIGHT IN RED) ... 86
FIGURE 5-3: ZOOMED OUT MAPS OF SURVEY RESPONDENTS (LEFT) AND THEIR WORKPLACES (RIGHT) ... 87
FIGURE 5-4: FREQUENCY OF USE OF TRAVEL MODES USED BY RESPONDENT IN LAST 3 MONTHS ... 91
FIGURE 5-5: MONEY SPENT ON CTA PER MONTH BY CTA USERS ... 92
FIGURE 5-6: MONEY SPENT ON TNCS PER MONTH BY TNC USERS ... 93
FIGURE 5-7: REASONS FOR LACK OF INTEREST IN SUPERPASS ... 94
FIGURE 5-8: OTHER MODES RESPONDENT WOULD LIKE TO SEE IN SUPERPASS ... 94
FIGURE 5-9: WOULD THE RESPONDENT BE MORE LIKELY TO PURCHASE A MONTHLY TRANSIT PASS PRODUCT IF SUPERPASS OFFERED .. 95
FIGURE 5-10: NUMBER OF TIMES IN STATED PREFERENCE BRANCH RESPONDENTS SELECTED A SUPERPASS ... 95
FIGURE 5-11: INTEREST IN SUPERPASS BY PRIMARY COMMUTE MODE ... 96
FIGURE 5-12: INTEREST IN SUPERPASS BY CTA FARE PRODUCT ... 97
FIGURE 5-13: DIAGRAMMATIC REPRESENTATION OF MODEL STRUCTURE ... 102
FIGURE 5-14: RESIDUAL ERROR OF TEST DATA... 121
FIGURE 6-1: ESTIMATION TO FORECASTING METHODOLOGY ... 129
FIGURE 6-2: PERCENT CHANGE IN TNC INDUSTRY REVENUE UNDER DIFFERENT NON-METRA SUPERPASS SCENARIOS (NO DIVVY) ... 135
FIGURE 6-3: PERCENT CHANGE IN TNC INDUSTRY REVENUE UNDER DIFFERENT NON-METRA SUPERPASS SCENARIOS (DIVVY INCLUDED) ... 135
FIGURE 6-4: PERCENT CHANGE IN TNC INDUSTRY RIDE GROWTH UNDER DIFFERENT NON-METRA SUPERPASS SCENARIOS (NO DIVVY) ... 136
FIGURE 6-5: PERCENT CHANGE IN TNC INDUSTRY RIDE GROWTH UNDER DIFFERENT NON-METRA SUPERPASS SCENARIOS (DIVVY INCLUDED) ... 136
FIGURE 6-7: PERCENT CHANGE IN TNC OPERATOR REVENUE UNDER DIFFERENT NON-METRA SUPERPASS SCENARIOS (DIVVY INCLUDED)
... 138
FIGURE 6-8: PERCENT CHANGE IN TNC OPERATOR RIDES IN NON-METRA SUPERPASS SCENARIOS (NO DIVVY) ... 138
FIGURE 6-9: PERCENT CHANGE IN TNC OPERATOR RIDES IN NON-METRA SUPERPASS SCENARIOS (DIVVY INCLUDED) ... 139
FIGURE 6-10: PERCENT CHANGE IN CTA 30-DAY PASS HOLDERS UNDER DIFFERENT NON-METRA SUPERPASS SCENARIOS (NO DIVVY) ... 140
FIGURE 6-11: PERCENT CHANGE IN CTA 30-DAY PASS HOLDERS UNDER DIFFERENT NON-METRA SUPERPASS SCENARIOS (DIVVY INCLUDED) ... 140
FIGURE 6-12: PERCENT CHANGE IN CTA REVENUE UNDER DIFFERENT NON-METRA SUPERPASS SCENARIOS (NO DIVVY) ... 141
FIGURE 6-13: PERCENT CHANGE IN CTA REVENUE UNDER DIFFERENT NON-METRA SUPERPASS SCENARIOS (DIVVY INCLUDED) ... 141
FIGURE 6-14: PERCENT CHANGE IN DIVVY REVENUE IN NON-METRA SUPERPASS SCENARIOS ... 142
FIGURE 6-15: PERCENT CHANGE IN DIVVY PASS HOLDERS IN NON-METRA SUPERPASS SCENARIOS ... 143
FIGURE 6-16: PERCENT CHANGE IN CTA + DIVVY REVENUE IN NON-METRA SUPERPASS SCENARIOS... 144
FIGURE 6-17: CHANGE IN TNC OPERATOR REVENUE VERSUS CHANGE IN CTA REVENUE IN NON-METRA SUPERPASS SCENARIOS ... 146
FIGURE 6-18: CHANGE IN TNC OPERATOR RIDES VERSUS CHANGE IN 30-DAY PASS HOLDERS IN NON-METRA SUPERPASS SCENARIOS ... 147
FIGURE 6-19: CHANGE IN TNC INDUSTRY REVENUE VERSUS CHANGE IN CTA REVENUE IN NON-METRA SUPERPASS SCENARIOS ... 147
FIGURE 6-20: CHANGE IN TNC INDUSTRY RIDES VERSUS CHANGE IN 30-DAY PASS HOLDERS IN NON-METRA SUPERPASS SCENARIOS 148 FIGURE 6-21: PERCENT CHANGE IN TNC INDUSTRY REVENUE UNDER DIFFERENT METRA SUPERPASS SCENARIOS (NO DIVVY) ... 149
FIGURE 6-22: PERCENT CHANGE IN TNC INDUSTRY REVENUE UNDER DIFFERENT METRA SUPERPASS SCENARIOS (DIVVY INCLUDED) .. 149
FIGURE 6-23: PERCENT CHANGE IN TNC INDUSTRY RIDE GROWTH UNDER DIFFERENT METRA SUPERPASS SCENARIOS (NO DIVVY) ... 150
FIGURE 6-24: PERCENT CHANGE IN TNC INDUSTRY RIDE GROWTH UNDER DIFFERENT METRA SUPERPASS SCENARIOS (DIVVY INCLUDED) ... 150
FIGURE 6-25: PERCENT CHANGE IN TNC OPERATOR REVENUE IN METRA SUPERPASS SCENARIOS (NO DIVVY) ... 151
FIGURE 6-26: PERCENT CHANGE IN TNC OPERATOR REVENUE IN METRA SUPERPASS SCENARIOS (DIVVY INCLUDED) ... 151
FIGURE 6-27: PERCENT CHANGE IN TNC OPERATOR RIDES IN METRA SUPERPASS SCENARIOS (NO DIVVY) ... 152
FIGURE 6-28: PERCENT CHANGE IN TNC OPERATOR RIDES IN METRA SUPERPASS SCENARIOS (DIVVY INCLUDED) ... 152
FIGURE 6-29: PERCENT CHANGE IN CTA METRA LINK-UP OR 30-DAY PASS HOLDERS UNDER DIFFERENT METRA SUPERPASS SCENARIOS (NO DIVVY) ... 153
FIGURE 6-30: PERCENT CHANGE IN CTA METRA LINK-UP OR 30-DAY PASS HOLDERS UNDER DIFFERENT METRA SUPERPASS SCENARIOS (DIVVY INCLUDED) ... 153
FIGURE 6-31: PERCENT CHANGE IN CTA REVENUE FROM METRA MONTHLY PASSHOLDERS UNDER DIFFERENT METRA SUPERPASS SCENARIOS (NO DIVVY) ... 154
FIGURE 6-32: PERCENT CHANGE IN CTA REVENUE FROM METRA MONTHLY PASSHOLDERS UNDER DIFFERENT METRA SUPERPASS SCENARIOS (DIVVY INCLUDED) ... 154
FIGURE 6-33: PERCENT CHANGE IN DIVVY REVENUE IN METRA SUPERPASS SCENARIOS ... 155
FIGURE 6-34: PERCENT CHANGE IN DIVVY PASS HOLDERS IN METRA SUPERPASS SCENARIOS ... 156
FIGURE 6-35: PERCENT CHANGE IN CTA + DIVVY REVENUE IN METRA SUPERPASS SCENARIOS ... 156
FIGURE 6-36: CHANGE IN TNC OPERATOR REVENUE VERSUS CHANGE IN CTA REVENUE IN METRA SUPERPASS SCENARIOS ... 159
FIGURE 6-37: CHANGE IN TNC OPERATOR RIDES VERSUS CHANGE IN 30-DAY PASS HOLDERS IN METRA SUPERPASS SCENARIOS ... 159
FIGURE 6-38: CHANGE IN TNC INDUSTRY REVENUE VERSUS CHANGE IN CTA REVENUE IN METRA SUPERPASS SCENARIOS ... 160
L
IST OF
T
ABLES
TABLE 1-1: MOBILITY OPERATORS IN CHICAGO ... 17
TABLE 1-2: OVERVIEW OF THESIS ... 18
TABLE 2-1: STUDIES OF RIDESOURCING MODAL SHIFT IMPACTS ... 26
TABLE 2-2: OVERVIEW OF PARTNERSHIPS BETWEEN US PUBLIC SECTOR AND NEW MOBILITY (CURTIS ET AL., 2019; SCHWIETERMAN AND LIVINGSTON, 2018) ... 29
TABLE 3-1: OVERVIEW OF 30-DAY/MONTHLY TRANSIT PASS VERSUS SINGLE-RIDE COSTS AROUND THE WORLD ... 38
TABLE 3-2: CTA FARES ... 38
TABLE 3-3: CTA BASE FARE VERSUS 30-DAY PASS PRICE OVER THE YEARS ... 39
TABLE 3-4: CTA BASE FARE VERSUS 7-DAY PASS PRICE OVER THE YEARS ... 40
TABLE 3-5: RANGE OF MOBILITY SERVICES IN CHICAGO ... 48
TABLE 4-1: OVERVIEW OF TDM MEASURES USED BY EMPLOYERS ... 56
TABLE 4-2: RUSH UNIVERSITY MEDICAL CENTER MODE SPLIT ... 68
TABLE 4-3: METHODS USED TO CALCULATE SWITCHING TO SUPERPASS FOR DIFFERENT COMMUTER GROUPS ... 69
TABLE 4-4: ASSUMED DRIVING CROSS-PRICE ELASTICITY WITH PASS PRICE BY METRA FARE ZONE RESIDENCE (CTA + METRA BUNDLE) 73 TABLE 4-5: CROSS PRICE ELASTICITY OF DRIVING WITH RESPECT TO PASS PRICE BY NUMBER OF TNC RIDES TAKEN PER MONTH (CTA + TNC BUNDLE) ... 73
TABLE 4-6: DRIVING CROSS PRICE ELASTICITY WITH RESPECT TO PASS PRICE BY METRA FARE ZONE RESIDENCE (CTA + METRA + TNC BUNDLE) ... 74
TABLE 4-7: REVENUE AND PASS SALE IMPLICATIONS OF DIFFERENT BUNDLE CONFIGURATIONS ... 74
TABLE 4-8: BENEFITS OF STATED PREFERENCE SURVEY AS COMPARED TO ASSUMPTION-BASED REVENUE MODEL ... 77
TABLE 5-1: OVERVIEW OF EMPLOYEE SUPERPASS SURVEY... 80
TABLE 5-2: ATTRIBUTES AND LEVELS USED TO CREATE STATED PREFERENCE QUESTIONS ... 84
TABLE 5-3: TOP 10 RESPONDENT COMPANIES TO EMPLOYEE SURVEY... 88
TABLE 5-4: SELECTED DESCRIPTIVE STATISTICS OF SURVEY RESPONDENTS (UNWEIGHTED) ... 88
TABLE 5-5: DIFFERENCE IN SP SUPERPASS SELECTION RATE WITH AND WITHOUT DIVVY INCLUDED ... 97
TABLE 5-6: DIFFERENCE IN SP SUPERPASS SELECTION RATE WITH DIFFERENT TNC RIDE VALUATIONS ... 98
TABLE 5-7: DESCRIPTION OF UTILITY EQUATIONS ... 103
TABLE 5-8: DESCRIPTION OF VARIABLES USED IN MODEL ... 108
TABLE 5-9: ESTIMATED PARAMETERS FROM CHOICE MODEL ... 111
TABLE 5-10: 95% CONFIDENCE INTERVAL OF PASS COEFFICIENTS... 112
TABLE 5-11: MARGINAL EFFECTS OF SUPERPASS VARIABLES ... 115
TABLE 5-12: TEST DATA STATISTICS ... 119
TABLE 5-13: MODEL PERFORMANCE FOR NON-METRA PASS CHOICE ... 119
TABLE 5-14: MODEL PERFORMANCE FOR METRA PASS CHOICE ... 120
TABLE 5-15: MODEL PERFORMANCE FOR SUPERPASS BRANCH CHOICE ... 120
TABLE 6-1: OPTIMAL NON-METRA PASS CONFIGURATIONS FOR TNC INDUSTRY, TNC OPERATOR, CTA, AND DIVVY FROM REVENUE AND MARKET GROWTH PERSPECTIVE ... 144
TABLE 6-2: NON-METRA SUPERPASS SCENARIOS ASSUMED TO BE ACCEPTABLE TO TNC OPERATOR ... 145
TABLE 6-3: OPTIMAL METRA PASS CONFIGURATIONS FOR TNC INDUSTRY, TNC OPERATOR, CTA, AND DIVVY AS MEASURED BY DIFFERENT METRICS ... 157
TABLE 6-4: METRA SUPERPASS SCENARIOS ASSUMED TO BE ACCEPTABLE TO TNC OPERATOR ... 157
TABLE 6-5: OPTIMAL SCENARIOS FOR DIFFERENT STAKEHOLDER OBJECTIVES ... 161
TABLE 6-6: PROJECTED IMPACTS OF CTA 30-DAY PASS + DIVVY + 5 LYFT RIDES FOR $145 ... 165
TABLE 6-7: PROJECTED IMPACTS OF CTA 30-DAY PASS + 5 LYFT RIDES FOR $135 ... 166
Chapter 1 Introduction
1.1 MotivationThe emergence of new mobility has the potential to fundamentally change urban mobility. With the advent of smartphone and improved GPS technology, one can book rides in a stranger’s car on-demand with a few taps on a phone, which would have been unthinkable just 10 years ago. This has no doubt led to changes in travel behavior and had system wide impacts. While it has definitely made urban mobility more convenient, it has also been proven to increase congestion in major cities. City governments and transit agencies, responsible for managing urban mobility, were taken by surprise with the initial popularity of transportation network companies (TNCs). Unprepared to regulate these new services, many cities and countries reacted negatively to the initial emergence of TNCs. Lawsuits went back and forth. The taxi industry was decimated. Eventually, TNCs won the right to operate in most cities and the public sector must now adapt its approach for this new reality.
Transportation policymakers across the US and the world are playing catch up to what has transpired while at the same time planning for the future of mobility. The question of how the public sector should deal with new mobility evokes visceral opinions from almost anyone familiar with the topic. On one hand, new mobility is making urban mobility more convenient for some, but on the other hand the policymakers must react to system-wide impacts and equity concerns. This thesis has emerged as a response to a call from a transit agency that is searching, like many major transit agencies in the world, for a way to engage with new mobility that takes advantage of their appeal and convenience while remaining true to the core values of urban mobility that the agency must uphold. The Chicago Transit Authority (CTA) has seen a fall in bus ridership recently; one likely reason is the concurrent rise of new mobility services. This has led to a sometimes difficult relationship between TNCs and the public sector in Chicago. This thesis is an attempt to find a mutually beneficial way for collaboration between the two parties.
At the same time that US cities have been dealing with the rise of recent innovations in the transport sector, European cities have been experimenting with Mobility as a Service (MaaS). This concept refers to the bundling of access to public transit and other mobility services for a subscription fee.
Initial impacts of this concept have been promising but limited to small pilots. This thesis is an exploration of the application of MaaS to the Chicago context to investigate whether it can pave the way for more effective interaction between the public sector and new mobility.
1.2 Background on Chicago Mobility
With a city population of about 2.7 million, Chicago is the third largest city in the United States and has the second most extensive public transit system. Surface transportation in Chicago is managed by the Chicago Department of Transportation (CDOT), while mass transit in the region falls under the umbrella of the Regional Transit Authority (RTA). The RTA, in turn, funds three transit agencies: the Chicago Transit Authority (CTA), Pace, and Metra. The CTA handles an average of 1.5 million weekday trips on its 8 rail lines and around 130 bus routes, mostly all within the City of Chicago. Pace operates more suburban bus routes and also provides paratransit and dial-a-ride services. Metra operates the commuter rail system, connecting Chicago with its surrounding suburbs. Figure 1-1 shows a system map of the CTA, Pace, and Metra network.
Figure 1-1: System Map of CTA, Pace, and Metra Network
The CTA fare payment system is called Ventra, which was launched in 2013. Soon thereafter, the Ventra mobile app was rolled out, which allows CTA users to load money into their Ventra accounts, track real-time arrival information on trains and buses, and purchase Metra tickets. In 2017, the Federal government provided a grant to integrate Divvy bikeshare with the Ventra app and its electronic payment system. Figure 1-2 shows a screenshot of the Ventra app.
Figure 1-2: The Ventra App
There are an array of transportation services in Chicago. These are briefly outlined in Table 1-1. A more detailed picture of the different mobility services in Chicago and their cost is presented in Chapter 3, along with more information particularly on the CTA fare structure and fare product use distribution.
Table 1-1: Mobility Operators in Chicago
Mobility Service Operators
Rail Transit CTA, Metra
Bus Transit CTA, Pace
Water Transport Chicago Water Taxi
Rideshare / Ridehail / TNC Uber, Lyft, Via
Taxi E-Hail Curb, Arro
Bikeshare Divvy
Carshare Zipcar, Getaround, Maven, Turo
1.3 Research approach
This thesis is based on three years of interaction with CTA officials and study of Chicago employer and employee preferences. It uses the following methods to arrive at its conclusions and findings.
• Survey of employers: A series of 122 transit benefits managers of different employers in
Chicago were surveyed to get basic information on the benefits they provide, whether or not they would be interested in a bundled mobility pass, and which modes of transport they would like to see in those passes.
• Stated preference survey of employees: Then, a more extensive and in-depth survey was
administered to employees across Chicago, most of who worked for companies that the CTA had an existing relationship with. This survey asked travel behavior and spending questions along with stated-preference conjoint questions to get relative preferences for different bundled pass configurations.
• Discrete choice analysis of employee survey results: The responses to the conjoint
questions were used to model preference for bundled mobility passes using discrete choice analysis.
• Stakeholder analysis: Important stakeholders related to the Superpass were identified and
their various objectives, constraints, and decision tasks were outlined.
• Scenario testing: The results of the choice model were used to simulate revenues and
market shares under different Superpass scenarios. These different outcomes were then matched with the stakeholder analysis to lay out a framework for how to go about selecting configurations that might be acceptable to a broad range of stakeholders.
1.4 Overview of the thesis
Chapter 2 reviews current examples of partnership between the public sector and new mobility and argues in favor of a pro-partnership mindset by the public sector. Chapter 3 presents a background on Mobility as a Service (MaaS) and argues for its implementation in Chicago through a public entity. Chapter 4 examines the case for launching an integrated mobility pass through employers. Chapter 5 presents the results of a stated preference survey of employees in Chicago and the development of a new “monthly bundled mobility pass” choice model based on the survey results, and Chapter 6 applies this model to different stakeholders. Finally, Chapter 7 concludes the thesis with a summary of key findings and a roadmap for future implementation and research. Table 1-2 summarizes the objectives of each section of this thesis.
Table 1-2: Overview of Thesis
Chapter Section of Thesis Objective
The Case for Partnerships with
New Mobility
Role of State in Transportation
To set the motivations of the public sector as it decides on course of action to take with regards to changes in mobility landscape.
Background on New Mobility
To establish domain knowledge on what is meant by “new mobility” what their impacts are.
Public Sector Response to
New Mobility To inspire other transit agencies to get ideas on partnerships to pursue. The Case for Partnerships To argue in favor of partnerships between the public sector and new
The Case for Bundled Mobility
Passes
Literature on Product
Bundling To understand the economic rationale for bundling.
Transit Passes and the CTA To give an introduction to CTA fare policy with respect to its pass fare products.
Mobility as a Service
(MaaS) To provide an overview of the MaaS concept and global examples. Application and Rationale
for Chicago
To explain why MaaS might make sense in Chicago and why the public sector should lead it.
The Case for Working with Employers
Why Employers? To explain the rationale for targeting employers with the Superpass. Literature on
Employer-based TDM Programs
To provide examples of employer-based programs that can lead to favorable TDM results.
Employer Engagement in Chicago
To give an overview of the current relationship between the CTA and employers in Chicago.
Employer Survey and Results
To report the results of the employer survey and show the interest level in a bundled mobility pass.
Revenue Model
To show how assumptions can be used on basic employee information to predict the revenue, passes sold, and impacts on different commuter groups as a result of offering the Superpass.
Summary and Findings To summarize the revenue model key findings and emphasize the importance of an employee survey.
Bundled Mobility Pass Choice
Model
Employee Survey Overview To describe the instrument used to collect the data that will go into the model
General Results To give an overview of the descriptive statistics and some basic cross-tabs of the survey responses
Modeling Methodology To describe how the model was structured and implemented Model Results
To know the factors that impact preference for pass choice from pass composition to personal traits and behavior.
Applying Choice Model to Stakeholders
Stakeholder Analysis
To get an understanding of the broad range of objectives, constraints, and decisions needed of all stakeholders involved so that a comprehensive Superpass can be designed. Model Application
Non-Metra Superpass Scenarios
To understand the varying impacts on different stakeholders under different Non-Metra Superpass configurations. Metra Superpass Scenarios To understand the varying impacts on different stakeholders under different
Metra Superpass configurations. Selecting the “Optimal”
Bundle
To describe the process of balancing stakeholder interests to identify mutually acceptable Superpass configurations.
Conclusion
Key Findings To summarize the salient points from each chapter in this thesis. Recommendations To use what has been learned from this thesis to create actionable
recommendations for any policymaker. Looking Towards
Implementation
To give an outline of important considerations to keep in mind when implementing the Superpass.
Chapter 2 The Case for Partnerships with New
Mobility
This chapter presents an overview of the new mobility landscape that has emerged and continues to change, and situates this change in the context of the fundamental role of public transportation. Specifically, this chapter:
• Describes the role of the public sector in ensuring mobility as a right; • Outlines what is meant by “new mobility” and cites its known impacts;
• Presents an overview of regulations, partnerships and bans across the US in response to new mobility;
• Discusses why it is necessary for public agencies to think about partnerships if it can help them better serve the people.
2.1 Role of the State in Transportation
One role ascribed to the State is to provide basic services to people who do not have means of purchasing these services on their own. What constitutes “basic services”, however, is debatable depending on where on the political spectrum you lie. Food, education, healthcare, housing, and increasingly even income are often the themes of such discussions because society has recognized them as basic human rights, but mobility is often left out. The concept of mobility as a right is not a universally held view. If it were true, then the government would be obligated to provide transportation to each and every person without the means of their own mobility, and it is clear this is often not the case in the United States. The reasons for why mobility should be considered a basic right ensured by the public are numerous and worthy of several volumes of dissertations. At a basic level, however, physical mobility allows a citizen to reach opportunities that can help them achieve their potential. It allows them to seek and attend employment opportunities, recreational activities, search for food and other basic needs, and overall enables them to contribute to nation-building. Once mobility as a right is accepted, and that it is the State’s duty to uphold this right, the discussion can move to how to ensure this right.
To ensure mobility for all people, the State can either enable mobility, regulate existing non-state mobility, or provide hybrid public-private mobility. The State enables mobility through the construction of roads, highways, and related ancillary services (e.g., gas pipelines, electricity, streetlights, etc.), and can directly provide a mobility service through public transit. The State regulates existing mobility to offset externalities through fees and rules and to keep it open to all through legislation (e.g., the Americans with Disabilities Act, Title VI of the Civil Rights Act, etc.). And finally, the State can use the help of the private sector for financing public infrastructure or for contracting out service that presumably leads to efficiency and service quality gains.
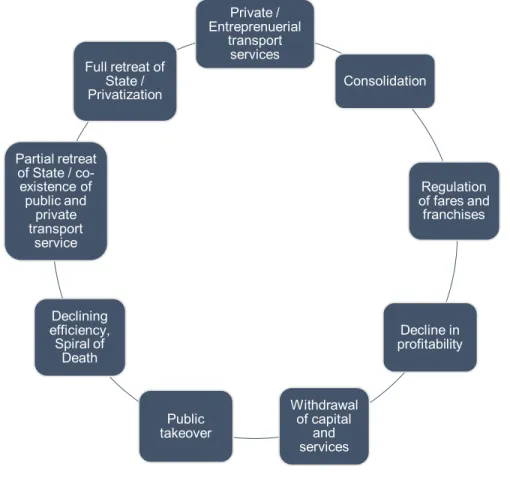
This thesis is concerned primarily with the third method (public-private partnership) but it also cannot ignore the importance of regulation. While often these are discussed separately, Figure 2-1 shows how the two activities are part of the same cycle of public and private involvement in public transit services (Gomez-Ibanez and Meyer, 1993). Though the cycle shown is in the context of public transit operations, it can be applied to all mobility services that provide fare-based services. Today’s transportation situation in urban America, and in particular Chicago, could arguably be in two parts of this cycle. On one hand, it could be at the “Consolidation” phase. There are many new start-ups in the mobility space as described in the next section, and many are starting to acquire others to build national and global conglomerates. Regulation is starting to catch up, including in Chicago where TNC fees are imposed, which might indicate a move to the “regulation of fares and franchises” phase. However, another way to interpret this figure is to say that we are somewhere between the declining efficiency / “Spiral of Death” and co-existence of public and private transport phase. Some argue that the rise of new mobility is jump starting the “Spiral of Death”, in which new services steal transit riders, which leads to declining ridership, revenue, and service cuts, which further lead to declining ridership and revenue. This makes it understandable why many public transit agencies are wary of taking anything other than an adversarial approach to new mobility as they enter the co-existence phase. Even more worrisome are those that suggest that TNCs and microtransit spell the end of public transit as we know it, hurtling us to the “full retreat of the State” phase. To prevent this from happening, with the assumption that the State should be involved with mobility to ensure it is provided for all, this thesis will go on to argue that smart partnerships could be used to remain in the co-existence phase and even help the public sector better fulfill its role in the mobility system as opposed to a progression onward to State retreat.
Figure 2-1: Cycle of Public and Private Involvement in Transit Bus Services (Adapted from Gomez-Ibanez and Meyer, 1993)
2.2 Background on New Mobility
Before delving into the complexity of partnerships between public transit and new mobility, a background understanding is needed on what exactly is meant by “new mobility.” Indeed, the term is often used in a broad sense without a clear definition. For example, many of the services it refers to are not really new at all, though it usually refers to a modern, tech-enabled rendition of the mobility service. Often, the term is really just a euphemism for transportation network companies (TNCs), which will be defined in this section. New mobility has also coincided with the sharing economy as it relates to the mobility industry. This is outlined in Figure 2-2. Overall, this section attempts to clear some of these definitions to set the scope of possibility when discussing bundled mobility products. Private / Entreprenuerial transport services Consolidation Regulation of fares and franchises Decline in profitability Withdrawal of capital and services Public takeover Declining efficiency, Spiral of Death Partial retreat of State / co-existence of public and private transport service Full retreat of State / Privatization
Figure 2-2: Overview of the New and Shared Mobility Ecosystem (Shaheen et al., 2017)
2.2.1 Bikesharing
Bikesharing is the short term access to a bicycle. Bikeshare systems are usually publicly-owned but can be operated by a private company. They usually comprise of docks throughout a service area from which users can check out and return bikes within stipulated time periods in return for a time-based fee or a membership. Bikesharing first emerged as early as the 1960s in the Netherlands, but has rapidly increased in popularity across Europe and North America in the past 10 to 12 years (DeMaio, 2003). Use of bikeshare has been shown to replace some walk and short transit trips (Martin and Shaheen, 2014). Recently, bikeshare has evolved towards “dockless” technology, where bikes can be left in any public space for the next rider to use. Dockless or “free-floating” systems have also begun to include electric-assist scooters. However, the unregulated proliferation of these services has led to some negative outcomes such as haphazard crowding of public spaces (ITDP, 2018).
Overall, bikesharing systems have shown promise of creating more multimodal lifestyles and making urban mobility more dynamic and active. There have been attempts at promoting the use of bikeshare for first- and last-mile connections to public transit through the placement of bikeshare stations at transit stations. They have also been included in many mobility bundles and partnerships outlined in Chapter 3. Given that bikeshare systems are often publicly owned, or at least operate with approval for use of public space, they lend themselves well to partnerships with public transit.
Sharing of a Vehicle
Carsharing
Roundtrip One-Way Personal Vehicle Sharing
P2P Carsharing Hybrid P2P-Traditional Carsharing P2P Marketplace Fractional Ownership
Scooter Sharing Bikesharing
Public Bikesharing Closed Campus Bikesharing P2P Bikesharing Sharing of a Passenger Ride Ridesharing Carpooling Vanpooling On-Demand Ride Services Ridesourcing/TNCs Ridesplitting E-Hail Microtransit
Fixed Routes and Fixed Scheduling
Flexible Routes and Flexible Scheduling Sharing of a Delivery Ride Courier Network Services P2P Delivery Services Paired On-Demand
Passenger Ride & Courier Services
2.2.2 Ridesharing / Transportation Network Companies (TNCs)
Ridesharing is perhaps the most disruptive and controversial out of what can be called “new mobility”, and is central to this thesis. It is the on-demand hiring of a vehicle with a driver to conduct a trip. The vehicle is usually booked using a smartphone app and the price or a range for the price is shown for the given origin and destination before booking. The price is usually dynamic, based on demand and supply at a particular place and time. Users can usually select a regular ride, a premium ride, a larger vehicle, or a shared ride, and they are connected to a nearby driver who is seeking to provide rides for money. Ridesharing is perhaps a misnomer, because the name would suggest that the ride is shared with someone else going in the same direction. However, this is often not the case, and so other terms have been used to describe this service such as “ridesourcing”, “transportation network company” (TNC), “transportation network provider” (TNP), “ridehailing”, and “app-based ride/transportation service”, to name a few. “Ridesharing” traditionally has referred to carpooling or “slugging”—the sharing of rides in order to access high-occupancy vehicle or high-high-occupancy toll lanes. For the purposes of this thesis, however, these new on-demand services will be referred to as TNCs or ridesharing, to keep in line with general nomenclature used in the public domain.
The two biggest ridesharing players in the United States at present are Lyft and Uber. Lyft began as Zimride in 2007, which at the time was just a driver-passenger matching platform for long distance carpool trips. Lyft as it is known now was born in 2013 in San Francisco. Meanwhile, Uber began as UberCab in 2010 in San Francisco targeted towards higher-end users who wanted to summon black limo car ride with a smartphone app. As the same time, a third major competitor called SideCar emerged in mid-2012 but exited the market in 2015. Both Lyft and Uber launched the “shared” versions of their services with Lyft Line and UberPool in 2014. Recently, Uber has launched “Express Pool”, where riders are picked up and dropped off near their origin and destination so as to improve operational efficiency, somewhat similar to the concept of a “virtual” bus stop. Services similar to Uber and Lyft have since sprouted throughout the world (Shaheen, 2018a).
The taxi industry has been the hardest hit by TNCs out of all industries. They have responded by using what are called “e-hail” services to facilitate booking taxi rides using a smartphone app. These services include Arro, Bandwagon, Curb, Flywheel, Gett, Hailo, and iTaxi. However, due to the fact that taxi rates are still heavily regulated and much higher than TNC fares, they have continued to decline in popularity.
While surely making personal rides more convenient for users, TNCs in general has been shown to have concerning impacts on urban mobility. They have been shown to increase congestion and replace public transit trips. A 2017 report found that even after accounting for the replacement of taxicab trips, TNCs caused an increase of 600 million vehicle miles in New York City over a three year period (Schaller, 2017). It found that city-wide, TNCs, yellow cabs, and black cars increased their mileage by up to 19% in the period between 2013 and 2016. Overall, in 2015 and 2016, the growth in for-hire ride trips was greater than the growth in transit in New York City. Further, in San Francisco, a 2017 report found that TNCs account for 570,000 daily vehicle miles traveled (VMT) and contribute about 6.5% of the average citywide weekday VMT (SFCTA, 2017). Finally,
Table 2-1 shows that TNCs have had a switching effect away from public transit in several studies done on modes replaced by TNC use.
Table 2-1: Studies of Ridesourcing Modal Shift Impacts
Study Authors Location Survey Year Rayle et al. San Francisco, CA 2014 Henao Denver and Boulder, CO 2016
Clewlow and Mishra 7 U.S. Cities Two Phases (2014-2016) Drive 7% 37% 39% Public Transit 30% 22% 15% Taxi 36% 10% 1% Bike or Walk 9% 12% 23%
Would not have
made trip 8% 12% 22%
Other / Other
ridesourcing 10% 7% –
Despite the above downsides to TNCs, there is no doubt that they have added to convenience of urban travel and that they are not going away soon. Both major US TNCs announced IPOs, with Lyft going public on March 18, 2019 and Uber on May 10. In the absence of an outright ban, public authorities and transit must find ways to effectively deal with TNCs and the mobility disruption they have unleashed. While many cities share an antagonistic relationship with TNCs, others have gone as far as to partner with them to solve mobility challenges. This thesis seeks to present a potential solution to at least lay a framework for a working relationship.
2.2.3 Microtransit
Another emergent new mobility phenomenon is microtransit, which shares similarities with TNCs. According to the US Department of Transportation (USDOT), it refers to privately-owned and on-demand vans and buses that operate on fixed or flexible routes and dynamic scheduling that carry people with similar origins and destinations. Often, they mirror routes already served by public buses but their appeal comes from being more technology-enabled, seat pre-booking, and having superior amenities. Microtransit has had mixed success in the United States. The first operators were Chariot and Bridj, which both started in 2014 but Bridj shut down in 2017. Chariot has since been acquired by Ford and is now called Ford Smart Mobility and operates 15-seater vehicles in 7 cities. Via, which started operations in 2013, is often cited as a successful example of microtransit because it is still in operation today. However, it toes the line between being a TNC and being considered microtransit, as its drivers are independent contractors who can decide to drive whenever they wish, there are no “routes”—riders are dynamically matched with each other in real time, and the vehicles used are generally SUVs and vans but not buses. However, riders do not receive door-to-door service and get picked up and dropped off at “virtual” bus stops. There have been few evaluation studies on the impacts of microtransit on user travel behavior. One study on a Bridj pilot project in Kansas City found that one-third of users had replaced a personal vehicle trip with their Bridj trip, one-third had replaced a public bus trip, and 22% percent had replaced a TNC trip (Shaheen, 2018b).
2.2.4 Carsharing
Carsharing can be defined as short-term access to an automobile. Usually a user must pay a membership fee to gain access to a fleet of vehicles, in addition to per mile or per hour costs. The earliest example of carsharing dates back to 1948 in Switzerland, and some of the earliest North American examples occurred in 1983 in San Francisco and Purdue University (Shaheen and Cohen, 2013). As of October 2016, there were about 15 million carshare members sharing about 160,000 vehicles in 46 countries, out of which 1.8 million members were in North America (Shaheen et al., 2018). Carsharing is traditionally associated with round-trip reservations, where the member must return the vehicle to the location from which he or she picked it up. Recent trends indicate the market is moving towards one-way carsharing, in which the member can drop the vehicle off at a location other than the one he or she rented it from. The proliferation of smartphones and social media profiles has also enabled peer-to-peer sharing of vehicles between individuals, where the carsharing company acts as a platform to facilitate the vehicle sharing economy (Shaheen and Cohen, 2013). Carsharing has been found to reduce the need for vehicle ownership by enabling easier access to a shared vehicle fleet. Round-trip carsharing has been found to reduce household average vehicle holdings from 0.47 to 0.24 (Martin et al., 2010). While previously carless households that obtain carsharing membership increase their vehicle-miles traveled (VMT) and greenhouse gas (GHG) emissions, this is outweighed by reductions due to car owners selling a vehicle or delaying a new purchase (Martin and Shaheen, 2011). Recognizing potential positive impacts of carsharing, cities across the world have welcomed carsharing organizations through parking allowances and other policies. Carsharing has been included as part of many mobility bundles and partnerships, as is shown in Chapter 3. The proven positive impacts of carsharing with respect to sustainable travel behavior would make them a potential candidate for partnerships with public transit.
2.3 Public Sector Response to New Mobility
Responses by the public sector to new mobility services have been varied, to say the least. They have ranged from large amounts of public subsidy for their operation to complete bans.
2.3.1 Regulations
New mobility, and in particular for-hire vehicles such as TNCs or microtransit, have been subjected to various regulations. These range from local to federal, and some regulations were made after the public sector was forced to react to the new player in the transportation scene. For US Federal regulation, the primary two are the existing laws pertaining to Title VI of the Civil Rights Act and the Americans with Disabilities Act. While Title VI only applies to projects that take federal money, ADA compliance is still required, though not for all vehicles as long as some vehicles are wheelchair-accessible (Feignon et al., 2018).
State and local regulation, on the other hand, usually covers the following aspects for private transportation services open to the public (Feignon et al., 2018):
• Insurance requirements • Permits and licensing
• Background checks of drivers of for-hire vehicles (e.g., fingerprinting) • Per-ride fees
• Data sharing requirements • Passenger privacy
• Vehicle size
• Use of curb space for parking and stopping
These regulations can apply to for-hire vehicle such as TNCs or microtransit, but also other services such as carsharing. For example, one-way carsharing services such as car2go operate with special parking permits from cities that allow users to leave the vehicles at any official parking spot. Other localized regulations include: ability to pick-up or drop-off at the city airport, special fees for pick-ups and drop-offs in certain areas (e.g., Navy Pier in Chicago), and marking of vehicles to show operating company or permit.
2.3.2 Partnerships
There have been numerous partnerships between transit agencies and new mobility, but the vast majority of these have been with TNCs. Even though public transit has partnered with private companies for providing service often in the past, TNCs provide the unique challenge of being only callable by a smartphone, not owning their vehicles, and having an unsteady supply of contracted drivers. US partnerships between public transit and TNCs have varied in their purpose, structure, and closeness of partnership. These partnerships are sometimes formal and sometimes informal, and sometimes they include public subsidy or an advertising/marketing component. Generally, the types of partnerships have been related to:
• First/Last mile connectivity: This refers to partnerships that enhance connectivity to or from transit stations and can be undertaken through special advertising or special fares and discounts.
• Paratransit: These partnerships involve TNCs helping with paratransit or Dial-A-Ride services for the disabled or elderly.
• Low density area: These partnerships are in areas where fixed route public transit is not effective due to low density and so TNCs can help provide mobility.
• Low-productivity route service: These partnerships explore replacing existing poorly performing fixed service transit with on-demand service to save public money.
• Late night service: This refers to when TNCs provide special service at night when public transit is not widespread.
• Guaranteed ride home programs: These partnerships allow for the reimbursement of TNC trips in guaranteed ride home programs, which are intended to provide mobility in the event of unexpected emergency situations such as illness, injury, or unanticipated break down of usual commute vehicle.
• Marketing partnerships: Some partnerships are simpler in nature and extend only to marketing—such as placement of advertisements inside transit stations or declaring a TNC as an “official” rideshare partner, even when no money changes hands.
• App integration: These integrations are a move towards publicly-led Mobility as a Service (as explained in Chapter 3), and involve the inclusion of various travel modes including TNCs in transit trip planning apps.
Table 2-2: Overview of Partnerships Between US Public Sector and New Mobility (Curtis et al., 2019; Schwieterman and Livingston, 2018)
Agency (City) Service Partner First-Last Mile
Para-transit Night Late Sub-urban
Market Marketing Public Subsidy
App
Integration Duration Santa Monica
(BBB) Lyft • • July 2018 - present
Austin
(CapMetro) RideAustin • • – Dec 2018 June 2018
Central
Oregon (CET) Uber • •
June 2017 – Sept
2017 Central
Pennsylvania
(CPTA) Lyft, Uber • •
Mid 2017 - present Denton Texas
(DCTA) Uber, Lyft • • • Oct 2016 - present
Richmond (GRTC) UZURV and RoundTrip • • Aug 2017 – Aug 2018
LA (LA Metro) Via • • Jan 2018 – Jan 2019
Livermore (LAVTA) Lyft, Uber, DeSoto Cab Company • • • Jan 2017 – Jun 2019 Atlanta
(MARTA) Uber, Lyft • • July 2015 - present
Boston
(MBTA) Uber, Lyft • • Sep 2016 - present
NYC (NYCT) Uber, NYC Taxi, For-Hire Vehicles • • TBD San Bernadino (Omnitrans) Lyft, RIDE
Taxi • • July 2016 - present
Seattle (Pierce Transit) Lyft • • • • May 2018 – May 2019 Pinellas County FL (PSTA) Uber, Lyft, various local taxi agencies • • • • Feb 2016 - present Sacramento (SacRT) Uber, Lyft, Yellow Cab Company • • Oct 2016 – Mar 2017 San Mateo County CA (SamTrans) TBD • • TBD Philadelphia (SEPTA) Uber • • • May 2016 – Sept 2016 Cincinnati
(SORTA) Uber • • Mar 2016 – Mar 2017
Solano County
Washington DC (WMATA) Two local taxi companies • • Sept 2017 – present Chicago Region (Metra) Uber • Dec 2016 - present Outside Denver
(Centennial) Lyft • • Aug 2016 -
Altamonte
Springs FL Uber • • Mar 2016 -
San Diego
(MTS) Uber • • Summer 2016
Dallas (DART) Uber • Mar 2019 - present
LA (LA Metro) Zipcar Lyft, • Jan 2016 - present
Innisfil, ON
(City Govt.) Uber • present 2017 -
Denver (DDPW) Lyft, car2go, taxi, B-cycle • Feb 2016 - present Portland (TriMet) Uber, car2go, Biketown • 2017 - present Monrovia CA
(City Govt.) Lyft • Mar 2018 - present
The following map of the US gives further details about some of the mentioned partnerships as well as additional ones.
Figure 2-3: Partnerships between US Cities and TNCs (Schwieterman and Livingston, 2018)
2.3.3 Bans
Several cities have banned TNCs altogether, often in response to what is seen as unfair competition for local taxi companies. These cities or countries include but are not limited to: Frankfurt, Barcelona, Budapest, Turkey, Denmark, Portugal, China, and Vancouver (Rhodes, 2017). Often, TNCs are banned at certain areas such as airports but operate in the rest of the city. These bans, however, are difficult to enforce because TNCs are often unmarked and they can continue to operate informally. Often TNCs were banned initially and after a legislative battle or after the formulation of regulations the bans were lifted.
2.3.4 Chicago’s Response
Chicago has had an involved response to the rise of new mobility in the city. In particular, the Mayor commissioned a task force to examine future challenges and opportunities for transportation in Chicago and it submitted its report to the Mayor in March of 2019. This report is proactive with respect to new mobility and future challenges, though it remains to be seen how much of it will be implemented. The report recommends (City of Chicago, 2019):
• Implementing a VMT tax;
• Incentivizing businesses to provide transit benefits to employers; • Creating a governance framework for uniform data sharing; • Launching an autonomous vehicle pilot project;
• Ensuring new mobility is accessible to all;
• Ensuring that micromobility (scooter sharing, etc.) does not impede the public right of way; • Launching a scooter sharing pilot in 2019;
• And finally, creating a Chief Mobility Officer to leverage partners to implement a unified mobility strategy.
TNC regulation in Chicago is governed by the Office of Business Affairs and Consumer Protection in the Mayor’s office. One of their key achievements is the implementation of a per-ride TNC fee equal to a $0.02 per-trip license fee plus $0.60 per-trip Chicago Ground Transportation Tax Rate. This is in addition to an annual $10,000 license fee to operate in Chicago. The City imposes a special Ground Transportation Tax Rate of $5.60 for trips ending or starting at either of the two city airports or at Navy Pier. The regulations mandate that the digital platform must be accessible to users who are visually impaired or hard of hearing. They also mandate special requirements such as asking a user to acknowledge when there is surge pricing taking place before they confirm a trip. Finally, in April 2019, Chicago became the first US city to publicly release the following TNC data:
1. Ride-hail vehicle information (make, model, year, total trips completed) 2. Registered drivers (city of residence, driver start month, total trips completed)
3. Trip data (pick-up and drop-off location by census tract, rounded up start and end time of trip, rounded up fare and tip by the nearest $2.50, type of ride called)
2.3.5 Observations
Partnerships between cities or municipalities and TNCs have ranged from operational to just marketing, and from urban areas to suburban. Many of the partnerships in smaller towns involve public money used to subsidize trips, with the argument that it is cheaper for the city to do this than to develop a fixed route transit system in a low density environment. Most of the partnerships also appear to be related to first and last mile connectivity, but in the absence of detailed before and after survey results of the user’s travel behavior or a detailed study on ticket sales, it is difficult to ascertain whether first and last mile connections have led to a significant increase in ridership (i.e., switched otherwise car users to transit or induced transit trips). The partnerships, at the very least, would have increased the overall convenience for the user. Finally, Portland, LA, Denver, and Dallas are the four cities in which there is some sort of app integration with TNCs and other new mobility. However, there does not seem to be any joint fare product of a bundled pass as of yet. Further, there do not seem to be other innovative regulations in place such as: income-based subsidies for TNC trips, mandating only shared trips in parts of or the whole city, single fare system for TNCs and transit, requiring a minimum availability of TNCs in areas of the city, distance and congestion charging for trips, and charging for idling or circling time and distance (Freemark et al., 2019).
2.4 The Case for Partnerships
This chapter has presented an overview of recent disruptions in the mobility sector and public sector responses to them. The responses have been varied, which can leave a transit agency confused as to what path it should take with regards to new mobility. To put this decision in context, let us for a moment imagine the “do nothing” approach. TNCs and many new mobility
start-ups continue to receive copious amounts of venture capital money which has kept them afloat despite not once turning a profit since their inception. It appears that their approach is to hemorrhage money by paying drivers more than what is received through low fares in an attempt to establish TNCs as an integral part of the mobility system. This position is currently held by the personal vehicle, who TNCs claim they are fighting against, but also by public transit at least in major cities. Assuming for a moment that public transit is good for society and that personal vehicle use should be curbed in cities, the public sector should do all it can to ensure that in this almost artificial rise of TNCs is directed towards dislodging personal vehicle ownership rather than public transit from its place in the mobility system. And while today it is just TNCs that public transit is dealing with, in years to come autonomous vehicles have the potential to even more fundamentally disrupt the mobility system and pose an even greater threat to public transit as we know it. Thus, the public sector must begin to imbibe an approach of innovation that proactively directs current and future innovations towards making cities places that are desirable to live in for all.
But why, if the threat is so large, would the public sector opt to partner with TNCs? With the new entrance of a player in the mobility market, the public sector has five choices before it. One is to do nothing, which was the approach many cities initially took. This, however, ignores the negative externalities of the service and also does nothing to capture any of its positive impacts. The public could go the other extreme and ban the service, like Vancouver has done. While this eliminates the negative externalities, it also eliminates any positive impact the service was having on the lives of the people who used it. The third option is to again be extreme and partner with the service with very few conditions, which is what cities like Monrovia and Innisfil have done. While this reaps potential positives of the service for the public sector, it also might ignore negative effects. The fourth option is for the public sector to regulate the service, which is essentially what most governments currently do. This approach attempts to limit negative externalities and keeps the service available to all, but it also misses out on reaping positive benefits for the public sector. Thus, the fifth and final option left is to both regulate and partner with the service. Theoretically, at least, this approach can both limit the negative externalities of the service while at the same time capturing some positive impact for the public sector.
The idea of partnering with new mobility might seem counterintuitive. However, to give a political analogy, in parliamentary democracies political adversaries sometimes band together in coalitions to defeat another force. The force to be defeated, in this case, could be single occupancy vehicles. Partnering can also be a way for public transit to fill gaps in its service. Going back to the discussion in the opening of this chapter, the public sector has an obligation to provide mobility for all within its jurisdiction, regardless of the people who live there or how densely developed that area is. Given the land use patterns of most US urban areas, there are large populations that live in densities cannot easily support mass, frequent transit. This can trigger the Spiral of Death that pushes transit agencies into decline. If done correctly, a partnership with TNCs could help fill these gaps in a more financially efficient way, and might even provide better service to the customer. This is perhaps why many of the partnerships between public agencies and TNCs in the US have been to provide paratransit services, which allow public transit to focus resources and improve service elsewhere. A well-designed partnership could change the adversarial narrative that has prevailed.
Many people are still not convinced by this argument, asserting that TNCs are illegal and an overall negative influence on cities. It is important to remember that TNCs and other innovative mobility services have gained in popularity because they are serving an unmet demand, though often they might be inducing their own demand. In mobility systems, “informal” services have always been tacitly allowed to exist by the State because they fill gaps left by public services. These “informal” services become formalized in the eyes of the State once they follow a set of regulations set to ensure safety, sustainability, and other metrics for a public service. But it is by design that regulation follows slightly behind innovation so that it does not stifle it. For example, regulation in many places has followed the emergence of the sharing and gig economy (e.g., Airbnb, Task Rabbit, Uber, etc.). Thus, with some regulation imposed, a co-existence can emerge between public transit and TNCs.
Rather than seeing new mobility as a threat that must be wiped out, another way to look at it is as an opportunity. TNCs are clearly popular. They use advanced technology with complex matching algorithms to move people from point to point. In many cases, public transit service is simply not competitive from a wait time, travel time, comfort, or even price perspective. It is clear that public transit is not providing all the trips that people are demanding and willing to pay for, but a partnership with TNCs could jointly serve all (or most) of a person’s trips. This could either be done through first / last mile trips like many of the partnerships mentioned in the previous section, or through joint fare products, which is the theme of this thesis. The next chapter goes into more detail about the rationale for why joint fare products should be used as a framework for partnership. It is an acknowledgement by a public transit agency that it cannot serve all mobility needs in all situations (e.g., late night service or neighborhood to neighborhood service), but that with the help of another mobility service, it can provide a citizen the means to get between points. Ultimately, this sort of innovative thinking that is open to partnerships can help the public sector better fulfill its duty of ensuring mobility as a right.
Chapter 3 The Case for Bundled Mobility
Passes
The previous chapter outlined the ways new mobility services and public transit agencies have partnered or could be partnering, and this chapter will focus on one type of possible partnership: bundling services using special passes and/or other fare policies. The Chicago Transit Authority (CTA) requested help to develop a framework for possible engagement with new mobility but did not specify how. This chapter presents a background and rationale for why the bundled mobility pass was selected as the proposal for the CTA. Specifically, this chapter:
• Presents literature on economic theories for commodity bundling;
• Relates commodity bundling to transit passes and gives an overview of fare policy at the CTA;
• Introduces Mobility as a Service (MaaS) and presents examples and trends;
• Finds a rationale for implementing MaaS in Chicago with a leading role for the public sector.
3.1 Literature on Product Bundling
While this thesis is concerned with bundled mobility products, there is already a body of literature on product bundling in general. Product bundling, also called commodity bundling, is the selling of two or more goods together for a single price. It is already used extensively in the telecommunications, healthcare, automobile, airline, and entertainment industry, to name just a few. For example, today one can purchase access to the vast library of media on Netflix or Spotify for a single monthly price. Similarly, computers can be bought with different memory, screen resolution, and pre-installed software for a single price. Bundling is also used in transportation. For example, the same airplane ticket can be bought for different prices that include varying add-ons such as checked-in baggage, seat selection, and priority boarding. Bundling is also used in public transit, with a transit pass being a type of bundle in itself. This section presents an overview of the literature to provide a rationale for bundling in general and its extension to mobility as a service (MaaS).


![[PDF] Cours pdf LabVIEW Analyse des signaux | Formation informatique](data:image/gif;base64,R0lGODlhAQABAIAAAP///wAAACH5BAEAAAAALAAAAAABAAEAAAICRAEAOw==)