HAL Id: hal-02964252
https://hal.archives-ouvertes.fr/hal-02964252
Submitted on 12 Oct 2020HAL is a multi-disciplinary open access
archive for the deposit and dissemination of sci-entific research documents, whether they are pub-lished or not. The documents may come from teaching and research institutions in France or abroad, or from public or private research centers.
L’archive ouverte pluridisciplinaire HAL, est destinée au dépôt et à la diffusion de documents scientifiques de niveau recherche, publiés ou non, émanant des établissements d’enseignement et de recherche français ou étrangers, des laboratoires publics ou privés.
Modeling water exsolution from a growing and
solidifying felsic magma body
Catherine Annen, Alain Burgisser
To cite this version:
Catherine Annen, Alain Burgisser. Modeling water exsolution from a growing and solidifying felsic magma body. Lithos, Elsevier, In press, �10.1016/j.lithos.2020.105799�. �hal-02964252�
1
Modeling water exsolution from a growing and solidifying felsic magma body.
Catherine Annen1, 2, and Alain Burgisser1
1
Univ. Grenoble Alpes, Univ. Savoie Mont Blanc, CNRS, IRD, IFSTTAR, ISTerre, 38000 Grenoble,
France.
2
School of Earth Sciences, University of Bristol, Wills Memorial Building, Queen's Road, Bristol BS8
1RJ, United Kingdom
Corresponding author: Catherine Annen. [email protected]
Abstract
We modelled water exsolution from a growing and crystalizing felsic magma body using a conductive
thermal model with simplified physical mechanisms of volatile transport. Magma solidification leads
to the release of the water initially dissolved in the melt. Solidification behaviour depends, in turn, on
dissolved water content. The water is channelled where the magma is solidified enough to form a
crystal network and rapidly ascends until it encounters solid rock or liquid-rich magma. The rate of
water exsolution depends on the basal magma emplacement rate, the cooling rate, and the magma
initial water content. Water-rich layers form and are eventually trapped in the solid rock as cooling
and crystallization proceeds. We ran our model with a quasi-eutectic granite composition and a
non-eutectic monzogranite composition. The non-non-eutectic magma crystallises on a wider range of
temperature than the eutectic magma, produces more mush, and is more prone to the formation of
2
compositions and also above the top of the chamber for the non-eutectic composition. The actual
presence of these water-rich layers in nature and their lifetime depends on whether the water is
further released by fracturing. Our results accounts for the observed decoupling of volatiles from
magma and for the episodic nature of volcano deformation. It has implications for the interpretation
of magma chambers tomography as water-rich lenses would be difficult to distinguish from melt-rich
lenses.
Keywords: magma, volatiles, water exsolution, granite
1
Introduction
Magmas are mixtures of melt, crystals, and volatiles. At depth, they contain various dissolved volatile
species, including H2O, CO2, and SO2. Magma decompression or crystallization induces volatiles
exsolution and formation of an independent phase of supercritical fluid.
Volatiles play an important role in volcanology. Their proportions strongly affect eruptions styles as
gas-rich magmas are more explosive and hazardous than their gas-poor counterpart. The presence of
exsolved volatiles also affects geophysical measurements. On the one hand, exsolved volatiles
increase magma compressibility, so that magma volumes may be underestimated if based on ground
surface deformation (Tait et al, 1989). On the other hand, the change in volume caused by water
exsolution in closed system induces an overpressure that may lead to the rupture of the chamber
walls (Blake, 1984; Fowler and Spera, 2008, 2008; Tait et al., 1989). Volatiles also affect seismic wave
velocities and electrical resistivity and make magma chamber imaging difficult to interpret.
Volatiles transfer is believed to play a role in petrogenesis (Collins et al., 2020; Weinberg and
Hasalová, 2015). The presence of H2O increases melt fractions. Fluxing of the crust by H2O exsolved
3
fate of magmatic systems is thus not restricted to eruptive processes. Fluxes and concentration of
magmatic volatiles are also keys in the generation of ore deposits. Metals present in the magma are
partitioned in the supercritical phase and transported by the volatiles towards upper levels above the
magma chamber where they precipitate (Richards, 2011).
Analytical and thermodynamical models have been used to investigate the conjugate effect of
crystallisation and volatiles exsolution on chamber pressure (Blake, 1984; Boichu et al., 2008; Tait et
al., 1989) and magma fragmentation (Fowler and Spera, 2008) in order to evaluate the role of
volatiles in triggering eruptions. Excess mass of volcanic SO2 emission suggests that volatiles separate
from the magma at depth (Christopher et al., 2015; Wallace, 2001). Laboratory experiments and
numerical simulations (Oppenheimer et al., 2015; Parmigiani et al., 2017, 2016) indicate that the rise
of suspended bubbles in melt-rich magma is limited and that volatiles preferentially ascend in
crystal-rich material through fingering channels and capillary fracturing. For this paper, we built on these
former studies, and modeled H2O exsolution and transport within a growing and solidifying magma
body. We tested the influence of magma chamber growth rate and magma composition, including
initial water content, on exsolved volatile spatial and temporal distributions.
At the pressures and temperatures inside the magma body, the exsolved volatiles are supercritical
fluids; for simplicity, we still use the terms bubbles. We will also use the term water independently of
its state.
2
Numerical models
2.1 Magma chamber growth
Several conceptual models of magma bodies emplacement and growth have been proposed. They
include diapirism (e.g. He et al., 2009; Miller and Paterson, 1999), ballooning (e.g. Molyneux and
4
Yoshinobu et al., 2003), and repeated additions of sills or dykes (e.g. Allibon et al., 2011; Michel et
al., 2008; Miller et al., 2011). Here, we model the growth of a magma chamber by under-accretion of
sills. This growth geometry is probably most common in the brittle upper crust and is supported by
field observations (Grocott et al., 2009; Michel et al., 2008), geophysics (Cruden and McCaffrey,
2001), and laboratory experiments (Kavanagh et al., 2006; Menand, 2011). The presence and size of
a magma chamber (defined here as a body of eruptible magma larger than a single sill) depends on
the magma body emplacement rate (Annen, 2009). This emplacement rate (or growth rate or growth
velocity) is the thickness of sills divided by the time interval between sill emplacements (rest
interval). It is equivalent to the flux, i.e. the added volume by unit of time divided by footprint area,
that is commonly used in the literature (Sliwinski et al., 2019). If emplaced in a cold crust and if the
emplacement rate is low enough, the first sills completely solidify during the rest interval. With each
sill intrusion, heat is transferred to the surroundings and the temperatures of the whole system
increase. When temperatures are high enough, melt subsists in the sills during the rest interval. We
call incubation time the moment when a magma that is liquid and eruptible (i.e. with a melt fraction
>~0.5) starts to accumulate. Both the incubation time and the size reached by the magma chamber
depend on the emplacement rate. We did not consider mechanical effects on the stability or growth
of the chamber and did not allow the country rock to partially melt (Karlstrom et al., 2010). More
details on the magma chamber growth model can be found in Annen et al. (2008) and Annen (2009).
For the present paper, the exsolution and transfer of water was implemented in the simulation of
magma chamber growth. H2O fractions, melt fractions, and temperatures are calculated both during
the growth and the solidification of the magma body. We modelled the magma body growth by
addition of 100-m thick sills until the total thickness of intruded material reaches 2000 m (Fig. 1),
after which new sill injections no longer occur. The first sill is emplaced at 5.5 km depth and the last
at 7.5 km depth. After the emplacement of the last sill, the simulation continues to run until no melt
remains in the system. The diameter of the sills is 2000 m. The initial temperature of the sills at the
5
tested sills emplacement rate of 1, 5, 10, and 100 cm/yr. We also simulated the cooling of a 2000 m
thick, 2000 m wide magma body that was instantaneously emplaced. The final geometry and volume
of the intrusive body is similar for all simulations.
The simulations are run in 2D on a square grid with cylindrical coordinates. The numerical domain is
10 km x 2.5 km (Fig. 1). The grid cells dimension is 25m x 25 m. The initial temperatures of the
numerical domain follow a linear geothermal gradient of 20 oC/km. The boundary conditions are a
constant temperature T = 0 oC at the top of numerical domain that corresponds to the Earth surface,
and no heat flow at the right and left boundaries. The horizontal dimension of the domain (2.5 km)
was chosen so that the thermal anomaly induced by the sills does not reach the right boundary on
the timescale of the simulation. The heat flux through the bottom boundary is calculated by first
calculating the depth Zl where the temperature reaches the liquidus temperature Tl of the emplaced
magma (which varies as a function of the magma composition) according to the initial geothermal
gradient. This depth is outside the numerical domain and is assumed to be the source of the magma.
The bottom heat flux QB is then calculated as follows:
(1)
Where TB is the temperature at the bottom boundary, ZB is the depth of the bottom boundary
(10km), and is the thermal conductivity.
Sills have a cylindrical geometry and pile up to build a cylindrical composite intrusion, the final shape
of which is axisymmetric and isometric (Fig. 1). The volume of each new sill is accommodated by
moving downwards the cells below the sill. It is an approximation of magma accommodation by
chamber floor subsidence (Cruden and McCaffrey, 2001).
6
(2)
(3)
With the density, c the specific heat capacity, T the temperature, Xm the melt mass fraction, and L the latent heat of crystallisation. The list of symbols is in Table 1. Details of the discretization by finite
difference of the equations can be found in Annen et al (2008). The thermal conductivity depends on temperature and on the lithostatic pressure (Chapman and Furlong, 1992):
(4)
where 0 is the thermal conductivity at surface temperature and pressure, and z is depth.
The density and the specific heat capacity do not depend on temperature in our simulation in order
to avoid issues with heat conservation at the system scale.
2.2 Volatile exsolution
In this paper, we specifically address the exsolution rate of water as the main volatile phase in
magmas emplaced in the upper crust. We assume that exsolution due to decompression during
ascent has occurred before magma emplacement. According to Duan (2014), in silicic melts, all CO2
might be already lost before H2O starts to exsolve. The solubility of water, Cw, is only weakly
influenced by temperature and composition (Duan, 2014). It is mainly a function of pressure P
(Newman and Lowenstern, 2002; Schöpa et al., 2017; Sparks, 1978; Tait et al., 1989):
7
with s = 4.11 x 10⁻⁶ Pa-n, and n = 0.5 (Burnham and Jahns, 1962).
If a magma is undersaturated, dissolved H2O concentrates in the melt while the magma cools and
crystallizes:
(6)
where Xd is the weight fraction of H2O dissolved in the melt, X0 is the initial weight fraction of water
dissolved in magma, Xc is the fraction of H2O that enters hydrous minerals, and Xm is the weight
fraction of melt. When Xd exceeds Cw, water is exsolved.
2.3 Melt fractions
We based our relationship between melt fractions, dissolved water content, and temperatures on
the experimental data of Whitney (1988) that were obtained at a pressure of 2 kbar. At this pressure,
the solubility of water Cw is about 6 wt%. The relationship between melt fraction and temperature
depends on the melt water content (Whitney, 1988). If the water exsolved during crystallization is
transported upwards, any reheating of the material that lost its water produces a melt that is
undersaturated in water. The melt fraction would then be lower than it was originally at the same
temperature (Caricchi and Blundy, 2015). This effect is for the first time integrated in a numerical
simulation, which allows us to estimate the error induced by neglecting the effect of water loss when
modelling incrementally growing magma bodies.
Figure 2 shows the relationships between melt fraction and temperature used in the numerical
simulation. To build figure 2a, we used the experimental data of Whitney (1988) for Cape Ann granite
(Massachussets). The liquidus temperatures for different water content were estimated from
8
between liquidus temperature Tl and magma water content X0 is close to linear, so that in the
numerical simulation (Fig. 2):
(7)
The melt fraction-temperature curve for a saturated composition (6 wt% H2O) is obtained by linearly
interpolating between experimental data points. For magmas that are undersaturated at liquidus,
saturation is reached at melt fraction Xms = (X0-Xc)/0.06. The temperature Tsat corresponding to Xms is
read on the saturation curve. The undersaturated curves join the saturated curve at this point, and
for any lower temperatures the melt fraction is that of a saturated composition (Caricchi and Blundy,
2015). To fit Whitney’s experiment data with H2O content of 1, 2, 3, and 5 wt%, we used linear curves
that relies Tsat with 800 oC and 800 oC with Tl. The melt fraction at 800 oC depends on the water
content (Fig. 2a). The numerical simulation is only valid for H2O content X0 in excess of the amount of
water trapped in crystal Xc. The results are presented for Xc = 0.4 wt%, which corresponds to the
crystallization of about 10 wt% biotite. For all water contents between 0.4 wt% (=Xc) and 6 wt%
(saturation), Xm(T=800°C) is found by interpolation.
To test the effect of the magma composition, we simulated the injection of a water-saturated and a
water under-saturated Cape Ann magma. We also ran simulations with the melt
fraction-temperature relationship obtained with Rhyolite-MELTS for the Mt. Capanne monzogranite
composition (Barboni et al., 2015 and fig. 2b). In this last composition, we neglect the effect of H2O
loss on the melt fraction-temperature curve. We will show a posteriori using the Cape Ann granite
curves that this effect is insignificant. In comparison with the Cape Ann granite curve, the Mt.
Capanne curve is less steep at low temperatures and the mush state, where crystals form a network
and can channel water, covers a wider range of temperatures. The initial temperature of the magma
9 2.4 Volatiles transport
When saturation is exceeded, bubbles form. Their fate depends on the crystal and volatile fractions.
In contrast to other models (e.g. Black and Manga, 2016), the bubbles in our model do not rise in the
liquid magma, but in the mush only. For gas volume fraction < 0.5 and crystal volume fraction < 0.4,
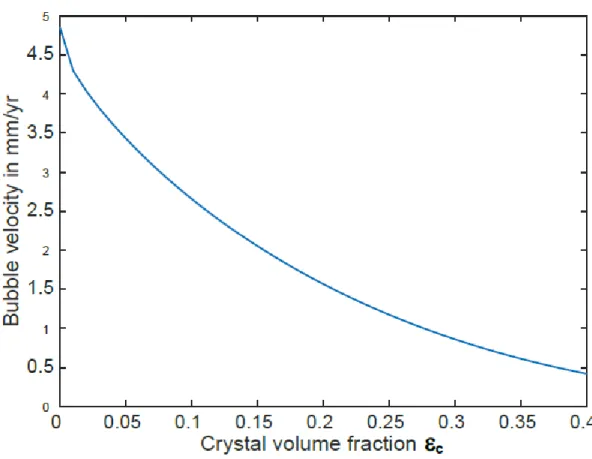
bubble rise velocity v is controlled by Stokes law. The presence of other bubbles and of suspended
crystals hinder bubble ascent and decrease their velocity. At 2 kbar, bubble diameters are typically a
few tens of m (Lyakhovsky et al., 1996). Figure 3 shows the rise velocity of 50-m-diameter bubbles suspended in a melt with a viscosity of 105 Pa s. The bubble velocity is on the order of mm per year.
Considering the very slow rise of the bubbles, we followed Parmigiani et al (2017) in assuming that
the exsolved water is immobile and remains in the magma for crystal volume fractions < 0.4.
It has been shown experimentally (Barth et al., 2019; Holtzman et al., 2012; Oppenheimer et al.,
2015; Varas et al., 2015) and numerically (Parmigiani et al., 2017) that mushes are favorable
environments to form permeable pathways for gas migration. For crystal volume fractions in the
range 0.4-0.7, crystals form a connected network with gas and melt confined in the interstitial space.
At gas volume fraction between a critical value crg and 0.5, gas viscous fingering occurs. Fingering channels allow the upwards migration of the gas through the interstitial melt within the crystal
network. crg was determined through numerical simulations by Parmigiani et al (2017):
(8)
Where c is crystal volume fraction. The velocity of exsolved volatiles transported through channeling is on the order of a few mm to a few cm per seconds (Parmigiani et al., (2017). So the time needed to
cross any reasonable thickness of mush is much shorter than the numerical time step of the
simulation, which is 5 yrs for a cell dimension of 25 m. At the scale of our simulation, we consider
10
exsolved in an area of magma reservoir where the crystal volume fraction is between 0.4 and 0.7 and
the volatile volume fraction is between crg and 0.5 is transported vertically upwards until it hits a
domain where these conditions are not fulfilled.
3
Results
3.1 Distribution of exsolved H2O
In the simulation, the exsolved water is arrested at the interface between mush and melt-rich
magma (c<0.4, bubbles are suspended) and at the interface between mush and quasi-solid material
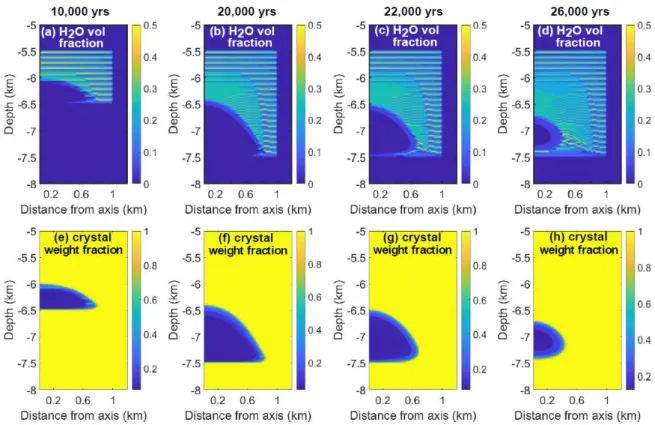
(c>0.7, bubbles are trapped by crystals). Figures 4 and 5 show how the exsolved water volume
fraction and the crystal weight fraction evolve during magma chamber formation and solidification.
For an igneous body growing by accretion of sills, the first sills completely solidify between two
magma injections, and water can only be transported over the thickness of a single sill. Water
concentrations underline the shape of these first sills (Fig. 4a-d, Fig. 5 a-d, and Fig. 6d). After an
incubation period that depends on the sill emplacement rate, a magma chamber forms (Figs 4 e–h
and 5 e–h). Channeling and water accumulation happen at the chamber periphery where the magma
cools down and turns into a mush. Magma chambers form later when the sill emplacement rate is
low (Annen, 2009). In the limiting case where the emplacement rate is too low for a magma chamber
to form at all over the duration of the simulation, the concentration of water is limited by the size of
the sills (Fig. 6 g-i).
At injection rates high enough for a magma chamber to grow (>~1 cm/yr), the final water distribution
is an integration of the syn- and post-emplacement evolutions. Post emplacement, as it cools down,
the magma chamber is surrounded by a corona of mush propitious to gas channeling. As detailed
below, the thickness of this mush envelope depends on magma composition (compare Fig. 4e-h and
11
the more water is channeled upwards. The mush is thin at the chamber bottom because of a steep
temperature gradient. Thus, the accumulation of water at the bottom of the chamber is limited,
especially for the Cape Ann composition (Fig. 4). The thickest mush columns are at the outer
periphery of the axisymmetric magma chamber. So exsolved water preferentially accumulates on the
upper side of the chamber. The locus of maximum water concentration moves inwards as the
magma chamber retracts by cooling, which leaves behind trails of high water concentration (Fig. 6a,
d). As the chamber solidifies, water-rich pockets and layers get trapped in the solidified granite while
the mush is water depleted.
3.2 Magma composition
Magma composition and volatile content affect the slopes of the melt fraction-temperature curve
(fig 2). The Cape Ann granite water-saturated composition evolves along a steeper melt
fraction-temperature slope than an undersaturated granite composition or the Mt. Capanne monzogranite
composition. As a result, the envelope of mush around the quasi-eutectic magma chamber (Fig. 4) is
narrower than that around the non-eutectic chambers (Fig. 5).
Figure 7 shows in more detail how the volume fraction of crystals, melt, and water — before any
water transport — evolve with temperature. It also shows the critical gas fraction. Although granitic
undersaturated compositions produce more mush than a saturated composition (Fig. 2), less volatile
transport occurs through them because volatiles saturate and exsolve at lower temperature and
higher crystallinity compared to saturated compositions (Fig. 7b and 8). For the Cape Ann
composition with 2 wt% initial water, no volatile transport and accumulation occur (Fig. 7c and 8c);
The water exsolves at a melt fraction (0.27 wt%) that is below the critical value for channeling (Fig.
7c) and the bubbles remain trapped in the crystal-rich material. The Mt. Capanne monzogranite,
water-saturated composition fosters the most transport and accumulation of volatiles (Fig. 7d). A
channel-prone mush is present between solidus and about 770 °C and the gas proportion is above
12
yrs on Fig. 5), a body of mush without liquid core is present for this composition. At this stage, most
water concentration occurs within and atop the mush body (Fig. 5h).
3.3 Volatiles output rates
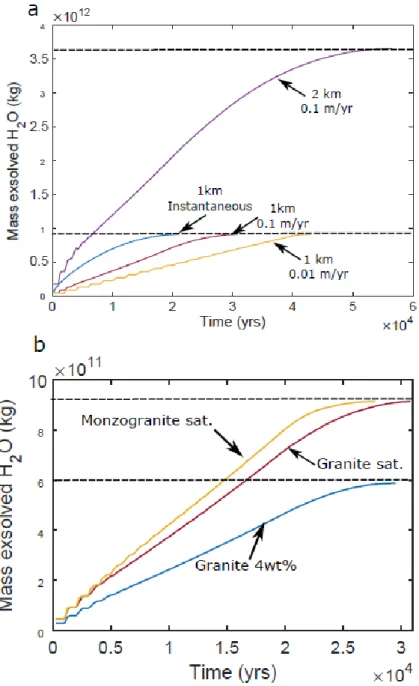
Figure 9 shows the cumulated mass of H2O exsolved that is assumed extractable because not trapped
in the liquid magma. The water fluxes reflect the magma fluxes, i.e. they depend on the sill
emplacement rate and radius (Fig. 9a). The radius is the most important parameter since it controls
both the amount of magma and water available, and the cooling surface area. As expected, the
exsolution rate is lowest for an undersaturated magma (Fig. 9b). The saturated, Mt. Capanne
monzogranite produces exsolved volatiles at a slightly higher rate than the Cape Ann saturated
granite (Fig. 9b).
3.4 Effect of water loss on melt fractions
We tested the effect of water loss on the evolution of melt fractions for the water-saturated Cape
Ann granite. We ran simulations where the melting curve was readjusted to the new conditions in
cells that previously lost water and the magma became under-saturated upon remelting, and
simulations where water loss or gain has no effect on the melting curves. In the second case, only the
saturation curve (blue upper curve in Fig. 2a) was used in the computation of melt fractions
independently of the actual melt water content.
Water loss has no effect on melt fraction for an instantaneously emplaced body that is only cooling
because there is no reheating and remelting of partially solidified magma. Since only the water that
is in excess of saturation is exsolved, the melt stays saturated and remains on the saturation curve.
For an incrementally growing body, the water loss effect on melt fractions is not null but is very
13
in melt wt% between the two simulations. In the case shown here, i. e. for an emplacement rate of
one 100 m-thick sill every 1000 yrs, neglecting the effect of water results in a maximum melt fraction
overestimation of 3 wt% at the outer boundary of the mush and an underestimation of less than 1
wt% melt at the bottom of the chamber. Overall, the difference does not exceed 4% of the total melt
volume in the system.
4
Discussion
The simulations presented in this paper provide new insights on what might happen in a growing and
solidifying magma chamber. A series of processes, however, have been neglected and can be the
focus of further studies.
4.1 Volatiles channeling
When considering volatile transport through channeling, we neglected the capillary effect, which
causes a small fraction of gas to remain within the channels. The amount of gas retained depends on
grain sizes and interfacial tensions between crystals and melt, which cannot easily be constrained
(Edmonds and Woods, 2018) more precisely than stating that it is much smaller than crg (6–10
vol.%).
In our simple model, volatiles only move upwards and not sideways (e.g. Belien et al., 2010), which
constrains their level of accumulation to the top of the mush columns they are issued from. The
accumulation of volatiles is stopped when their proportion reach 50 vol%, which results in volatile
layering. In the real world, we expect further volatile transfer by capillary fracturing, which would
result in volatile layers connection and further volatile transport toward the surface.
Since the volatiles accumulate atop the mush, the actual distribution of the volatiles depends on the
14
grows by under-accretion of sills of similar dimensions. We expect real intrusions to be more
irregular and to cause different patterns of volatiles depletion and accumulation.
4.2 Magma convection
We neglected the possibility that the volatiles that accumulate at the base of the liquid magma
chamber might be entrained in the chamber by magma convection. Magma convection is not
included in our model and the cooling rates might be underestimated. Scaling of magma convection
usually assumes that the magma is heated from below or cooled from above (Worster et al., 1990),
whereas in our model and in nature, an intrusion of magma is cooled from both surfaces. In such
case, scaling relationships linking thermal gradient, fluid viscosity, and the effects of thermal
expansion to a characteristic convection velocity are generally limited to the boundary layer region
(e.g. Huber et al., 2009). Estimating the rate of bubble redistribution across the convecting magma
without solving for convection itself is thus a complex task. Our results suggest that neglecting
volatile entrainment by magma convection is of little consequence because volatile accumulation at
the base of the magma that would be subject to convective motions, although present, is limited
compared to the accumulation at the sides (granite and monzogranite compositions) and atop the
chamber (monzogranite composition).
4.3 Pressure of exsolved volatile
We do not take into account the effect of pressure change due to volatile exsolution on the phase
relationship. Indeed, the increase in pressure due to water exsolution is expected to modify water
solubility (Blake, 1984) until the system reaches a new pressure equilibrium (Tait et al., 1989). Taking
these feedback effects into account significantly increases the complexity of the simulations and is
15 4.4 Implications for natural systems
Our simulations produce a decoupling between volatiles and magma, a process that had been
inferred from the imbalance between the excess mass of SO2 released by volcanoes and the mass of
erupted melt (Christopher et al., 2015; Wallace and Gerlach, 1994). However, in contrast with most
conceptual models (e.g. Richards, 2011; Wallace, 2001), in our simulations bubbles are channeled by
the mush instead of ascending in the liquid magma. The consequence is that accumulation of water
occurs at the top of the mush and in the solidified magma rather than atop the liquid-rich magma
chamber.
Pegmatites, hydrothermal veins, and drusy cavities testify to the presence of water in granites
(Bartley et al., 2020). Exhumed granites have lost their water and it remains to be determined if this
loss is continuous, i.e. if capillary fracturing and water transport in the solid rock are
contemporaneous with exsolution and channeling through the mush. Indeed, any capillary fracturing
and further water loss must be delayed for the water-rich layers generated in our numerical
simulation to actually form in real intrusive bodies.
The possible presence of water-rich layers in magmatic bodies has a series of implications. Water and
melt both reduce rock electrical resistivity, density, and seismic wave velocity. Thus, the presence of
water in the solidified part of a magma body would affect the interpretation of tomography based on
those physical properties and, if not taken into account, would lead to an overestimation of magma
chamber dimensions.
High proportion of water results in the fragmentation and fluidization of the rock even at low melt
fraction (Fowler and Spera, 2008). We speculate that it might play a role in the formation of schlieren
structures (Ardill et al., 2020). In case of chamber failure and eruption, the entrainment of those
fragmented layers from the roof could explain the common presence of older crystals and the
16
It has been argued that the overpressure due to volatile exsolution is high enough to fracture the
wall rocks and trigger eruptions (Blake, 1984; Fowler and Spera, 2008; Tait et al., 1989; Tramontano
et al., 2017). The pressure in the chamber depends on the chamber geometry and dimensions, on
the magma compressibility, and on the wallrock viscoelastic properties (Jellinek and DePaolo, 2003).
In our simulations, those parameters vary in time and there are gradients in phase proportion, hence
in viscosity and compressibility. Computing pressures is beyond the scope of this paper. We note
however that in a viscoelastic crust, the pressure is controlled by the rate of volume increase (Jellinek
and DePaolo, 2003). This rate is slow since volatile exsolution is controlled by heat diffusion. This
aspect was not taken into account in former studies, thus it remains to be shown if bubble exsolution
can trigger eruption in a viscoelastic crust.
The flux of water released from our modeled magma is of the order 107-108 kg per year. Comparing
the flux of water from our simulations with field data is not straightforward. Data on water release
from volcanic areas are scarce. The water flux is controlled both by the quantity of magma and by its
cooling rate, hence by the cooling area. With radius of 1 to 2 km, the modeled magma bodies are
relatively small. With a radius of several tens of kilometers, the cooling surface area would be
multiplied by 100 and the exsolution rate would also increase by orders of magnitude. The
deformation recorded in the Phlegrean Fields (Italy) between 1982 and 1984 has been linked to the
crystallization of 0.83 km3 of magma and the release of ~6.2 × 10¹⁰ kg of H2O (Bodnar et al., 2007).
According to Bodnar et al (2007), this water may have been trapped beneath an impermeable layer
before being suddenly released when this layer was breached. More generally, ground deformation
is often episodic and the volcanoes are said to be breathing. The source of the deformation is
attributed to magma (Battaglia et al., 1999; Parks et al., 2012) or to volatiles transport (Bodnar et al.,
2007; Vargas et al., 2017). If volatiles are involved, the episodic aspect of deformation suggests that
water is able to accumulate before being released by fracturing events (Christopher et al., 2015).
Conceptual models for the generation of porphyry copper deposits involve metal transport through
17
our simulations suggest, water accumulates preferentially at the chamber sides and if it plays a role
in the initiation of dykes, we expect volatiles-rich dykes to be initiated from the sides of the chamber.
Interestingly, on a reconstruction of the Yerington batholith based on field exposure, the source of
the dykes associated with mineralization originates mostly from the side of the granite body (see
Fig.1 in Schöpa et al., 2017). Whether this match of locations is fortuitous or not warrants further
investigation.
Since water-undersaturated Cape Ann granite produces less melt than when it is saturated, Caricchi
and Blundy (2015) argue that the effect of water loss needs to be taken into account in modeling of
incremental magma emplacement. Our results shed a different light on this issue as they show that,
in case of incremental emplacement with injection of a magma of Cape Ann granite composition, the
effect of water loss on melt production is not significant. This is because re-melting of previously
emplaced sills is limited. Indeed, if the preceding sill is already cold, reheating by the new sill is not
enough for the cold sill to reach solidus. If the preceding sill is still hot, i.e. above about 700°C, it has
not lost its water by the time the new sill is emplaced and its melting curve remains identical. The
situation might be different if the new magma is of different composition and much hotter than the
resident magma.
5
Conclusions
We simulated volatile exsolution and transport within a growing and solidifying magma body.
Transport of water through the mush results in an efficient decoupling of water and magma. Our
simulations suggest that the geometry and size of the mush that surrounds a magma chamber
controls volatiles transfer and accumulation. If the water does not escape immediately through solid
rock fracturing, water-rich pockets get trapped in the roof and walls of the intrusive body upon
solidification. Magma compositions that are water-saturated but non-eutectic are most susceptible
18
if the magma is strongly under-saturated, water exsolves when the crystal content is already high
and cannot move upwards and accumulate.
The accumulation and eventual sudden release of water could explain the episodic deformation of
volcanoes. The possible presence of water-rich layers in the solidified roof and wall of a magma
chamber could lead to an overestimation of the magma reservoir size if not taken into account when
interpreting magma chamber tomography.
If bubbles play a role in the rupture of a magma reservoir and the initiation of dykes, our result that
water accumulates atop the mush rather than atop the liquid magma might explain why many
erupted magmas are crystal rich.
Acknowledgements
CA was supported by the European Union’s Horizon 2020 research and innovation programme under
the Marie Sklodowska-Curie grant agreement No. 794594 and by a grant from the Institut Rhônalpin
des Systèmes Complexes. We thank three anonymous reviewers for helping us to improve and clarify
the manuscript.
References
Allibon, J., Bussy, F., Lewin, E., Darbellay, B., 2011. The tectonically controlled emplacement of a
vertically sheeted gabbro-pyroxenite intrusion: Feeder-zone of an ocean-island volcano
(Fuerteventura, Canary Islands). Tectonophysics 500, 78–97.
Annen, C., 2009. From plutons to magma chambers: Thermal constraints on the accumulation of
eruptible silicic magma in the upper crust. Earth and Planetary Science Letters 284, 409–416.
19
Annen, C., Pichavant, M., Bachmann, O., Burgisser, A., 2008. Conditions for the growth of a long-lived
shallow crustal magma chamber below Mount Pelee volcano (Martinique, Lesser Antilles
Arc). journal of Geophysical Research 113. https://doi.org/doi:10.1029/2007JB005049
Ardill, K.E., Paterson, S.R., Stanback, J., Alasino, P.H., King, J.J., Crosbie, S., 2020. Schlieren-bound
magmatic structures record crystal flow-sorting in dynamic upper-crustal magma-mush
chambers. Front. Earth Sci. 8. https://doi.org/10.3389/feart.2020.00190
Barboni, M., Annen, C., Schoene, B., 2015. Evaluating the construction and evolution of upper crustal
magma reservoirs with coupled U/Pb zircon geochronology and thermal modeling: A case
study from the Mt. Capanne pluton (Elba, Italy). Earth and Planetary Science Letters 432,
436–448. https://doi.org/10.1016/j.epsl.2015.09.043
Barth, A., Edmonds, M., Woods, A., 2019. Valve-like dynamics of gas flow through a packed crystal
mush and cyclic strombolian explosions. Scientific Reports 9, 821.
https://doi.org/10.1038/s41598-018-37013-8
Bartley, J.M., Glazner, A.F., Stearns, M.A., Coleman, D.S., 2020. The Granite Aqueduct and
Autometamorphism of Plutons. Geosciences 10, 136.
https://doi.org/10.3390/geosciences10040136
Battaglia, M., Roberts, C., Segall, P., 1999. Magma Intrusion Beneath Long Valley Caldera Confirmed
by Temporal Changes in Gravity. Science 285, 2119–2122.
https://doi.org/10.1126/science.285.5436.2119
Belien, I.B., Cashman, K.V., Rempel, A.W., 2010. Gas accumulation in particle-rich suspensions and
implications for bubble populations in crystal-rich magma. Earth and Planetary Science
Letters 297, 133–140. https://doi.org/10.1016/j.epsl.2010.06.014
Black, B.A., Manga, M., 2016. The eruptibility of magmas at Tharsis and Syrtis Major on Mars. Journal
20
Blake, S., 1984. Volatile oversaturation during the evolution of silicic magma chambers as an eruption
trigger. Journal of Geophysical Research: Solid Earth 89, 8237–8244.
https://doi.org/10.1029/JB089iB10p08237
Bodnar, R.J., Cannatelli, C., De Vivo, B., Lima, A., Belkin, H.E., Milia, A., 2007. Quantitative model for
magma degassing and ground deformation (bradyseism) at Campi Flegrei, Italy: Implications
for future eruptions. Geol 35, 791. https://doi.org/10.1130/G23653A.1
Boichu, M., Villemant, B., Boudon, G., 2008. A model for episodic degassing of an andesitic magma
intrusion. Journal of Geophysical Research: Solid Earth 113.
https://doi.org/10.1029/2007JB005130
Burchardt, S., Tanner, D., Krumbholz, M., 2012. The Slaufrudalur pluton, southeast Iceland—An
example of shallow magma emplacement by coupled cauldron subsidence and magmatic
stoping. GSA Bulletin 124, 213–227. https://doi.org/10.1130/B30430.1
Burnham, C.W., Jahns, R.H., 1962. A method for determining the solubility of water in silicate melts.
Am J Sci 260, 721–745. https://doi.org/10.2475/ajs.260.10.721
Caricchi, L., Blundy, J., 2015. Experimental petrology of monotonous intermediate magmas.
Geological Society, London, Special Publications 422, 105–130.
https://doi.org/10.1144/sp422.9
Chapman, D.S., Furlong, K.P., 1992. Thermal state of the continental lower crust. in Continental lower
crust ed. By D.M. Fountain, R.Arculus, R.W. Kay, Developments in Geotectonics, Elsevier 23,
179–199.
Christopher, T.E., Blundy, J., Cashman, K., Cole, P., Edmonds, M., Smith, P.J., Sparks, R.S.J., Stinton, A.,
2015. Crustal-scale degassing due to magma system destabilization and magma-gas
decoupling at Soufrière Hills Volcano, Montserrat. Geochemistry, Geophysics, Geosystems
16, 2797–2811. https://doi.org/10.1002/2015GC005791
Collins, W.J., Murphy, J.B., Johnson, T.E., Huang, H.-Q., 2020. Critical role of water in the formation of
21
Cooper, K.M., Kent, A.J.R., 2014. Rapid remobilization of magmatic crystals kept in cold storage (vol
506, pg 480, 2014). Nature 508, 554–554. https://doi.org/10.1038/nature13280
Cruden, A.R., McCaffrey, K.J.W., 2001. Growth of plutons by floor subsidence: Implications for rates
of emplacement, intrusion spacing and melt-extraction mechanisms. Phys. Chem. Earth Pt.
A-Solid Earth Geod. 26, 303–315.
Duan, X., 2014. A general model for predicting the solubility behavior of H2O–CO2 fluids in silicate
melts over a wide range of pressure, temperature and compositions. Geochimica et
Cosmochimica Acta 125, 582–609. https://doi.org/10.1016/j.gca.2013.10.018
Edmonds, M., Woods, A.W., 2018. Exsolved volatiles in magma reservoirs. Journal of Volcanology and
Geothermal Research 368, 13–30. https://doi.org/10.1016/j.jvolgeores.2018.10.018
Fowler, S.J., Spera, F.J., 2008. Phase equilibria trigger for explosive volcanic eruptions. Geophysical
Research Letters 35. https://doi.org/10.1029/2008GL033665
Grocott, J., Arevalo, C., Welkner, D., Cruden, A., 2009. Fault-assisted vertical pluton growth: Coastal
Cordillera, north Chilean Andes. Journal of the Geological Society 166, 295–301.
He, B., Xu, Y.-G., Paterson, S., 2009. Magmatic diapirism of the Fangshan pluton, southwest of
Beijing, China. Journal of Structural Geology 31, 615–626.
https://doi.org/10.1016/j.jsg.2009.04.007
Holtzman, R., Szulczewski, M.L., Juanes, R., 2012. Capillary Fracturing in Granular Media. Physical
Review Letters 108. https://doi.org/10.1103/PhysRevLett.108.264504
Huber, C., Bachmann, O., Manga, M., 2009. Homogenization processes in silicic magma chambers by
stirring and mushification (latent heat buffering). Earth and Planetary Science Letters 283,
38–47. https://doi.org/10.1016/j.epsl.2009.03.029
Jellinek, A.M., DePaolo, D.J., 2003. A model for the origin of large silicic magma chambers: precursors
22
Karlstrom, L., Dufek, J., Manga, M., 2010. Magma chamber stability in arc and continental crust.
Journal of Volcanology and Geothermal Research 190, 249–270.
https://doi.org/10.1016/j.jvolgeores.2009.10.003
Kavanagh, J.L., Menand, T., Sparks, R.S.J., 2006. An experimental investigation of sill formation and
propagation in layered elastic media. Earth and Planetary Science Letters 245, 799–813.
Lyakhovsky, V., Hurwitz, S., Navon, O., 1996. Bubble growth in rhyolitic melts: experimental and
numerical investigation. Bulletin of Volcanology 58, 19–32.
https://doi.org/10.1007/s004450050122
Menand, T., 2011. Physical controls and depth of emplacement of igneous bodies: A review.
Tectonophysics 500, 11–19.
Michel, J., Baumgartner, L.P., Putlitz, B., Schaltegger, U., Ovtcharova, M., 2008. Incremental growth
of the Patagonian Torres del Paine laccolith over 90 k.y. Geology 36, 459–462.
https://doi.org/10:1130/G25546A.1
Miller, C.F., Furbish, D.J., Walker, B.A., Clairborne, L.L., Koteas, G.C., Bleick, H.A., Miller, J.S., 2011.
Growth of plutons by incremental emplacement of sheets in crystal-rich host: Evidence from
Miocene intrusions of the Colorado River Region, Nevada, USA. Tectonophysics 500, 65-77.
Miller, R.B., Paterson, S.R., 1999. In defense of magmatic diapirs. Journal of Structural Geology 21,
1161–1173.
Molyneux, S.J., Hutton, D.H.W., 2000. Evidence for significant granite space creation by the
ballooning mechanism: The example of the Ardara pluton, Ireland. GSA Bulletin 112, 1543–
1558. https://doi.org/10.1130/0016-7606(2000)112<1543:EFSGSC>2.0.CO;2
Myers, J.S., 1975. Cauldron Subsidence and Fluidization: Mechanisms of Intrusion of the Coastal
Batholith of Peru into Its Own Volcanic Ejecta. GSA Bulletin 86, 1209–1220.
https://doi.org/10.1130/0016-7606(1975)86<1209:CSAFMO>2.0.CO;2
Newman, S., Lowenstern, J.B., 2002. VOLATILECALC: a silicate melt-H2O-CO2 solution model written
23
Oppenheimer, J., Rust, A.C., Cashman, K.V., Sandnes, B., 2015. Gas migration regimes and outgassing
in particle-rich suspensions. Front. Phys. 3. https://doi.org/10.3389/fphy.2015.00060
Parks, M.M., Biggs, J., England, P., Mather, T.A., Nomikou, P., Palamartchouk, K., Papanikolaou, X.,
Paradissis, D., Parsons, B., Pyle, D.M., Raptakis, C., Zacharis, V., 2012. Evolution of Santorini
Volcano dominated by episodic and rapid fluxes of melt from depth. Nature Geosci 5, 749–
754.
http://www.nature.com/ngeo/journal/v5/n10/abs/ngeo1562.html#supplementary-information
Parmigiani, A., Degruyter, W., Leclaire, S., Huber, C., Bachmann, O., 2017. The mechanics of shallow
magma reservoir outgassing. Geochem. Geophys. Geosyst. 18, 2887–2905.
https://doi.org/10.1002/2017GC006912
Parmigiani, A., Faroughi, S., Huber, C., Bachmann, O., Su, Y., 2016. Bubble accumulation and its role
in the evolution of magma reservoirs in the upper crust. Nature 532, 492–495.
https://doi.org/10.1038/nature17401
http://www.nature.com/nature/journal/v532/n7600/abs/nature17401.html#supplementary
-information
Richards, J.P., 2011. Magmatic to hydrothermal metal fluxes in convergent and collided margins. Ore
Geology Reviews 40, 1–26. http://dx.doi.org/10.1016/j.oregeorev.2011.05.006
Rubin, A.E., Cooper, K.M., Till, C.B., Kent, A.J.R., Costa, F., Bose, M., Gravley, D., Deering, C., Cole, J.,
2017. Rapid cooling and cold storage in a silicic magma reservoir recorded in individual
crystals. Science 356, 1154–1156. https://doi.org/10.1126/science.aam8720
Schöpa, A., Annen, C., Dilles, J.H., Sparks, R.S.J., Blundy, J.D., 2017. Magma Emplacement Rates and
Porphyry Copper Deposits: Thermal Modelling of the Yerington Batholith, Nevada, USA.
Economic Geology 112, 1653–1672.
Sliwinski, J., Farsky, D., Lipman, P.W., Guillong, M., Bachmann, O., 2019. Rapid Magma Generation or
24
Mountain Tuffs, CO, USA. Frontiers in Earth Science 7, 271.
https://doi.org/10.3929/ethz-b-000380665
Sparks, R.S.J., 1978. The dynamics of bubble formation and growth in magmas: A review and analysis.
Journal of Volcanology and Geothermal Research 3, 1–37.
https://doi.org/10.1016/0377-0273(78)90002-1
Tait, S., Jaupart, C., Vergniolle, S., 1989. Pressure gas content and eruption periodicity of a shallow,
crystallising magma chamber. Earth and Planetary Science Letters 92, 107–123.
Tramontano, S., Gualda, G.A.R., Ghiorso, M.S., 2017. Internal triggering of volcanic eruptions:
tracking overpressure regimes for giant magma bodies. Earth and Planetary Science Letters
472, 142–151. https://doi.org/10.1016/j.epsl.2017.05.014
Varas, G., Ramos, G., Géminard, J.-C., Vidal, V., 2015. Flow and fracture in water-saturated,
unconstrained granular beds. Front. Phys. 3. https://doi.org/10.3389/fphy.2015.00044
Vargas, C.A., Koulakov, I., Jaupart, C., Gladkov, V., Gomez, E., Khrepy, S.E., Al-Arifi, N., 2017.
Breathing of the Nevado del Ruiz volcano reservoir, Colombia, inferred from repeated
seismic tomography. Sci Rep 7, 1–6. https://doi.org/10.1038/srep46094
Wallace, P.J., 2001. Volcanic SO2 emissions and the abundance and distribution of exsolved gas in
magma bodies. Journal of Volcanology and Geothermal Research 108, 85–106.
https://doi.org/10.1016/S0377-0273(00)00279-1
Wallace, P.J., Gerlach, T.M., 1994. Magmatic Vapor Source for Sulfur Dioxide Released During
Volcanic Eruptions: Evidence from Mount Pinatubo. Science 265, 497.
https://doi.org/10.1126/science.265.5171.497
Weinberg, R.F., Hasalová, P., 2015. Water-fluxed melting of the continental crust: A review. Lithos
212–215, 158–188. https://doi.org/10.1016/j.lithos.2014.08.021
Whitney, J.A., 1988. The Origin of Granite - the Role and Source of Water in the Evolution of Granitic
25
Worster, M.G., Huppert, H.E., Sparks, R.S.J., 1990. Convection and Crystallization in Magma Cooled
from Above. Earth and Planetary Science Letters 101, 78–89.
Yoshinobu, A.S., Fowler, J., Paterson, S.R., Llambias, E., Tickyj, H., Sato, A.M., 2003. A view from the
roof: magmatic stoping in the shallow crust, Chita pluton, Argentina. Journal of Structural
Geology 25, 1037–1048.
Figure captions
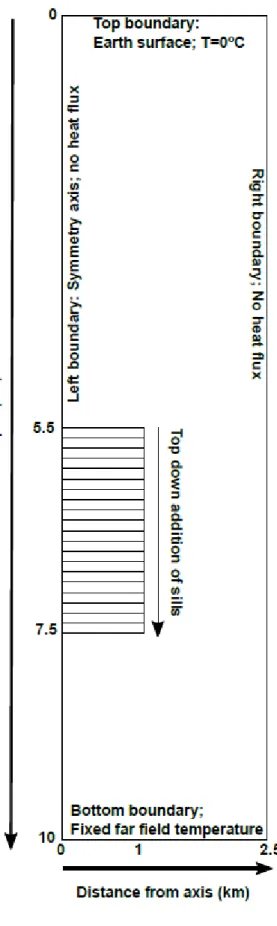
Figure 1: Model setup. The numerical half domain is a grid 10 km x 2.5 km with cells 25 m x 25 m. The
system is axisymmetric. The radius of the magma body is 1 km and its final thickness is 2 km.
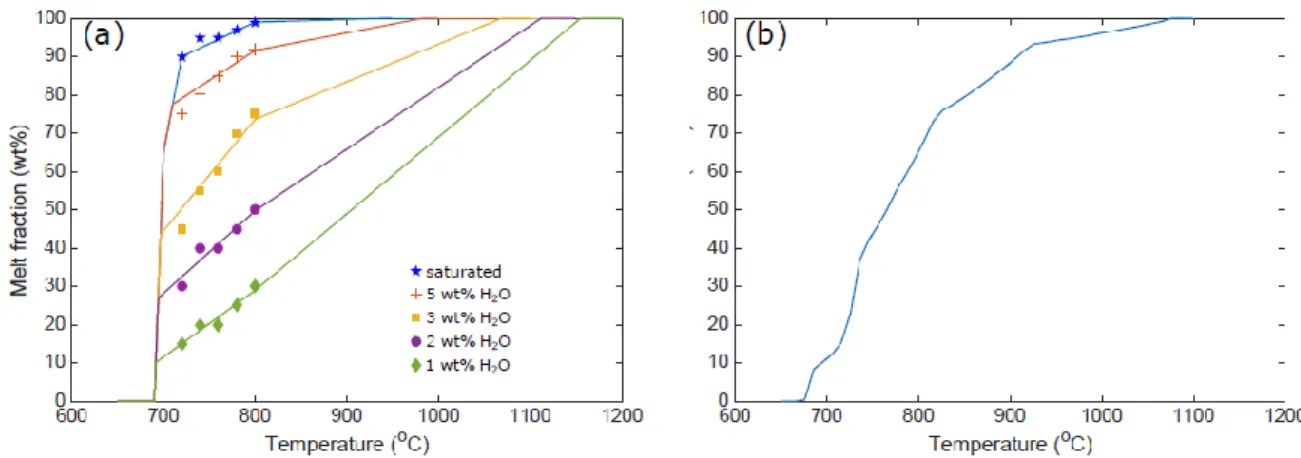
Figure 2: Relationships between melt fractions (wt%) and temperatures. (a) Cape Ann granite
composition (Whitney, 1988). The relationship varies with water content. The symbols show the
positions of experiment data points from Whitney(1988). (b) Mt. Capanne monzogranite composition
saturated with water (modified from Barboni et al., 2015).
Figure 3: Ascent velocity of gas bubbles as a function of crystal volume fraction. The velocity is
calculated with equations B4 to B7 in Parmigiani et al (2017). The bubbles radius is 50 m.
Figure 4: Snapshots of magma chamber formation and solidification. Upper row: Exsolved water
volume fraction; Lower row: crystal wt fraction relative to melt. 100-m sills are emplaced every 1000
yrs during 20,000 yrs. After 20,000 yrs, temperatures relax and the magma chamber contracts. The
composition is Cape Ann granite (Whitney, 1988) initially saturated in H2O.
26
Figure 6: Exsolved water in wt% at the end of simulations. The composition is Cape Ann granite
(Whitney, 1988) and was initially saturated with 6 wt% water. Half-domain cross sections are shown
on the left; vertical profiles of water contents close to the igneous body central axis are shown in the
middle; vertical profiles of water contents closer to the igneous body outer edge are shown on the
right. (a) (b) (c): The magma chamber was instantaneously emplaced. (d) (e) (f): 100-m sills were
emplaced every 1000 years. (g) (h) (i): 100-m sills were emplaced every 10,000 yrs.
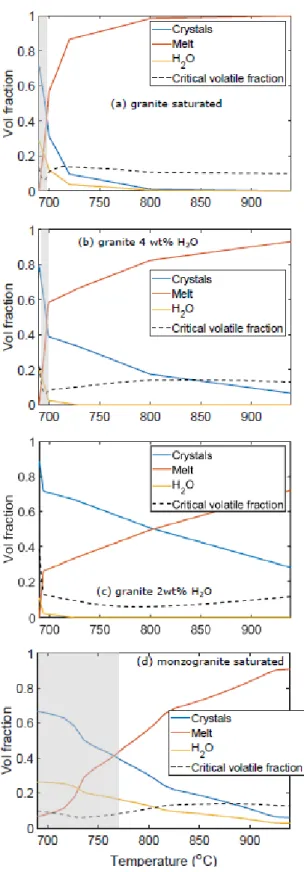
Figure 7: Proportions of crystals, melts, and exsolved volatiles before transport as a function of
temperature. (a) a saturated Cape Ann granite, (b) Cape Ann granite with 4 wt% H2O, (c) Cape Ann
granite with 2 wt% H2O, (d) a saturated Mt. Capanne monzogranite. The grey area shows the
temperature range over which transport through channels happens, i.e. where the volatile curve is
above the critical volatile fraction and the crystal fraction is between 0.4 and 0.7. No transport occurs
for the granite with 2 wt% H2O (c), because the proportion of exsolved volatiles never exceeds the
critical value.
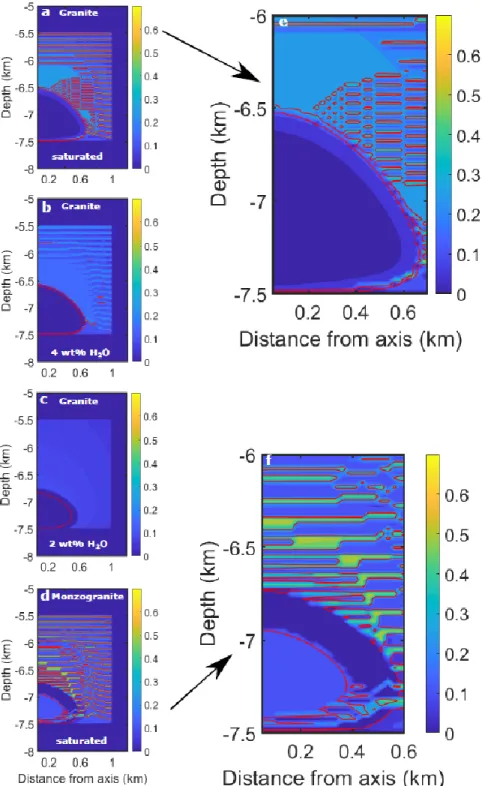
Figure 8: Snapshots of exsolved water volume fraction. In these simulations, 100-m sills were
emplaced every 1,000 yrs during 20,000 yrs. All snapshots are at time 22,000 yrs, i.e 2000 yrs after
the last sill emplacement. Results are shown for a Cape Ann granite composition that initially
contains (a) 6 wt% H2O, (b) 4 wt % H2O, (c) 2 wt% H2O, and (d) for the Mt. Capanne monzogranite
that initially contains 6 wt% H2O. The red lines on the snapshots show the 0.4 and 0.7 crystal volume
fraction isolines and delimit the areas where water in transported through channels. These areas are
very thin in (a) and (b). In (c), there is no magma with crystal fraction below 40 vol%. (e) and (f) are
27
Figure 9: Cumulated mass of exsolved water available as a function of time. We assume that the
volatiles in suspension as bubbles in the liquid magma are unavailable and are excluded from the
calculation. (a) Exsolved water for different emplacement rates and sills radii corresponding to
magma fluxes of 0.3 km3/yr for 1 km radius and 0.1 m/yr emplacement, 0.03 km3/yr for 1 km radius
and 0.01 m/yr emplacement, and 1.26 km3/yr for 2 km radius and 0.1 m/yr emplacement. The
composition is Cape Ann water-saturated granite. (b) Exsolved water for different compositions of
magma emplaced at the same rate of 0.01 m/yr and same sill radius of 1 km. The total and final mass
of water exsolved is shown by the horizontal dashed lines.
Figure 10: Effect of water loss on melt fractions. The colors show the difference in melt mass
fractions in wt% between a model that takes into account water loss and a model that neglects the
effect of water loss on the melting curves. The composition is water-saturated Cape Ann granite.
100-m sills were emplaced every 1000 yrs during 20,000 yrs. The snapshot is taken at time 22,000
28
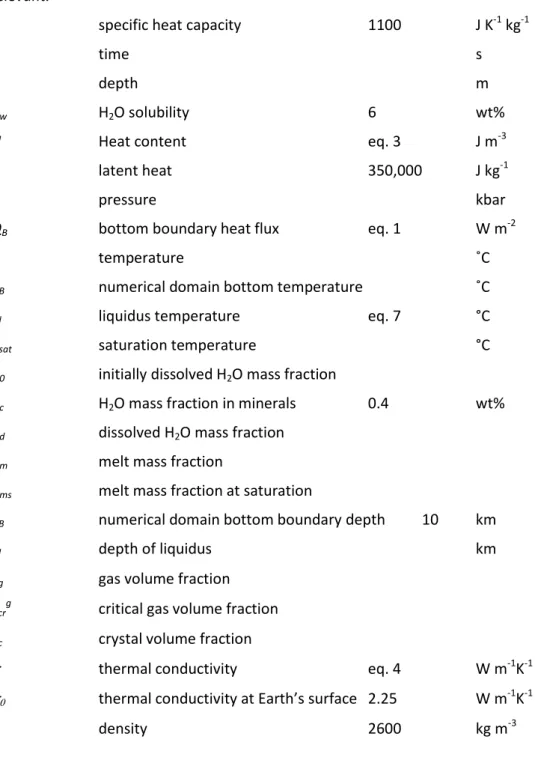
Table 1: list of symbols and units. Their value or the equation used to calculate them is given when relevant.
c specific heat capacity 1100 J K-1 kg-1
t time s
z depth m
Cw H2O solubility 6 wt%
H Heat content eq. 3 J m-3
L latent heat 350,000 J kg-1
P pressure kbar
QB bottom boundary heat flux eq. 1 W m-2
T temperature ˚C
TB numerical domain bottom temperature ˚C
Tl liquidus temperature eq. 7 °C
Tsat saturation temperature °C
X0 initially dissolved H2O mass fraction
Xc H2O mass fraction in minerals 0.4 wt%
Xd dissolved H2O mass fraction
Xm melt mass fraction
Xms melt mass fraction at saturation
ZB numerical domain bottom boundary depth 10 km
Zl depth of liquidus km
g gas volume fraction
crg critical gas volume fraction
c crystal volume fraction
thermal conductivity eq. 4 W m-1K-1
thermal conductivity at Earth’s surface 2.25 W m-1K-1
29
Figure 1: Model setup. The numerical half domain is a grid 10 km x 2.5 km with cells 25 m x 25 m. The system is axisymmetric. The radius of the magma body is 1 km and its final thickness is 2 km.
30
Figure 2: Relationships between melt fractions (wt%) and temperatures. (a) Cape Ann granite composition (Whitney, 1988). The relationship varies with water content. The symbols show the positions of experiment data points from Whitney (1988). (b) Mt. Capanne monzogranite composition saturated with water (modified from Barboni et al., 2015).
31
32
Figure 4: Snapshots of magma chamber formation and solidification. Upper row: Exsolved water volume fraction; Lower row: crystal wt fraction relative to melt. 100-m sills are emplaced every 1000 yrs during 20,000 yrs. After 20,000 yrs, temperatures relax and the magma chamber contracts. The composition is Cape Ann granite (Whitney, 1988) initially saturated in H2O.
33
34
Figure 6: Exsolved water in wt% at the end of simulations. The composition is Cape Ann granite (Whitney, 1988) and was initially saturated with 6 wt% water. Half-domain cross sections are shown on the left; vertical profiles of water contents close to the igneous body central axis are shown in the middle; vertical profiles of water contents closer to the igneous body outer edge are shown on the right. (a) (b) (c): The magma chamber was instantaneously emplaced. (d) (e) (f): 100-m sills were emplaced every 1000 years. (g) (h) (i): 100-m sills were emplaced every 10,000 yrs.
35
Figure 7: Proportions of crystals, melts, and exsolved volatiles before transport as a function of temperature. (a) a saturated Cape Ann granite, (b) Cape Ann granite with 4 wt% H2O, (c) Cape Ann granite with 2 wt% H2O, (d) a saturated Mte Capanne monzogranite. The grey area shows the
temperature range over which transport through channels happens, i.e. where the volatile curve is above the critical volatile fraction and the crystal fraction is between 0.4 and 0.7. No transport occurs for the granite with 2 wt% H2O (c), because the proportion of exsolved volatiles never exceeds the
36
Figure 8: Snapshots of exsolved water volume fraction. In these simulations, 100-m sills were emplaced every 1,000 yrs during 20,000 yrs. All snapshots are at time 22,000 yrs, i.e 2000 yrs after the last sill emplacement. Results are shown for a Cape Ann granite composition that initially contains (a) 6 wt% H2O, (b) 4 wt % H2O, (c) 2 wt% H2O, and (d) for the Mt. Capanne monzogranite that initially contains 6 wt% H2O. The red lines on the snapshots show the 0.4 and 0.7 crystal volume
fraction isolines and delimit the areas where water in transported through channels. These areas are very thin in (a) and (b). In (c), there is no magma with crystal fraction below 40 vol%. (e) and (f) are enlargement of (a) and (d), respectively.
37
Figure 9: Cumulated mass of exsolved water available as a function of time. We assume that the volatiles in suspension as bubbles in the liquid magma are unavailable and are excluded from the calculation. (a) Exsolved water for different emplacement rates and sills radii corresponding to magma fluxes of 0.3 km3/yr for 1 km radius and 0.1 m/yr emplacement, 0.03 km3/yr for 1 km radius and 0.01 m/yr emplacement, and 1.26 km3/yr for 2 km radius and 0.1 m/yr emplacement. The composition is Cape Ann water-saturated granite. (b) Exsolved water for different compositions of magma emplaced at the same rate of 0.01 m/yr and same sill radius of 1 km. The total and final mass of water exsolved is shown by the horizontal dashed lines.
38
Figure 10: Effect of water loss on melt fractions. The colors show the difference in melt mass fractions in wt% between a model that takes into account water loss and a model that neglects the effect of water loss on the melting curves. The composition is water-saturated Cape Ann granite. 100-m sills were emplaced every 1000 yrs during 20,000 yrs. The snapshot is taken at time 22,000 yrs, which is 2000 yrs after the last sill emplacement.