HAL Id: hal-00564085
https://hal.archives-ouvertes.fr/hal-00564085
Submitted on 8 Feb 2011HAL is a multi-disciplinary open access archive for the deposit and dissemination of sci-entific research documents, whether they are pub-lished or not. The documents may come from teaching and research institutions in France or abroad, or from public or private research centers.
L’archive ouverte pluridisciplinaire HAL, est destinée au dépôt et à la diffusion de documents scientifiques de niveau recherche, publiés ou non, émanant des établissements d’enseignement et de recherche français ou étrangers, des laboratoires publics ou privés.
Fractal analysis of vascular networks: Insights from
morphogenesis
Sylvie Lorthois, Francis Cassot
To cite this version:
Sylvie Lorthois, Francis Cassot. Fractal analysis of vascular networks: Insights from morphogenesis. Journal of Theoretical Biology, Elsevier, 2010, 262 (4), pp.614. �10.1016/j.jtbi.2009.10.037�. �hal-00564085�
www.elsevier.com/locate/yjtbi
Author’s Accepted Manuscript
Fractal analysis of vascular networks: Insights from morphogenesis
Sylvie Lorthois, Francis Cassot
PII: S0022-5193(09)00526-8
DOI: doi:10.1016/j.jtbi.2009.10.037
Reference: YJTBI 5765
To appear in: Journal of Theoretical Biology
Received date: 16 March 2009
Revised date: 20 October 2009
Accepted date: 29 October 2009
Cite this article as: Sylvie Lorthois and Francis Cassot, Fractal analysis of vascular networks: Insights from morphogenesis, Journal of Theoretical Biology,
doi:10.1016/j.jtbi.2009.10.037
This is a PDF file of an unedited manuscript that has been accepted for publication. As a service to our customers we are providing this early version of the manuscript. The manuscript will undergo copyediting, typesetting, and review of the resulting galley proof before it is published in its final citable form. Please note that during the production process errors may be discovered which could affect the content, and all legal disclaimers that apply to the journal pertain.
Accepted manuscript
Fractal analysis of vascular networks: insights
from morphogenesis.
Sylvie Lorthois1,* and Francis Cassot2
1 Institut de Mécanique des Fluides de Toulouse, UMR CNRS/INPT/UPS 5502, Allée du
Professeur Camille Soula, 31400 Toulouse Cedex, France.
2 INSERM U825 “Imagerie Cérébrale et Handicaps Neurologiques”, CHU Purpan, Service de
Neurologie, 31059 Toulouse Cedex 3, France.
To whom correspondence should be addressed: [email protected]
Keywords : Vascular Morphogenesis ; Microcirculation and flow through tissues ; Brain ; Fractals ; Cancer
Abstract (299 words):
Considering their extremely complicated and hierarchical structure, a long standing question in vascular physio-pathology is how to characterize blood vessels patterns, including which parameters to use. Another question is how to define a pertinent taxonomy, with applications to normal development and to diagnosis and/or staging of diseases.
To address these issues, fractal analysis has been applied by previous investigators to a large variety of healthy or pathologic vascular networks whose fractal dimensions have been sought. A review of the results obtained on healthy vascular networks first shows that no consensus has emerged about whether normal networks must be considered as fractals or not. Based on a review of previous theoretical work on vascular morphogenesis, we argue that these divergences are the signature of a two-step morphogenesis process, where vascular networks form via progressive penetration of arterial and venous quasi-fractal arborescences into a pre-existing homogeneous capillary mesh. Adopting this perspective, we study the multi-scale behavior of generic patterns (model structures constructed as the superposition of homogeneous meshes and quasi-fractal trees) and of healthy intracortical networks in order to determine the artifactual and true components of their multi-scale behavior. We demonstrate that, at least in the brain, healthy vascular structures are a superposition of two components: at low scale, a mesh-like capillary component which becomes homogeneous and space-filling over a cut-off length of order of its characteristic length; at larger scale, quasi-fractal branched (tree-like) structures. Such complex structures are consistent with all previous studies on the multi-scale behavior of vascular structures at different scales, resolving the apparent contradiction about their fractal nature.
Consequences regarding the way fractal analysis of vascular networks should be conducted to provide meaningful results are presented. Finally, consequences for vascular morphogenesis or hemodynamics are discussed, as well as implications in case of pathological conditions, such as cancer.
Accepted manuscript
1. INTRODUCTIONThe main function of the blood vascular system in higher vertebrates is to transport oxygen and nutrients to every cell in the peripheral tissue. For that purpose, the vascular system is comprised of three distinct compartments:
- the arteries, which carry blood away from the heart through a divergent arborescence;
- the capillaries, where oxygen and nutrient delivery from blood to tissues, as well as metabolic waste removal, occur and which have therefore to supply the entire volume of the organism;
- the veins, which carry blood back to the heart through a convergent arborescence. Functionally, these compartments are organized in series: blood flow proceeds from the upstream arteries to the downstream veins through the capillaries. However, their spatial organization is much more complex. First, arterial and venous trees are hierarchical branching structures covering a wide range of diameter scales, from centimeters at heart level to tens of micrometers at their micro-vascular (arteriolar or veinular) extremities. Second, arterial and venous trees interdigitate, with numerous veins observed paralleling the arteries at various scales. Third, despite their close proximity in space, arterial and venous trees are not directly connected to each other, except in pathological situations. Instead, they are connected by their micro-vascular extremities through the capillary network, the smallest vessels of 4-10 µm diameters. This part of the vascular network, composed of arterioles, veinules and capillaries, is embedded within the organ supplied and is called microcirculation. Fourth, there is a marked variability of vascular patterns among organs. Finally, many pathological conditions, such as atherosclerosis, cancers, arteriovenous malformations, infections, stroke, hypertension, diabetes, obesity and Alzheimer's disease, as well as normal aging, induce changes to vessels’ morphology or spatial organization.
Owing to their extremely complicated and hierarchical structure, a long standing question in vascular physio-pathology is how to characterize blood vessel patterns, including which relevant parameters to use for that purpose. A subsequent question is how to define a pertinent taxonomy, with applications to normal growth and development and to diagnosis and/or staging of diseases. A further non-resolved problem is to understand how such complex structures can morphologically evolve and how the design and function cross-talk during development to create the adult vascular architecture.
To address these issues, fractal analysis has been applied to a large variety of healthy or pathologic vascular networks whose fractal dimensions (df) have been sought (Gazit et al.
1995, Panico & Sterling 1995, Sandau & Kurz 1997, Kirchner et al. 1996, Wilting et al. 1996, Vico et al. 1998, Parsons-Wingerter et al. 1998, Bergman & Ullberg 1998, Baish & Jain 2000, Herman et al 2001, Arlt 2003, Masters 2004, Gaudio et al. 2005, Cassot et al. 2006, Risser et al. 2007). However, from these previous studies, no consensus has emerged about whether normal vascular networks must be considered as fractals (at least within a limited range of scales, i.e. quasi-fractals1) or not. One of the most recent studies (Risser et al. 2007), performed on very large three-dimensional (3D) datasets of healthy (primate and rat) intra-cortical networks imaged at high resolution, even suggested that their nature is dependent on scale, vascular structures being fractal at small scale and homogeneous at large scale. These discrepancies shed doubt on the potential of fractal analysis as a quantitative staging/diagnosis
1 Here, the term quasi-fractal denotes an object that shows power-law scaling over a finite range of scales,
Accepted manuscript
tool and induce confusion on the spatial organization and relevant scales of healthy vascular structures. In turn, this confusion impairs our understanding of normal angiogenesis, because several scenarios of vascular development are invalidated or, on the contrary, confirmed, depending on the real structure of vascular networks. In addition, the relevant approach for modeling blood flows and oxygen transfers is highly dependent on the underlying vascular architecture.The aim of the present paper is to clarify both the spatial organization and scales of healthy vascular structures and the potential of fractal analysis in this context by a careful mathematical analysis of the significance of fractal dimension estimation in biological vascular patterns. Our hypothesis is that, aside from methodological problems (see Hamburger et al. 1996, Halley et al. (2004) and Russ (1994)), the lack of consensus on the fractal nature of healthy vascular structures is rooted in their morphogenesis, which proceeds in two successive steps, as described in a series of theoretical papers (Fleury & Schwartz 1999, 2000, Nguyen et al. 2006). Indeed, according to these authors, vascular networks form via progressive penetration of arterial and venous arborescences into a previously formed capillary mesh, by means of a laplacian growth mechanism of hemodynamical origin, suggesting that mature vascular structure should be the union of quasi-fractal trees and of a homogeneous capillary mesh.
Adopting this perspective, the multi-scale behavior of two-dimensional (2D) generic patterns constructed as the union of quasi-fractal trees and homogeneous meshes is studied, demonstrating some unexpected features due to effects of finite spatial scales and effects of structure superposition. The same study is also performed for healthy human intra-cortical networks (Cassot et al. 2006). However, determining artifactual and true components of the multi-scale behavior of such complex (generic and “real-life biological”) structures necessitate performing a large number of meticulous tests, leading to a long and somehow tedious inspection of the results obtained by various multi-scale tools. Thus, this technical part (methods and original results) is presented in Appendix A.
This paper is organized as follows. In Section 2, the results obtained by fractal analysis of healthy vascular networks by previous investigators are reviewed. In Section 3, an overview of the morphological development of the vascular system is followed by a review of existing vascular branching morphogenesis theoretical models and their predictions regarding the mature vascular architecture. In Section 4, based on these theoretical predictions, 2D well controlled generic patterns are generated by numerical simulation and the conclusions emerging from the study of their multi-scale behavior (as detailed in Appendix A, Section A1) are summarized. Section 5 is focused on the multi-scale behavior of healthy intra-cortical networks, with additional details available in Appendix A, Section A2. In Section 6, the previous results are discussed and a unifying view of the structure of healthy vascular networks is proposed. Methodological recommendations regarding the way fractal analysis of vascular networks should be conducted in order to provide meaningful results are presented. Finally, consequences regarding vascular morphogenesis or hemodynamics are discussed, as well as implications in case of pathological conditions.
2. FRACTAL ANALYSIS OF HEALTHY VASCULAR NETWORKS: A REVIEW Strictly speaking, biological specimens cannot be considered as fractals. Indeed, a true random fractal must exhibit statistical scale-invariance over an infinity of length scales.
Accepted manuscript
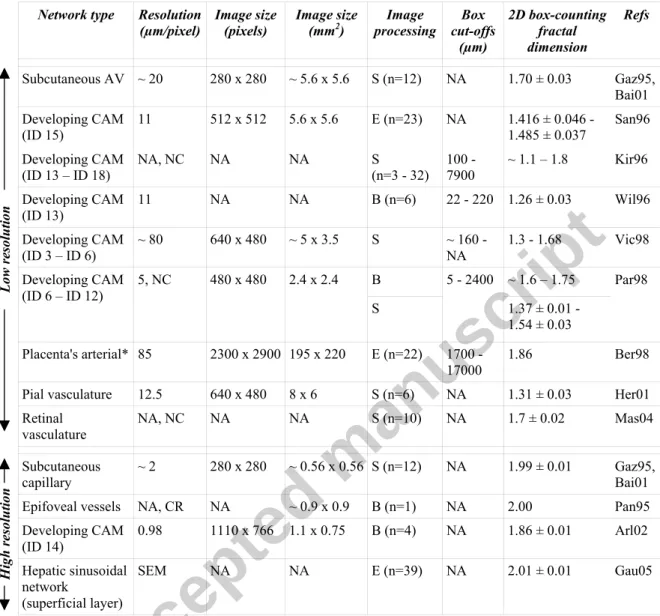
However, the size of the elementary constituents of a biological system (cells) is not very different, in orders of magnitudes, from the size of a complete organ or organism. Therefore, a biological system can at best be a quasi-fractal, i.e. exhibit scale invariance within a limited scale range. In addition, beside these intrinsic scales limitations, it is technically very challenging to collect morphometric data on sufficiently large volumes of tissue at high resolution (Cassot et al. 2006, Heinzer et al. 2006, Risser et al. 2007). Therefore, almost every previous study of the scale-invariant properties of healthy vascular networks is either limited to the microvascular end of the vascular network (Gazit et al. 1995, Panico & Sterling 1995, Arlt 2003, Gaudio et al. 2005) or to its arterial and/or venous arborescences (Gazit et al. 1995, Sandau & Kurz 1997, Kirchner et al. 1996, Wilting et al. 1996, Vico et al. 1998, Parsons-Wingerter et al. 1998, Bergman & Ullberg 1998, Herman et al 2001, Masters 2004). In the latter studies, the spatial resolution is not sufficient to resolve the capillary vessels, which is evident while looking at typical images of the vascular networks used for such fractal analysis. For example, in Fig. 1(a) of Gazit et al. (1995), the arterial and venous trees suddenly stop after a few branching orders, without any connections between them; whereas in reality, numerous capillaries, such as those displayed in Fig. 1(b) of the same reference, must be present to establish a connection. Consequently, it is not surprising that the fractal dimensions (evaluated either by the box-counting, the sand-box algorithms, or by spectral approaches, see Appendix A, Section A1) are different in these two categories of studies. For a synthetic summary of the 2D box-counting results, see Table 1.However, despite the dispersion of the results, some meaningful tendencies can be noted. First, all types of quasi-2D vascular networks have been found to be quasi-fractals when observed at low resolution (i.e. without resolved capillaries), see Table 1, upper part. Second, the fractal dimension is higher at high resolution (see Table 1, lower part). Moreover, in three of the four studies focusing on the microcirculatory network, a homogeneous (non-fractal) behavior (df=2) has been obtained (Gazit et al. 1995, Panico and Sterling 1995, Baish
and Jain 2001). An identical result has been obtained for the brain microvascular vessels in 3D, which have been shown to become volume filling (df=3) above a cut-off equals to 96 µm
(Cassot et al. 2006). From this point of view, the fractal dimension of 1.86 obtained by Arlt et al. (2002) in the developing CAM is surprising. However, the cut-offs used for obtaining this result are not available, leaving open the possibility of a methodological bias because any estimate of df critically depends on the spatial scales used, especially the lower and upper
cut-offs (Berntson and Stoll 1997).
The quasi-fractal nature of 2D vascular networks at low resolution (large scale) is consistent with studies performed on corrosion casts of diverse healthy 3D vascular systems (coronary (Kassab (2000) and references therein), pulmonary (Gan et al 1993, Jiang et al. 1994), hepatic (Hahn et al. 2003)). In these studies, the typical scale range spans from 50 µm to organ size and the fractal dimension is derived from the branching and length-order ratios in a variant of the “Horton-Strahler” ordering scheme (Turcotte et al. 1998), evidencing their quasi-fractal nature. An identical result has also been obtained in the brain arterio-venous network, using the same methodology (Cassot et al. 2006).
From these previous studies, it is thus tempting to conclude that vascular networks are quasi-fractal structures at large scale but are homogeneous at low scale, down to some cut-off length. This view is consistent with the usual description of vascular structures as the union of a “tree-like” distribution network and a “mesh-like” capillary network (West et al. 1999, Kassab 2000, Cassot et al. 2006). However, it is in complete contradiction with the conclusions of a recent study (Risser et al. 2007) performed on very large (tens of cubic
Accepted manuscript
millimeters) 3D datasets of healthy intra-cortical networks imaged by high resolution synchrotron tomography (voxel side: 1.4 µm). In this study, using several multi-scale methods, the authors stated ambition is to “give a new coherent picture of normal andpathological complex vascular structure” and to “resolve the apparent contradiction of
previous studies for which normal vascular networks have been found to be either fractal or not”. Their analyses indicate that normal cortical vascular networks have scale-invariant fractal properties on small scale from 1.4 µm up to 40 ~ 65 µm and that, above this threshold, vascular networks can be considered as homogeneous. They further define the length scale for which the transition between fractal to non-fractal occurs as being the Representative Elementary Volume (REV) of the vascular structure, in the usual sense given in the porous media literature2 (Bear 1972).
These results are all the more disconcerting that the methodology used by the authors is very meticulous. The use of very large datasets for the fractal analysis (performed by the box-counting and by the sand box algorithms) leads to clearcut linear trends with very small error bars in the estimated fractal dimensions and cut-offs. The results are confirmed by a complementary analysis of the power spectrum of the avascular space. Thus, to the best of our knowledge, these authors present the first complete study of the multi-scale behavior of a complete 3D vascular network (including arteries, veins and capillaries) at high resolution over three decades of scales. However, we believe that their interpretation of the data is incorrect. Indeed, relying on a series of theoretical papers about vascular morphogenesis (Fleury & Schwartz 1999, 2000, Nguyen et al. 2006), we will construct simple examples demonstrating that the usual multi-scale tools can lead to counter-intuitive results when the structures under study are not true fractals. For that purpose, the main features of vascular morphogenesis are first introduced.
3. VASCULAR BRANCHING MORPHOGENESIS: PREDICTIONS REGARDING THE MATURE VASCULAR ARCHITECTURE
In this Section, after an overview of the morphological development of the vascular system, models of vascular branching morphogenesis will be reviewed, as well as their predictions regarding the mature vascular architecture.
It is first noteworthy that models of branched growth in biology must provide a reasonable phylogeny (Fleury 2000, Fleury & Schwartz 2001), i.e. be compatible with their emergence during the evolutionary history of species, as well as a realistic ontogeny (Murray 1995), i.e. be based on the real biological situation and try to isolate the key steps of the growth process. Indeed, although one of the recurrent ideas behind the study of the multi-scale behavior of vascular networks is that it is potentially useful in revealing the physical mechanisms underlying their morphogenesis (Gazit et al. 1995, Bergman & Ullberg 1998, Baish & Jain 2000, Masters 2004, Cassot et al. 2006), several authors warn that two branching patterns with the same fractal dimension have not necessarily been formed by the same class of fundamental processes (Vico et al. 1998, Murray 1995, Meakin et al. 2001, Fleury & Schwartz 2001). In case of vascular morphogenesis, models must thus be consistent with the morphogenetic events and dynamics known to be involved in the formation of new vascular structures.
Accepted manuscript
Schematically, the growth of a mature vascular structure begins by the formation of a network of interconnected capillaries, called a capillary plexus, which can develop by two distinct mechanisms, vasculogenesis and angiogenesis (Risau 1997, Patan 2000). The termvasculogenesis denotes the process by which randomly distributed precursor cells coalesce to form a network of interconnected capillary tubes. The term angiogenesis is the process by which capillary vessels are forming from pre-existing ones, which emit sprouts (sprouting) or are split into two distinct vessels along their axis (intussusception). Vasculogenesis is typically observed in early phases of embryogenesis, where the first capillary plexi form before the onset of plasma or blood perfusion. It is also responsible for the vascularization of organs appearing later, such as the lung and spleen. After onset of perfusion, angiogenesis allows the expansion of previously formed capillary plexi as well as the vascularization of so far avascular regions, such as the brain. Mathematical models of vasculogenesis (see Tosin et al. 2006 and references therein), angiogenesis (see Mantzaris et al. 2004, Plank & Sleeman 2004, Codling et al. 2008 and references therein) or both (Merks et al., 2008) have been proposed but their description is beyond the scope of this paper, which focuses on the later stages.
These newly formed vascular plexi are rapidly remodeled into structures resembling the mature branching pattern. To a large extent, this remodeling is linked to hemodynamics, such that non-perfused capillaries regress whereas vessels undergoing a large flow are likely to enlarge (Risau 1997, le Noble et al. 2004). It begins as soon as blood circulation is established in a given organ (either because the onset of heart beat or because individual capillary sprouts join to form a connected network (Patan 2000)). In chick embryos, when blood circulation fails to establish, e.g. after heart removal, capillary plexi fail to remodel, although continuing to grow for several days (le Noble et al. 2004). Furthermore, manipulation of blood flow, for example by ligation of an artery, dramatically affects the final vascular pattern (Nguyen et al. 2006, le Noble et al. 2004).
Thus, the formation of the mature vascular system occurs by progressive selection of small capillaries from a previously formed capillary network, so that every large vessel in the hierarchical branching vasculature was once a vessel of the smallest size (Risau et al. 1997).
To our knowledge, only few models (Honda & Yoshizato 1997, Gödde & Kurz 2001, Fleury & Schwartz 1999, 2000, Nguyen et al. 2006) account for this fundamental feature. However, Honda & Yoshizato (1997) do not reproduce the interdigitation of arterial and venous arborescences, whereas Gödde & Kurz (2001), while producing interdigitating vascular patterns, begin with an initial stochastic capillary growth phase which ends “as soon as supplying and draining vessel structures approach each other”. In other words, in their model, there is no intrinsic mechanism to avoid the direct shunting between arterial sources and venous sinks. Yet, such a mechanism has been recently elucidated: as they grow, arterial vessels progressively disconnect from the surrounding capillaries. This disconnection progressively moves the arterial sources for the blood entering the capillary plexus toward the distal end of the arterial arborescence and avoids direct proximal shunting. This mechanism has been confirmed by experiments on the developing chicken yolk-sac (le Noble et al. 2004) after having been suggested by Fleury and Schwartz (1999) in a simple model of shear-dependent progressive selection of vessels from a previously formed capillary mesh in a laplacian pressure field. For convenience, this simple model has been implemented using classical concepts of statistical physics in which the Laplace equation is approximately solved by performing statistics over the pathways followed by a large number of fictitious random walkers (Courant et al. 1928, Zwillinger 1998). Of course, this methodological trick does not
Accepted manuscript
imply that endothelial cells do walk around until they randomly encounter an existing artery during vascular morphogenesis. For the reader unfamiliar with such statistical methods, a simple illustration is presented in the Appendix B: the Poiseuille flow of a Newtonian fluid in a straight tube, where diffusion is negligible compared to convection and where, as a consequence, fluid particles do not physically behave as random walkers, is solved using fictitious random walkers. The initial approach proposed by Fleury and Schwartz (1999) as well as the progressive improvements introduced in Fleury and Schwartz (2000) and Nguyen et al. (2006) are summarized below, while the justification for using Diffusion Limited Aggregation (DLA) (Witten & Sander 1983) as a tool for progressively selecting the capillaries which become arteries or veins is summarized in Appendix C.− Step 1: Initial conditions: a regular lattice of capillaries must first be provided and the
positions of arterial sources and venous sinks, representative of the arterial and venous rudiments allowing the blood circulation to establish in a given organ, must be prescribed. These sources and sinks can have a discrete or a continuous spatial distribution.
− Step 2: Growth of the arterial tree: random walkers are iteratively launched from the
venous rudiments and grow the arterial tree by DLA. In the DLA original version, a seed particle is fixed at the origin of the coordinate system. Random walkers are iteratively launched at a large distance from the seed and wander randomly over the capillary lattice, until they escape at large distance or they contact the aggregate (i.e.
the seed at first iteration), to which they stick irreversibly. Here, the seeds for the growing aggregates are the arterial rudiments.
− Step 3: Arterial disconnection: the first particles having attached to the arterial
aggregate are disconnected from the capillary lattice, such that only a given percentage of the aggregated particles remain active for further growth.
− Step 4: Growth of the venous tree: random walkers are launched from the arterial
extremities (i.e. the active part of the arterial aggregate) to grow the venous tree by DLA. The seeds for the growing venous aggregate are the venous rudiments.
− Step 5:Effect of tissue growth: effect of tissue growth has been introduced in Nguyen
et al. (2006) but is beyond the scope of this paper.
To our knowledge, this model of vascular morphogenesis is the only model allowing the self-organized generation of realistic vasculatures as well as the prediction of the consequences of localized alterations of blood flow on the arterio-venous global patterning (see Nguyen et al. (2006) where this model is used to generate the entire yolk-sac vasculature, and to predict the effect of an arterial occlusion on its development). It is also the only model allowing a self-consistent description of the connectivity and spatial relationships between arteries, veins and capillaries (Al-Kilani et al. 2007). This model predicts that mature vascular architectures should be quasi-fractal at large scale (DLA trees modified by disconnection and tissue growth), connected by the extremities to a regular lattice of capillaries. Moreover, it predicts that the lower cut-off of the quasi-fractal DLA tree must corresponds to the characteristic length of the capillary lattice. Indeed, in this model, the size of the fictitious random walkers launched to construct the arterial and venous arborescences corresponds to the characteristic size of the capillary mesh, which defines the grid (and pixel) size.
Accepted manuscript
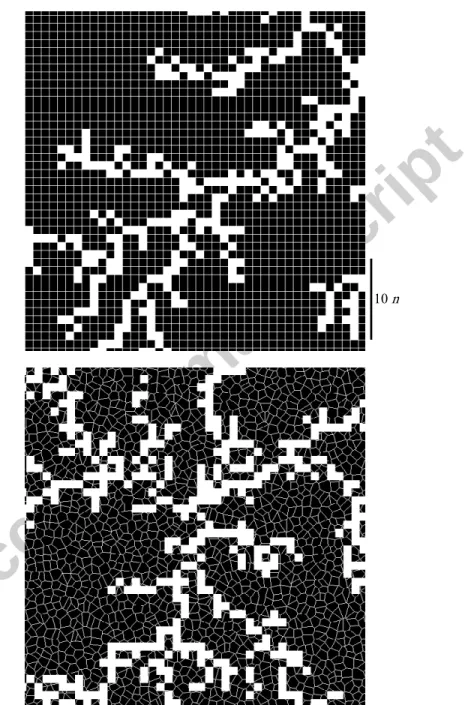
4. FRACTAL ANALYSIS OF GENERIC PATTERNSIn this Section, the multi-scale behavior of generic patterns, constructed as the union of homogeneous meshes and quasi-fractal resampled DLA-type trees (see Fig. 1), is studied. Such a rough model of vascular structure is obviously inspired from the architecture of mature vascular networks predicted by the models of vascular branching morphogenesis described in the previous Section. For control purposes, the multi-scale behavior of their two elementary components (homogeneous mesh and resampled DLA-type tree) is also studied. To this end, the same multi-scale tools as Risser et al. (2007), i.e. the box-counting and sand-box algorithms as well as a spectral approach, are used. These methods and the results obtained are presented in Appendix A, Section A1.
The main conclusion of Section A1 is that, when studied using various multi-scale tools implemented following Risser et al. (2007), the two kinds of generic patterns constructed in the present work (Fig. 1) artifactually appear to be fractal at low scale and homogeneous at large scale. Indeed, by construction (resampling, see Appendix A, Section A1(a)), a lower cut-off for self-similarity, corresponding to the characteristic length of the capillary lattice, has been imposed to the DLA trees, so that these generic patterns are not fractal at low scale. In addition, these generic patterns are neither homogeneous at large scale due to the presence of the quasi-fractal DLA trees.
Moreover, the results obtained when analyzing the multi-scale behavior of both kinds of generic patterns (Fig. 1) are similar to the results obtained by Risser et al. (2007) when analyzing large datasets of healthy vascular networks imaged at high spatial resolution (see Appendix A, Section A1.(d)). Consequently, based on Risser et al.’s results, it is impossible to conclude that vascular networks are fractal at low scale and homogeneous at large scale. Indeed, the generic patterns introduced in the present work are simple counter-examples: they appear to be, but they are not, fractal at low scale when studied by classic multi-scale tools (box-counting and sand box methods) and by a spectral approach; they are not homogeneous at large scale, due to the presence of the quasi fractals resampled DLA clusters, but they appear to be homogeneous at large scale because of the hindering effect due to the capillary lattice. In addition, the present work demonstrates that Risser et al.’s results can be consistent with the usual description of vascular structures as the union of a “tree-like” distribution network and a “mesh-like” capillary network. As a consequence, they also demonstrate that their results can be consistent with all the previous studies regarding the fractal analysis of healthy vascular structures (see Section 1).
Finally, following the present work, it is tempting to conclude that the cut-off scales, extracted by these authors using the box-counting, the sandbox and the spectral approach, do not correspond to the Representative Elementary Volume (REV) of the vascular structure, but rather give estimates of the characteristic length of the capillary lattice.
To test this hypothesis and to conclude on the nature of vascular networks, it is necessary to study in more detail the capillary lattice of real vascular structures. Indeed, the available data do not permit to decide whether their behavior at low scales (high frequencies) is truly self-similar or artifactual. That is why the following Section is devoted to the fractal analysis of the capillary lattice of healthy intra-cortical networks.
Accepted manuscript
5. FRACTAL ANALYSIS OF INTRA-CORTICAL NETWORKSIn order to progress in the characterization of vascular structures, we have focused on the capillary lattice of healthy human intra-cortical vascular networks (see Fig.2 and Appendix A, Section A2). Using the same multi-scale tools as previously, we have demonstrated that such capillary lattices are space filling over a cut-off length of order 25 to 75 µm, which also gives an estimate of the characteristic length of the capillary lattice. Furthermore, we have shown that the multi-scale tools used are not well-suited to settle on the nature (random or fractal) of the capillary lattice at lower scales, because it is difficult to discriminate between fractality and “apparent fractality originating from underlying
randomness” (Hamburger et al. 1996, Halley et al. 2004). For example, simple random
distributions, such as random distributions of discs at low concentration in 2D, display an apparent fractal behavior between a lower cut-off corresponding to the size of the discs and an upper cut-off which is approximately the average distance between them3 (Hamburger et al. 1996, Halley et al. 2004).
We have therefore introduced a complementary method, based on the analysis of the regional maxima of the distance map (Fig. 3), to discriminate between both hypotheses. Using this method, the random nature of healthy human intra-cortical capillary lattices has been demonstrated.
In addition, as demonstrated in Section A2.(c), capillary networks become volume-filling over a cut-off of the order of the characteristic size of the capillary mesh. In other words, healthy capillaries fills the available space completely down to this cut-off length and guarantees that no point in the tissue is, on average, further from some point of the vasculature than half of this cut-off. This provides an efficient way for feeding every cell in the interstitial space, the main function of the capillary network.
6. DISCUSSION AND CONCLUSIONS
All together, the present work demonstrates that, at least in the brain, healthy vascular structures are a superposition of two components, which interdigitate: at low scale, a mesh-like capillary component which becomes homogeneous and space-filling over a cut-off length of order of its characteristic length; at larger scale, branched (tree-like) structures which have been systematically demonstrated to be quasi-fractals by others when studied separately from the capillary component (Gazit et al. 1995, Sandau & Kurz 1997, Kirchner et al. 1996, Wilting et al. 1996, Vico et al. 1998, Parsons-Wingerter et al. 1998, Bergman & Ullberg 1998, Herman et al 2001, Masters 2004, Cassot et al. 2006, Kassab 2000, Gan et al. 1993, Jiang et al. 1994, Hahn et al. 2003). Because of the variety of vascular structures considered in these studies (subcutaneous, extra-embryonic, pial, retinal, coronary, pulmonary, hepatic, intra-cortical) and because the homogeneous nature of capillaries has also been demonstrated in various systems (subcutaneous (Gazit et al. 1995, Baish & Jain 2001), epifoveal (Panico &
3 Indeed, at very low scale (smaller than the diameter of the disks) as well as at very large scales (greater than the
typical distance between disks), two space-filling regimes are attained. Between these two regimes, there is a region of reconnection where a linear regime, with a different slope, can be observed, which is entirely an artifact and not caused by self similarity at all (Halley et al 2004). The same phenomenon is observed when studying homogeneous random networks of “thick” capillaries.
Accepted manuscript
Sterling 1995), hepatic (Gaudio et al. 2005)), this conclusion appears to be very general. It immediately implies two additional conclusions:- First, for the fractal analysis of a given vascular structure to make sense, its two components must be separated beforehand. If not, for scales greater than the characteristic length of the capillary lattice, the tree-like structures are masked. This separation if often de facto accomplished by the choice of the observation method. At low resolution, capillaries are automatically removed. At high resolution, due to the necessary compromise between size and resolution, the field of view is usually reduced, thus removing large branched structures. The only exception is when specific techniques are used to image large domains at high resolution (Cassot et al. 2006, Heinzer et al. 2006, Risser et al. 2007). In this case, the capillary lattice must be separated from the tree-like structures, for example by thresholding the vessels hydraulic resistance above a prescribed value (Lauwers et al. 2008). This methodological comment also holds if the vascular structure is intersected with a surface, as for example in histological studies. Indeed, even if in strict mathematical terms, intersecting a fractal object of dimension D with a plane produces a fractal intersection whose dimension is D-1 (Russ 1994), this principle can break down when the structure under study is not an ideal fractal (Halley et al. 2004), leading once again to counter-intuitive results. In addition, this comment must be accounted for if, instead of studying fractal properties, one seeks out the spatial relationships and/or correlations between the large scale (arterial or venous) structures (Al-Kilani et al. 2008).
- Second, taking into consideration these methodological aspects, the description of healthy vascular structures as a superposition of the two components described above is consistent with all the previous studies regarding the multi-scale behavior of vascular structures, briefly reviewed in Section 2. Thus, the present work proposes a unifying view of healthy vascular networks based on arguments related to vascular morphogenesis and should close the controversy regarding the fractal nature of healthy vascular structures.
It should be noted that such a unifying view is compatible with the dual function (distribution and exchange) of the vasculature. Indeed, based on allometric scaling arguments (West et al. 1999), a volume filling structure provides the most efficient way for feeding every cell in the interstitial space, the main function of the capillary network, whereas a fractal distribution network is consistent with the constraint that the time for supplying resources as well as the length of distribution pathways should be minimized. From a transport modeling perspective, this description implies that the complete vascular network can be viewed as the superposition of several coupled flow components:
− a slow homogeneous capillary component, for which the existence of a REV,
corresponding to the characteristic capillary length, has been evidenced, and can thus be viewed as a fictitious continuum characterized by effective properties (Bear 1972),
− fast arterial and venous fractal components, which cannot be homogenized because of
the absence of any specific length scale, i.e. the concept of REV becomes irrelevant. These fractal components can alternately be modeled using a discrete network approach.
Thus, even if it is clear that, from a geometrical perspective, the superposition of these two components remains space-filling at large scale, this complex structure cannot be considered homogeneous at large scale with regard to transport. In the same way, the existence of a homogeneous capillary structure does not imply that the blood flow is homogeneous in the capillaries, in contradiction with experimental measurements in mature micro-vascular beds
Accepted manuscript
(Pries et al. 1990). Indeed, it is well known that significant heterogeneities of the flow parameters (e.g. mean pore velocity) can be observed at mesoscopic level (scale of the REV) in homogeneous porous media, resulting from differences in pore size and connectivity. In particular, such heterogeneities can be found in space-filling homogeneous networks, for example in packed bed reactors, i.e. random distributions of spheres or parallel cylinders, even in case of slow flow (Georgiadis et al. 1996): although these structures become homogeneous and space filling above a length scale of the order of the typical distance between spheres or cylinders (Halley 2004, Hamburger 1994), they are still heterogeneous on smaller length scales, exhibiting a large distribution in pore sizes. This also holds for brain microvascular capillary networks, which exhibit a clear heterogeneity in capillary diameters and lengths (Cassot et al. 2006). In addition, in the case of capillary networks, the coupling with the feeding and draining fractal structures (heterogeneous sources and sinks) introduce an additional source of heterogeneity.The previous description of healthy vascular structures as a superposition of two components is also compatible with the current knowledge of normal vascular morphogenesis, as briefly reviewed in Section 3. Moreover, while the conclusions reached by Risser and al. (2007) are in complete contradiction with the mature vascular structure predicted by the most relevant theory on vascular morphogenesis (Fleury & Schwartz 1999, 2000, Nguyen et al. 2006), the present work constitutes strong support in favor of this theory. Indeed, as observed by Murray (1995) who warns about the abuse of multi-scale analysis in neuroscience, it is essential to “return to the biology with predictions, comments and suggestions for illuminating experiments” in order for a theory in this field to be validated. Here, the pitfalls of multi-scale analysis applied to complex experimental data have been understood based on a simple theoretical prediction.
However, it should also be noted that, at present, this conclusion cannot be generalized to pathological conditions. In particular, regarding cancer, the situation is probably more complex. Briefly, when studied at low resolution, tumor vasculatures (obtained by inoculation of various cancerous cell lines in mice bearing dorsal skinfold chambers) have been shown to be fractals, with fractal dimensions ranging approximately from 1.8 to 1.95 (Gazit et al. 1995, Baish & Jain 2000), significantly higher than that of healthy vasculatures. When studied at high resolution over large domains, tumor vasculatures obtained by injection of gliosarcoma cells in rat brains exhibited a complex behavior qualitatively similar to, but quantitatively significantly different from, the behavior of healthy vasculatures (Risser et al. 2007)4. From these results, in the same way as for healthy structures, Risser et al. conclude that tumor vasculatures are fractal at low scale but homogeneous at large scale. However, in the same way as for healthy structures, this conclusion is in contradiction with the previous studies of tumor vasculature performed at low resolution (Gazit et al. 1995, Baish & Jain 2000), which, as discussed above, uniquely focus on the large scale structures. Thus, tumor vasculatures are probably the superposition of several components, including fractal components at large scale. However, at low scale, a random homogeneous component must be ruled out, due to the great heterogeneity characteristic of tumors. In order to improve our understanding of their vascular architecture, further work performed over restricted regions imaged at high resolution should
4 Indeed, the box-counting and sand-box results exhibited two linear domains separated by a clear
cut-off. In all cases, above the cut-off, the slope was equal to 3. Below the cut-off, the slope was between 1.9 and 2.4, significantly higher than the slope at low scale obtained for healthy vasculatures. In addition, the cut-off length between these domains was significantly greater for tumors. The power spectrum also exhibited two domains, with a linear decrease at high frequencies and saturation at low frequencies. The cut-off length between these two domains was also significantly greater for tumors.
Accepted manuscript
be conduced. In addition, because the classification of blood vessels (between capillary and non capillary vessels) developed for normal tissues based on structure (anatomy) and function (physiology) may not be applicable to tumors (Gazit et al. 1995, Jain 1988), the relevant criteria for defining and separating these tumor vascular components are still to be found. For example, in tumors such as clear cell renal cell carcinoma, both differentiated and undifferentiated vessels (i.e. vessels made up of cells that have grown to the normal mature stage of development and vessels made up of cells that remain in an immature or “primitive” stage) coexist, which could serve as a basis for an alternative classification (Yao et al. 2007). Therefore, it seems to us that the studies aiming at determining a fractal dimension from 2D thin tissue sections of tumor tissues (for example Sabo et al. (2001), Weyn et al. (2004)) must be interpreted with great caution until these methodological issues are resolved. In particular, it is not surprising that the clinical significance of the “fractal dimension” deduced from these studies, as a prognostic indicator of patient survival, is still highly controversial (Sabo et al. 2001, Weyn et al. 2004, Grizzi et al. 2001, Sabo et Resnick 2001).In summary, the present work meticulously addresses the issues of spatial organization and scales in "real-world" biological structures, highlighting effects of finite spatial scales and effects of structure superposition. It could be of interest in a large number of biological branched structures, from lung to neurons, or non branched structures, such as bone, for which fractal analysis is an increasingly popular staging and/or diagnosis tool.
Accepted manuscript
APPENDICES
APPENDIX A : Technical analysis of complex generic patterns and “real-life” biological structures.
This appendix is devoted to the technical analysis of complex generic patterns (Section A1) and “real-life” biological structures (Section A2). In Section A1, the method for constructing bi-dimensional generic patterns as the union of homogeneous meshes and quasi-fractal DLA trees –imposing a lower cut-off corresponding to the characteristic length of the homogeneous meshes– will first be presented. Then, the multi-scale tools used, as well as the procedures used for their validation, will be described. Finally, the results obtained will be presented and compared to the results obtained by Risser et al. (2007) on very large datasets of healthy intra-cortical networks imaged at high resolution. In Section A2, the datasets used for the analysis of the capillary lattice of human healthy intra-cortical networks will first be presented. Then, the implementation in three-dimensions of the multi-scale tools presented in Section A1 will be described and validated. The results obtained will be subsequently presented. A new multi-scale tool, based on the computation of the regional maxima of the distance map, will then be introduced in order to conclude on the nature of the capillary lattice.
A1. FRACTAL ANALYSIS OF GENERIC PATTERNS (a) Construction of generic patterns
As argued in Section 3, in a rough approximation, mature vascular structures should be the union of homogeneous capillary meshes and DLA-type trees with a lower cut-off corresponding to the characteristic capillary length. In the whole following, binary structures constructed over 4096 x 4096 domains have been considered. The characteristic length of the capillary lattice, denoted by n, has been fixed to 16.
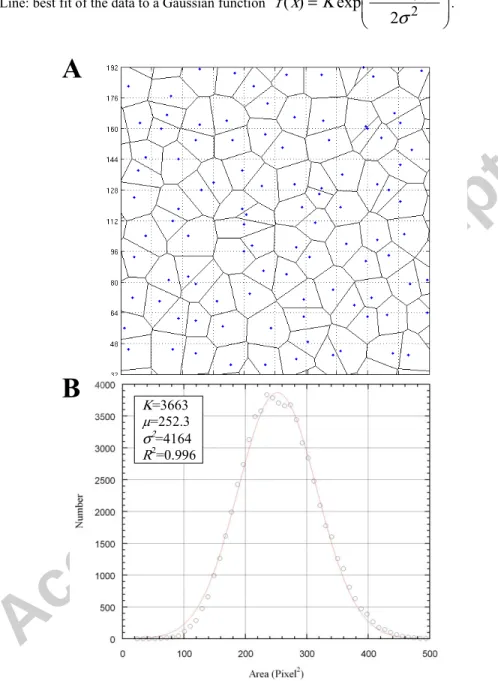
Two kinds of homogeneous meshes have been considered: n x n square grids and random networks exhibiting a Gaussian distribution of cells' areas. Such networks have been constructed by randomly choosing one point in every elements of a n x n square grid and by subsequently extracting the voronoi diagram of this random set of points (see Fig. A1(A)). In this way, a regular random network has been obtained, with a Gaussian probability distribution function of cell's areas approximately centered on n2 (see Fig. A1(B) and legend).
Indeed, for five realizations, the Gaussian's mean µ was found, by least squares regression, to be 252 ± 0.11 (mean ± sd) and its variance σ2 was found to be 4126 ± 24, with a coefficient of
determination R2 systematically greater than 0.996.
DLA trees have been generated using dla-nd, an off lattice DLA simulator freely available under the Gnu General Public License at http://markjstock.org/dla-nd/. First, in order to test the multi-scale tools described below, DLA clusters consisting of 500 000 particles have been generated (Fig. A2). However, for such DLA trees, the lower cut-off is equal to one pixel, corresponding to the size of the randomly moving particles. Thus, in order to generate quasi-fractals with a lower cut off equal to n, DLA clusters of 5000 particles have been generated over smaller domains (256 x 256) and subsequently resampled to a final size of 4096 x 4096 by dividing each pixel in n x n pixels areas5.
5 This procedure is equivalent to the construction of 5000 particles’ DLA clusters over 4096 x 4096 domains
Accepted manuscript
Generic patterns have been defined as the union of these quasi-fractals and of either kind of homogeneous meshes (see Fig. 1). By construction, as a lower cut-off for self-similarity has been imposed to the DLA trees, these generic patterns are not fractal at low scale. They are neither homogeneous at large scale due to the presence of the quasi-fractal DLA trees.(b) Multi-scale tools
The multi-scale tools used in the present work have been chosen following Risser et al. (2007) and have been implemented following the additional details available in Risser (2007). In particular, neither skeletonization nor edge detection was performed prior to analysis. The fractal dimension has been evaluated by box-counting and sand-box methods. As a complement to these approaches, the distance map of the avascular space has been analyzed by a spectral approach.
i. Box-counting and sand-box approaches
Briefly, in the box-counting method, a regular grid of square elements of size r is superimposed to the pattern, and the number N(r) of square elements intersecting the pattern is counted. For a fractal object, the plot of N as a function of r in a bi-logarithmic scale is linear, its slope being opposite to the fractal dimension. Baish et Jain (2001) caution that N(r)
depends on the origin chosen for the grid and that the strict estimation of the fractal dimension requires shifting the grid to all possible locations until the minimum value of N(r) is found. However, following Risser (2007), this step was omitted. Nevertheless, in order to avoid coincidences of the box-counting grid with the n x n square grid underlying the resampled DLA, the box-counting origin was shifted by one pixel in both directions of space.
In the sand-box method, a pixel belonging to the pattern is randomly chosen as a centering site. Square boxes of size r (comprised between 3 and 2511) are centered on it and, for boxes totally contained in the 4096 x 4096 domain, the total number of white pixels N(r)
falling in each box is counted. The procedure is repeated for a large number η of centering sites. For a fractal object, the plot of the average of N as a function of r in a bi-logarithmic scale is linear, its slope corresponding to the fractal dimension.
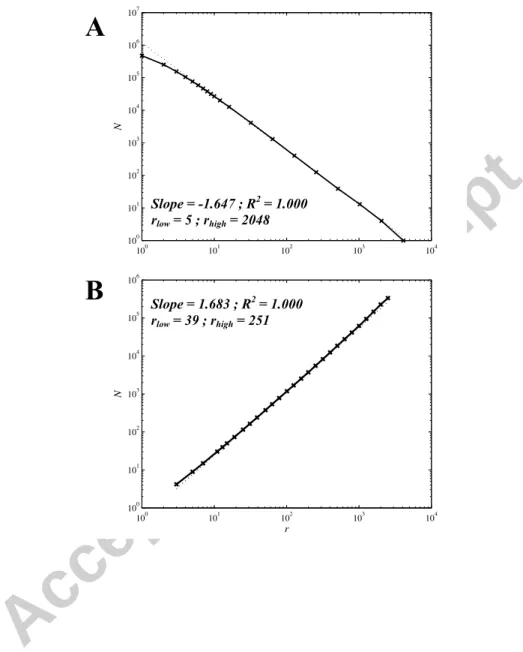
Both methods have been validated using originally sampled 500 000 particles DLA clusters (see Fig. A3). The slopes of the bi-logarithmic plots have been sought using the procedure introduced by Berntson and Stoll (1997) for quantitatively determining the spatial scales over which the structure under study shows self-similarity. Briefly, this technique consists in removing extreme points of the plot until a statistical test for curvilinearity becomes negative, i.e. the addition of a second order term for fitting the residual plot (i.e. plot of the residuals versus values predicted by a linear fit) becomes not significant at the 1% level (Sokal & Rohlf 1994). By this way, the fractal dimension measured using the box-counting method over three realizations was 1.665 ± 0.016. The linear range spanned from 11± 6 to 2048 ± 0 pixels, i.e. more than two decades of scales. The fractal dimension measured using the sand-box method was 1.688 ± 0.011. The linear range spanned from 56 ± 21 to 584 ± 382 pixels, i.e. one decade. In both cases, the coefficient of determination R2 was greater than
0.999. These results are in accordance with the theoretical mean-field prediction for DLA in 2D (df=(22+1)/(2+1)=1.667) (Vicsek 1992).
Accepted manuscript
ii. Spectral approachClassically, in the spectral approach, the fractal dimension is deduced from the Fourier power spectrum of the 2D pattern. For a fractal object, the plot of this power spectrum as a function of the spatial frequency in a bi-logarithmic scale is linear. According to Halley et al. (2004), its fractal dimension is related to the slope s of the plot by df = (5+s)/2. An alternative
version of this classical approach, focusing on the distance map of the avascular space and not on the vascular pattern, has been introduced by Risser et al. (2007). Indeed, the distance map, which represents the distance of any black pixel (tissue point) from the nearest white pixel (vessel) can provide information on the spatial delivery of oxygen by the vascular network. However, it is noteworthy that, from this alternative approach, the fractal dimension of the initial 2D pattern cannot be deduced, because no simple relationship can be drawn between fd
and the slope of the power spectrum of the avascular space’s distance map.
Briefly, the distance map d(i,j) of the avascular space is first computed. The Fourier transform of the distance map d~(fi,fj) is computed using a bidimensional fast-Fourier transform algorithm, the relevant range of spatial frequencies fi and fj lying between the
inverse image size 1/(4096 pixels) and the high frequency limit 1/(2 pixels). The power spectrum P(fi,fj) is obtained as |d~(fi,fj)|2. This power spectrum is finally averaged over
concentric circles in the Fourier plane ( fij = fi2+ fj2 =cste) to obtain the averaged power spectrum P(fij). For a fractal avascular space, the plot of P as a function of fij in bi-logarithmic
coordinates is linear.
The spectral approach has first been validated in its classical version by studying the Fourier spectra of originally sampled 500 000 particles DLA clusters. Indeed, these clusters have been demonstrated to be fractal objects by the box-counting and sand-box methods. The slopes of the bi-logarithmic plots have been sought using the same procedure as above. By this way, the linear range over three realizations spanned from 8.6 ± 0 pixel-1 to 225.4 ± 42.5 pixel-1, i.e. more than one decade of frequency scales. The slope s was -1.55 ± 0.016 with coefficients of determination R2 greater than 0.995. Thus, the fractal dimension of the 500 000
particles DLA clusters obtained by this method (df = (5+s)/2) was 1.722 ± 0.008, which
slightly overestimates the theoretical prediction (1.667, see above). Second, the alternative approach focusing on the distance maps of the same clusters has been tested. The spectra obtained by this alternative approach were linear (s = -3.07± 0.008) with coefficients of determination R2 greater than 0.999. However, the linear range of frequency scales (51.8 ± 5.7 pixel-1 to 163.5 ± 26.5 pixel-1) was reduced compared to the linear range obtained with the classical approach, which is not surprising due to the finite size of the domain under study (side effects).
(c) Multi-scale analysis
In this Section, the box-counting and sand-box methods are successively applied to the 5000 particles resampled DLA clusters, to both kinds of homogeneous meshes and to both kinds of generic patterns (Fig. 1). Then, the distance map of their avascular space is analyzed by the spectral approach.
Accepted manuscript
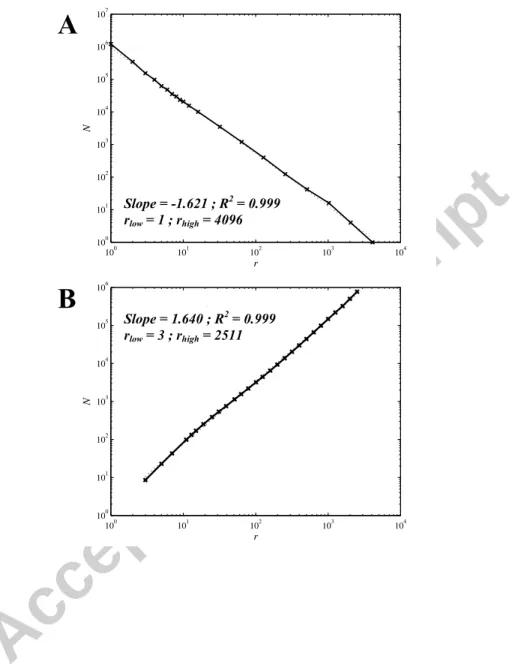
i. Box-counting and sand-box analysesFirst, 5000 particles resampled DLA clusters have been analyzed (see Fig. A4) and the spatial scales over which they show self-similarity have been determined using Berntson’s procedure (see Section A1.(b).i). By this way, the fractal dimension measured using the box-counting method over five realizations was 1.623 ± 0.003. The linear range spanned from 1 ± 0 to 4096 ± 0 pixels, i.e. the whole range of scales for these structures. The fractal dimension measured using the sand-box method was 1.637 ± 0.011. The linear range spanned from 3 ± 0 to 2511 ± 0 pixels, i.e. almost three decades. In both cases, the coefficient of determination R2 was greater than 0.998. Thus, even if a lower cut-off for self-similarity has
been imposed while generating these resampled DLAs, they appear to be self-similar over the whole range of scales when studied by both multi-scale tools.
Second, the n x n square grid, which is by construction homogeneous for scales above
n and a linear object for lower scales, has been analyzed. As expected, in both cases, the plot of N as a function of r in a bi-logarithmic scale exhibits two domains (see Fig. A5). The cut-off length between these two domains has been detected automatically by comparing the local slope s(r) to the slope S~ between the data obtained at minimal and maximal box sizes (S~= (N(rmax)-N(rmin))/(rmax-rmin)) : for increasing r, the cut-off length rcutis reached as soon as
|s(r)| becomes greater than S~ . By this method, rcutwas determined as 12 pixels by the
box-counting method and as 39 pixels by the sand-box method, that is to say, lower and upper bound values for n. At larger scale, a homogeneous space-filling behavior (slope = ± 2) is observed. In this domain, linearity of the data was confirmed by use of Berntson’s procedure : the linear range spanned from 16 to 4096 pixels (box-counting) and from 51 to 2511 pixels (sand-box), with a coefficient of determination R2 greater than 0.999. At lower scale,
Berntson’s statistical test for curvilinearity was always positive at the 1% level. Thus, the linear behavior is only apparent, even if the best linear fit for box sizes smaller than rcut
(dotted lines on Fig. A5) has high coefficients of determinations6. Thus, both multi-scale tools are able to discriminate between the low scale region, where the square grid is only apparently fractal, and the large scale region, where it is homogeneous and space filling.
The same behavior is observed for random networks (see Fig. A6). For five realizations, rcut was determined as 10 ± 0 pixels (box-counting) and as 25 ± 0 pixels
(sand-box), i.e. lower and upper bound values for n. At large scale, the linear range spanned from 12 ± 0 pixels to 4096 ± 0 pixels (box-counting) and from 31 ± 0 pixels to 2511 ± 0 pixels (sand-box), with slopes of -1.999 ± 4x10⁻⁵ (box-counting) and 1.999 ± 3.2x10⁻⁴ (sand-box) and coefficients of determination greater than 0.999. At low scale, linearity was only apparent, as determined by Berntson’s procedure. Thus, as expected, random networks are not fractal at low scale. In addition, both multi-scale tools demonstrate that these networks are homogeneous at large scale.
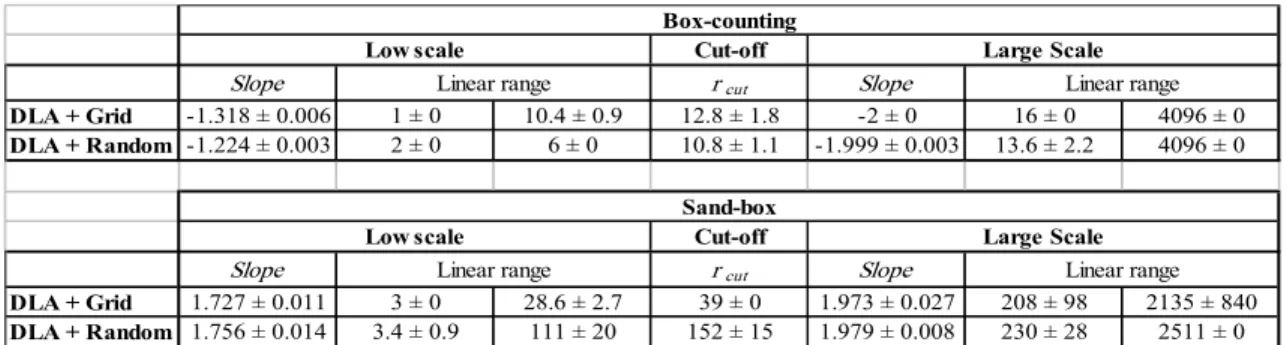
Third, both kinds of generic patterns (see Fig. 1) have been analyzed. In both cases, the plots of N as a function of r in a bi-logarithmic scale exhibit two linear domains (see Figs. A7 and A8). The cut-off lengths rcut between these domains have been detected automatically
as above. The linear ranges of each domain, as well as their slopes, have been determined using Berntson’s procedure. The data obtained for five realizations are summarized in Table A1.
6 Incidentally, this result demonstrates that there is no inconsistency between the results obtained by Arlt
Accepted manuscript
By construction, the union of 5000 particles resampled DLA clusters and of either kind of meshes is not self similar for scales below than n. However, they appear to be self-similar at low scale when studied by both multi-scale tools, with fractal dimensions ranging from 1.22 to 1.76 (see Table A1, left). In addition, the self-similar nature of the resampled DLA cluster at large scale is masked by the presence of the superimposed mesh, leading to slopes approximately equal to 2 (Table A1, right). As a conclusion, these multi-scale tools give an estimate of the characteristic length of the underlying (capillary) lattice, because the cut-off values obtained by the box counting and the sand-box methods are respectively a lower bound and an upper bound value for n7. However, they are not adapted to study thefractal behavior of the large structures (DLA clusters) when the image resolution is sufficiently high to display the capillary mesh. In addition, they are not adapted to study the lower scales, where they erroneously detect self-similarity.
Therefore, when studying real vascular structures, it is impossible to conclude that they are fractal at low scale and homogeneous at large scale only on the basis of similar results obtained by box-counting and sand-box analyses. That is why it is important to check whether the spectral approach is more robust. For that purpose, in the next sub-section, the spectral approach is applied to the resampled DLA clusters superimposed, or not, to both kinds of homogeneous meshes.
ii. Spectral approach
The averaged power spectra of five realizations of the distance maps of 5000 particles resampled DLA clusters superimposed, or not, to the square grid are displayed on Fig. A9(A). For comparison, the power spectrum of the square grid distance map is displayed on the same figure. First, this spectrum displays clear peaks, the first one at kc = 256 pixel-1, indicating a
periodic structure with a characteristic length lc of 4096/kc, i.e. 16 pixels, the imposed period
of the grid. A plateau at lower frequencies indicates the absence of any specific relevant scale,
i.e. a homogeneous structure, beyond 16 pixels. Second, the spectrum of the distance maps of the 5000 particles resampled DLA clusters is approximately linear (slope = -3.12 ± 0.13), with a coefficient of determination greater than 0.999, but the linear range according to Berntson’s procedure is limited to kij ranging from48.5 ± 30.4 pixel-1 to 201.5 ± 130 pixel-1.
Finally, the spectrum of the distance maps of the superposed structures is linear (slope = -3.99 ± 0.016) for frequencies beyond kc, with a linear range spanning from
kij = 258.5 ± 0 pixel-1 to 2048 ± 0 pixel-1, i.e. the whole range of frequencies above kc, but a
coefficient of determination of only 0.76 due to the presence of the frequency peaks. In addition, this spectrum saturates at low frequencies. Thus, as previously, the superposed structures appear to be self-similar at large frequencies (low scale) and homogeneous at low frequencies (large scales) when studied by the spectral approach.
The averaged power spectra of five realizations of 5000 particles resampled DLA clusters superimposed, or not, to random meshes are displayed on Fig. A9(B). For comparison, the averaged power spectrum of the random meshes is displayed on the same figure. A smooth maximum, centered on kc = 256 pixel-1, is observed in the spectrum of
regular meshes, indicating a quasi periodic structure with a characteristic length lc of 16
7 Note that the cut-off value obtained by the BC method is directly related to the characteristic length of the
capillary mesh whereas the cut-off obtained by the SB method depends on this characteristic length as well as on the relative number of pixels belonging to the DLA cluster and to the capillary lattice (i.e. the relative weight of the DLA), in a complex fashion. Therefore, in practice, the BC cut-off provides a better estimate of the characteristic length of the capillary mesh.
Accepted manuscript
pixels. In addition, a plateau at low frequencies (typically below 140 pixel-1) indicates the absence of any specific relevant scales beyond 29 pixels. At large frequencies, however, a linear behavior is observed. According to Bernton’s procedure, its linear range spans from kij= 586.5 ± 5.5 pixel-1 to 1258.5 ± 15.8 pixel-1 with a slope of -3.9791 ± 0.009 and a coefficient of determination greater than 0.999. The same behavior (slope of -4.000 ± 0.003 with a linear range spanning from kij = 601.5 ± 4.5 pixel-1 to 1262.5 ± 5.5 pixel-1) is observed at high
frequencies when resampled DLA clusters are superimposed to the random meshes. In this latter case, saturation of the power spectrum at low frequencies is still observed, even if it is less pronounced than the saturation observed for the meshes alone. Thus, once again, the superposed structures appear to be self-similar at large frequencies (low scale) and homogeneous at low frequencies (large scales) when studied by the spectral approach.
As a conclusion, in the same way as for the box-counting and sand-box methods, the spectral approach is not adapted to study the multi-scale behavior of generic patterns constructed as the union of quasi-fractal trees and homogeneous meshes, because the results obtained are counter-intuitive. In order to seek whether such an idealized generic structure could properly describe a real vasculature such as the intra-cortical vascular network, the results presented above are compared to the results obtained by Risser et al. (2007).
(d) Comparison with the results of Risser et al.
The results obtained when analyzing the multi-scale behavior of both kinds of generic patterns (Fig. 1) are very close to the results obtained by Risser et al. (2007) when analyzing large datasets of healthy vascular networks imaged at high spatial resolution.
First, in the present work, two domains are evidenced by the box-counting and sand box analyses: a linear domain at low scale (note that even if the linear ranges indicated in Table A1, as determined by Berntson’s procedure, seems to bee small, the best linear fits for box sizes smaller than the cut-off length, displayed as dotted lines in Figs. A7 and A8, always have coefficients of determinations greater than 0.997). The apparent fractal dimension obtained by the box-counting method for this linear domain is always smaller than the apparent dimension obtained by the sand-box method. In addition, the cut-off lengths between the two domains determined by the box-counting method are always smaller than the cut-off determined by the sand-box method. At higher scale, a homogeneous, space-filling behavior (df = 2) is obtained. All these results have also been obtained by Risser et al. (2007), although
in 3D, where the homogeneous, space-filling behavior is characterized by df = 3.
The most significant difference with their results concerns the spectral approach. Indeed, neither the square grid nor the random networks used in the present work are able to reproduce a clear linear trend at high frequencies (i.e. a linear trend over the whole range of frequencies above kc associated to a large coefficient of determination). In the case of the
square grid, the coefficient of determination is low due to the signature of the frequency peaks. In the case of the random networks, the smooth maximum centered on kc induces a
deviation from linearity for frequencies just above kc, which reduces the range of the linear
trend. However, this last effect, due to the quasi-periodic nature of the random meshes constructed in 2D, disappears in 3D (see Fig. A10 and legend). Furthermore, the slope obtained in the 3D case (-4.56) is very close to the slope obtained by Risser et al. (2007) for healthy networks (-4.8 or -4.9).
Accepted manuscript
Consequently, based on Risser et al.’s results, it is impossible to conclude that vascular networks are fractal at low scale and homogeneous at large scale. Indeed, the generic patterns described above are simple counter-examples: they appear to be, but they are not, fractal at low scale when studied by classic multi-scale tools (box-counting and sand box methods) and by a spectral approach; they are not homogeneous at large scale, due to the presence of the quasi fractals resampled DLA clusters, but they appear to be homogeneous at large scale because of the hindering effect due to the capillary lattice.A2. FRACTAL ANALYSIS OF INTRA-CORTICAL NETWORKS
In this Section, the multi-scale tools described above, but implemented in 3D, are used to analyze intra-cortical capillary networks. Finally, a complementary analysis, based on the analysis of the regional maxima of the distance map of their avascular space, is introduced to conclude on their behavior at low scale.
(a) Datasets
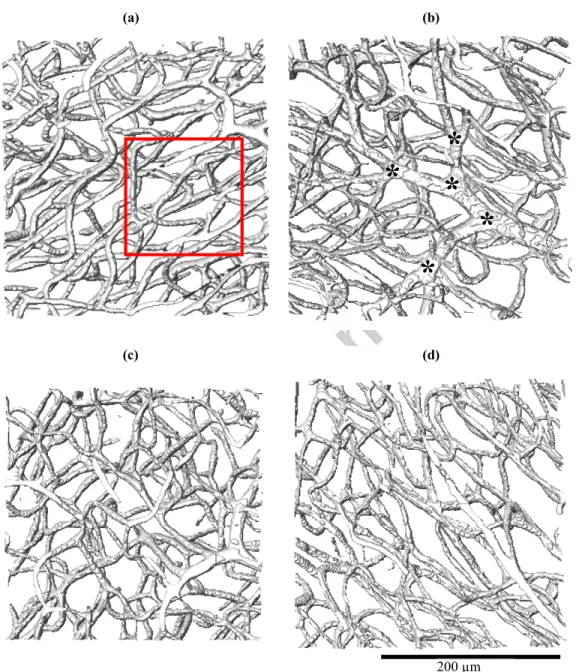
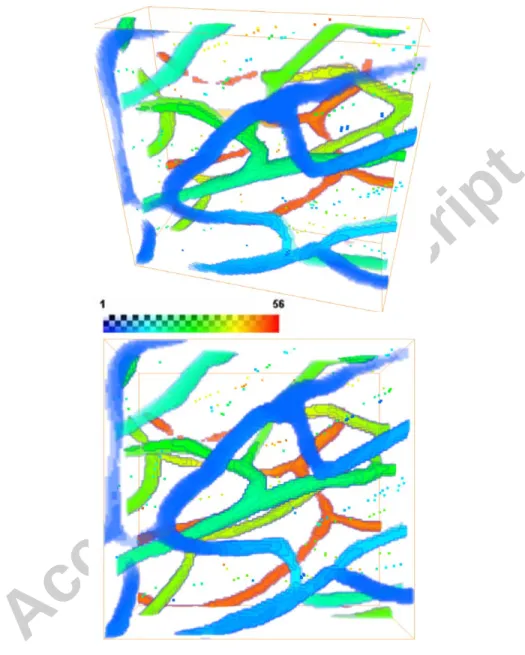
The datasets used for analysis have been previously obtained by Cassot et al. (2006) from thick sections (300 µm) of an india ink-injected human brain (Duvernoy collection, Duvernoy et al. 1981) by confocal laser microscopy, with a spatial resolution of 1.22 µm x 1.22 µm x 3 µm. To study in more details the capillary lattice, six limited areas (256 x 256 x 64 voxels) have been manually selected by visual inspection in the lateral or top region of the collateral sulcus of the temporal lobe: three lateral regions (L1 to L3) and two top regions (S1 and S2), only containing capillaries (i.e., following Cassot et al. (2006), vessels of diameter smaller than 9 µm), as well as one lateral region with capillaries surrounding the distal extremity of an arterial arborescence (LA1). Four of these regions are represented on Fig. 2. (b) Multi-scale tools in 3D
The box-counting and sand-box methods have first been implemented in 3D as a direct extension of the 2D procedures described in Section A1.(b). Here, as the voxels are not isotropic, the dimensional value of the box side r* is related to its adimensional value r (in voxels) by a conversion factor equals to the cubic root of the voxel volume. In addition, a pseudo 3D implementation of the sand-box method has been introduced, where parallelepiped boxes of size r x r x 33 are used instead of cubic boxes. In this case, the dimensional value of the box side r* is simply 1.22 r. With the two former methods, a homogeneous space-filling structure exhibits a fractal dimension of three, whereas with the third method, such a structure exhibits a dimension of two.
In the 3D spectral approach, the distance map of the avascular space d(i,j,k) is first computed in 3D. The Fourier transform of the distance map d~(ki,kj,kk) is then computed using a bidimensional fast-Fourier transform algorithm twice in succession. The power spectrum P(ki,kj,kk) is obtained as |d~(ki,kj,kk)|
2. This power spectrum is first averaged for
each kk over concentric circles in the Fourier plane (kij = ki +kj =cste
2 2
) and finally averaged over kkto obtain the averaged power spectrum P(kij).