Characterization of Phoneme Rate
as a Vocal Biomarker of Depression
by
Gregory Alan Ciccarelli
B.S., Electrical Engineering, The Pennsylvania State University, 2009 S.M., Electrical Engineering and Computer Science, M.I.T., 2013
Submitted to the Department of Electrical Engineering and Computer Science in partial fulfillment of the requirements for the degree of
Doctor of Philosophy
in Electrical Engineering and Computer Science at the Massachusetts Institute of Technology
June 2017
@
2017 Massachusetts Institute of Technology All Rights Reserved.Signature of Author: b Certified by: Certified by: Certified by: Accepted by: MASSACHUSETTS INSTITUTE OF TECHNOLOGY
JUN 2
3
2017
LIBRARIES
epartment of Electrical Engineering and Computer Science May 19, 2017
/
John D. E. Gabrieli Grover Hermann Professor in Health Sciences and Technology and Cognitive Neuroscience Thesis Supervisor Satrajit S. Ghosh Principal Research Scientist, the McGovern Institute for Brain Research Thesis Supervisor Thomas F. Quatieri Senior Technical Staff, MIT Lincoln Laboratory
r
, - ,Thesis SupervisorLeslie A. Kolodziejski Professor of Electrical Engineering and Computer Science Chair, Committee for Graduate Students CO)
w
0
a:
Characterization of Phoneme Rate
as a Vocal Biomarker of Depression
by
Gregory Alan Ciccarelli
B.S., Electrical Engineering, The Pennsylvania State University, 2009 S.M., Electrical Engineering and Computer Science, M.I.T., 2013
Submitted to the Department of Electrical Engineering and Computer Science in partial fulfillment of the requirements for the degree of
Doctor of Philosophy
in Electrical Engineering and Computer Science at the Massachusetts Institute of Technology
June 2017
@
2017 Massachusetts Institute of Technology All Rights Reserved.Signature of Auth
Certified by:
Certified by:
Certified by:
Signature redacted
Iepartment of Electrical Engineering and Computer Science
Signature redacted
May 19, 2017__
John D. E. Gabrieli Grover Hermann Professor in Health Sciences and Technology and Cognitive Neuroscience
r1 n
rim rimt~Thesis
SupervisorSatrajit S. Ghosh Principal Research Scientist, the McGovern Institute for Brain Research
-Signature
redacted
Thesis Supervisor Accepted by: MASSACHUSETTS INSTITUTE OF TECHNOLOGYJUN 2
3
2017
LIBRARIES
Thomas F. Quatieri Senior Technical Staff, MIT Lincoln Laboratory0 " " , jThesis Supervisor
Signature redacted
ThssSprioI
.-
J
Leslie A. Kolodziejski Professor of Electrical Engineering and Computer Science Chair, Committee for Graduate Students CO)w
0
a:
Characterization of Phoneme Rate as a Vocal Biomarker of Depression
by Gregory Alan Ciccarelli
Submitted to the Department of Electrical Engineering and Computer Science in partial fulfillment of the requirements for the degree of
Doctor of Philosophy Abstract
Quantitative approaches to psychiatric assessment beyond the qualitative descriptors in the Diagnostic and Statistical Manual of Mental Disorders could transform mental health care. However, objective neurocognitive state estimation and tracking demands robust, scalable indicators of a disorder. A person's speech is a rich source of neurocog-nitive information because speech production is a complex sensorimotor task that draws upon many cortical and subcortical regions. Furthermore, the ease of collection makes speech a practical, scalable candidate for assessment of mental health. One aspect of speech production that has shown sensitivity to neuropsychological disorders is phoneme rate, the rate at which individual consonants and vowels are spoken. Our aim in this thesis is to characterize phoneme rate as an indicator of depression and to improve our use of phoneme rate as a feature through both brain imaging and neurocomputational modeling.
This thesis proposes that psychiatric assessment can be enhanced using a neurocom-putational model of speech motor control to estimate unobserved parameters as latent descriptors of a disorder. We use depression as our model disorder and focus on motor control of speech phoneme rate. First, we investigate the neural basis for phoneme rate modulation in healthy subjects uttering emotional sentences and in depression us-ing functional magnetic resonance imagus-ing. Then, we develop a computational model of phoneme rate to estimate subject-specific parameters that correlate with individ-ual phoneme rate. Finally, we apply these and other features derived from speech to distinguish depressed from healthy control subjects.
Thesis Supervisor: John D. E. Gabrieli
Title: Grover Hermann Professor in Health Sciences and Technology and Cognitive Neuroscience
Thesis Supervisor: Satrajit S. Ghosh Title: Principal Research Scientist Thesis Supervisor: Thomas F. Quatieri Title: Senior Technical Staff
Acknowledgments
In grateful recognition of the individuals and groups who have invested themselves in my doctoral journey, I echo Carlo's often repeated exclamation, with emphasis on the plural pronoun, "We've got this!"
" Thomas Quatieri, my Lincoln co-supervisor, for his attention to detail in commu-nication and his generosity with his time.
" Satrajit Ghosh, my campus co-supervisor, for his patience and his views on the scientific process.
" John Gabrieli, my campus co-supervisor, for his thoughtful feedback and his ac-ceptance of an EECS student into his cognitive neuroscience laboratory.
" Thomas Heldt and Polina Golland, for their guidance as members of my committee. " The Gabrieli Laboratory and Voice project contributors with special mention of Kevin Sitek, Carlo de los Angeles, Mathias Goncalves, Anissa Sridhar, and our experiment participants.
" The SHBT and BCS entering classes of 2014, and the Fee, Golland, and McDer-mott labs for their friendship and collegiality.
" Jeffrey Palmer and the Lincoln Scholars committee for this opportunity.
" My colleagues at Lincoln with special mention of Adam Lammert and Chris Smalt for productive discussions and the Lincoln librarians for their helpfulness.
" My extended family, my brother, Geoff, and especially my parents, Victoria and Dennis, who have supported me throughout my career with a saint's level of pa-tience, support, and love.
" All the saints and members of heaven who have interceded on my behalf, and God for carrying me through to the end.
6
This work was supported by an MIT Lincoln Laboratory scholarship, by an MIT Lincoln Laboratory and a McGovern Institute for Neurotechnology Grant, and an NIH NIBIB ROl EB020740. This work used the Martinos Imaging Center at MIT. Parkin-son's data was contributed by users of the ParkinParkin-son's mPower mobile application as part of the mPower study developed by Sage Bionetworks and described in Synapse doi: 10.7303/syn4993293.
Contents
Abstract 3
Acknowledgments 4
List of Figures 11
1 Introduction 17
1.1 Need for Depression Biomarkers. . . . . 17
1.2 Motivation and the Phoneme Rate Biomarker . . . . 18
1.3 This Thesis as a Framework . . . . 19
1.3.1 Why Create Computational Models? . . . . 19
1.3.2 Computational Models in Psychiatry and Speech Production . . 20
1.3.3 Research Approach of this Thesis . . . . 21
1.4 Summary of Contributions . . . . 22
1.5 Thesis Organization . . . . 23
2 Characterization of Phoneme Rate in Read Speech 25 2.1 Basic Definitions . . . .. ... 25
2.2 M ethods . . . . 28
2.2.1 Protocol . . . . 28
2.2.2 Vocal Biomarkers . . . . 30
2.2.3 Direct Comparisons with Prior Art . . . . 30
2.2.4 Machine Learning . . . . 31
Pre-processing through Classification . . . . 32
Evaluation . . . . 33
2.2.5 Stability of the Phoneme Features . . . . 34
2.3 R esults . . . . 35
2.3.1 Dataset Characteristics . . . . 35
2.3.2 Comparisons with Prior Art . . . . 37
2.3.3 Classification Performance . . . . 37
2.3.4 Feature Stability . . . . 39
2.4 D iscussion . . . . 39
3 Task-Based fMRI Analysis of Phoneme Rate 43 3.1 Background and Research Hypothesis ... 43
3.1.1 Neuroanatomy of Speech Production ... 43
3.1.2 Limbic System Dysfunction and Depression . . . . 46
3.1.3 Research Hypothesis . . . . 46
3.1.4 Study Novelty and Relationship to Prior Art . . . . 47
3.1.5 Neuroimaging of Speech Production . . . . 49
The Functional MRI Scan . . . . 49
The General Linear Model . . . . 50
3.2 The fMRI Task and General Linear Model Analysis . . . . 51
3.2.1 M ethods . . . . 51
Participants . . . . 51
Protocol . . . . 51
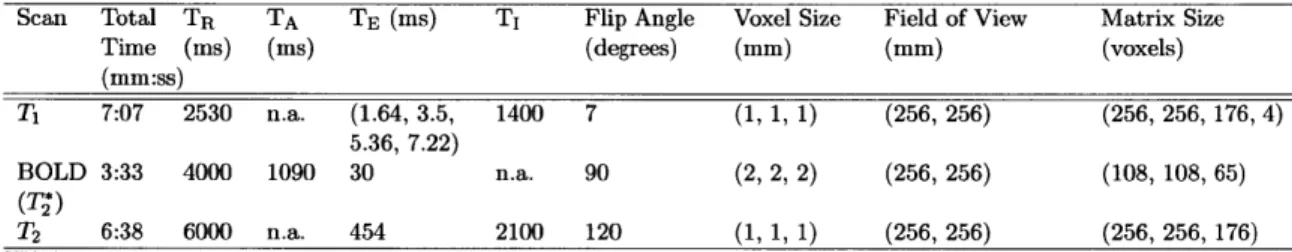
fMRI Acquisition Parameters and Analysis Software . . . . 52
General Linear Model Analysis . . . . 53
3.2.2 R esults . . . . 55
Dataset Characteristics . . . . 56
Main Effect: Speaking vs Not Speaking . . . . 59
Main Effect: Valence Intensity . . . . 59
Controls vs Depressed Effect: Valence Intensity . . . . 61
Main Effect: Articulation Rate . . . . 62
Controls vs Depressed Effect: Articulation Rate . . . . 62
Controls vs Depressed Effect: Speaking vs Not Speaking . . . . . 62
3.2.3 Discussion . . . . 65
3.3 Connectivity Analysis . . . . 67
3.3.1 Background . . . . 68
Dynamic Causal Modeling . . . . 68
Research Hypothesis . . . . 69
3.3.2 M ethods . . . . 69
Model Specification . . . . 69
Model Input Data . . . . 70
Evaluation . . . . 72
3.3.3 R esults . . . . 72
Dataset Characteristics . . . . 72
Model Selection by Classification Performance . . . . 74
Model Selection by HRF Prediction . . . . 75
3.3.4 Discussion . . . . 75
4 Phoneme Rate Model 79 4.1 Background and Prior Art . . . . 79
4.1.1 Definitions . . . . 79
CONTENTS 9 4.1.2 Current Neurocomputational Speech Production Models . .
4.1.3 Innovation and Contributions . . . . 4.2 Models of Phoneme Rate . . . . 4.2.1 The Execution Model . . . . 4.3 Methods . ... ... .. .. .. .... ... ...
4.3.1 The True Phoneme Durations . . . . 4.3.2 The Nominal Acoustic Trajectory . . . . 4.3.3 The Computational Model . . . . The Basic Smith Predictor . . . . The Smith Predictor with Changing Targets . . . . The Controller in Depth . . . . The Vocal Tract Model . . . . 4.3.4 Optimization . . . . 4.4 R esults . . . . 4.5 D iscussion . . . . 5 Phoneme Rate and Acoustic Biomarkers of Depression
5.1 Speech and Depression . . . . 5.1.1 Characteristics of Depressed Speech . . . . 5.1.2 Features from a Neurocomputational Modeling Perspective 5.2 Materials and Methods . . . .
5.2.1 Vocal Source Model . . . . Control Framework . . . . Implementation . . . . Muscle Activation . . . . Feature Extraction from Muscle Activations . . . . 5.2.2 Model Free Features . .. . . . All Phoneme Statistics . . . . O pensm ile. . . . . 5.2.3 Machine Learning . . . . 5.3 R esults. . . . . 5.4 D iscussion . . . . 6 Conclusion
6.1 Review of Specific Aims and Findings 6.2 Study Challenges . . . . 6.3 Extensions . . . . 6.3.1 Model Improvements and Useage . 6.3.2 Additional Questions . . . . 6.3.3 Neuroimaging at Finer Time Scales 6.4 Looking to the Future . . . . A The General Linear Model
81 84 85 86 88 90 90 92 92 94 96 98 98 99 102 105 105 105 108 108 110 110 110 112 113 114 114 115 117 117 117 123 123 124 126 126 128 129 129 133 9 CONTENTS
10 CONTENTS
A.1 GLM Terminology and Significance Tests .... ... 133
A.1.1 Main Effects, Conditional Effects, and Interactions . . . 133
A.1.2 GLM Significance Tests . . . . 134
A.1.3 GLM Across Subjects . . . 136
A.2 Interpreting GLM Results . . . 137
A.2.1 GLM Analysis Questions . . . 138
Question 1: Is there an effect of depression on brain activity? . . 138
Question 2: Does sentence emotion affect brain activity? . . . 139
Question 3: Does depression interact with sentence emotion? . . 139
Sum m ary . . . 140
A.2.2 Phoneme rate, depression, and emotion . . . 140
B The Complete MRI Protocol 143
C Phoneme Duration Correlations 145
List of Figures
1.1 This thesis brings together three key elements and studies their relation-ships. These elements are neurobiology ("Brain"), behavioral responses, in particular speech ("Behavior"), and computational modeling ("Mod-elin g"). . . . . 21 1.2 This thesis aims to understand an individual at a systems level by
ap-plying analysis, modeling, machine learning, and quality assurance tech-niques to acoustic and neuroimaging observeables of psychological health. 22 2.1 Phoneme annotated example of the word "colors." The top row shows the
amplitude vs time of the utterance. The middle row shows the spectro-gram of frequency vs time with darker regions corresponding to greater energy. The bottom row shows each automatically identified phoneme label and its phoneme boundaries in Arpabet notation. . . . . 26 2.2 The machine learning pipeline operates within a shuffle-split cross-validation
loop, so parameters from the processing stages that operate on training data (top row) are applied to the test subjects (bottom row). Raw fea-ture vectors are pre-processed before feafea-ture selection, feafea-ture fusion, and classifier construction. . . . . 32 2.3 Schematic example of a Receiver Operating Characteristic (ROC) curve. 34 2.4 Reading time vs BDI for the different passages. The Rainbow
consis-tently takes the longest time to read, and the Grandfather takes the least amount of time. The x-axis shows one tick mark per subject with the subject's corresponding BDI score. A subject with a BDI score greater than or equal to 14 is classified as depressed (vertical, gray line). . . . . 36 2.5 Spearman correlation of an individual phoneme's duration with the BDI
(left), and the Spearman correlation with the aggregated mean phoneme duration using all individually significantly correlating phonemes after the methodology of Trevino et. al. Red indicates depressed subjects, and blue indicates control subjects. . . . . 37
3.1 Brain regions associated with speech and depression. (Top) Selected cortical regions of interest shown on the lateral (outside) surface of the brain. (Middle) Selected cortical regions on the medial surface. (Bottom) Selected subcortical regions. Figures after [13, 44, 60] . . . . 45 3.2 Through the amygdala's membership of a larger depression network,
depression severity may modulate amygdala activity and by extension modulate the phoneme rate. Succinctly, the amygdala is hypothesized to affect phoneme rate in the caudate. . . . . 47 3.3 The BOLD response measured during an experiment can be well
mod-eled as a linear convolution of the neural activity during the experiment convolved with the hemodynamic response function (HRF). This rela-tionship forms the basis of the General Linear Model framework. Figure after [70]. . . . . 49 3.4 Sparse imaging protocol visualized by observing the recorded audio track.
Periods of speaking (low amplitude) alternate with periods of MRI noise during the brain scan (high amplitude). The acquisition time is equal to the duration of the red bar, and the repetition time is equal to the duration of the red and blue bars. . . . . 53 3.5 A representative example of the banding artifact that was grounds for
subject exclusion. Banding is believed to occur from subject motion during a run that uses the SMS sequence. . . . . 57 3.6 Subject exclusion based on quality assurance and data availability. We
show by subgroup (depressed and control) and by total subject count the number of subjects with data at various processing stages. Starting from all subjects who received an MRI ("MRI") and completed the emotional sentences task ("Emo"), we show how many subjects had successful data collections and processing. "T1" tallies the subjects that had a successful T1 reconstruction, "Audio" tallies the number of subjects with successful audio recording, "L1" tallies the subjects with audio, a T1, and a fMRI, and "group" shows the number of subjects from the Level-1 analysis who did not have banding artifacts and could be analyzed at the group level. 58 3.7 A robust group average speech network is recovered, medial (top) and
lateral (bottom) views. L1 contrast: task > baseline, Group: all subjects. 59 3.8 A robust group average speech network is recovered, coronal cross
sec-tions. L1 contrast: task > baseline, Group: all subjects. . . . . 60 3.9 The main effect of the absolute value of the valence reveals extensive
limbic cortex activation across all subjects. L1 contrast: absolute value of valence > baseline, Group: all subjects. . . . . 60 3.10 Coronal view of limbic activations with sentence valence. L1 contrast:
absolute value of valence > baseline, Group: all subjects. . . . . 61
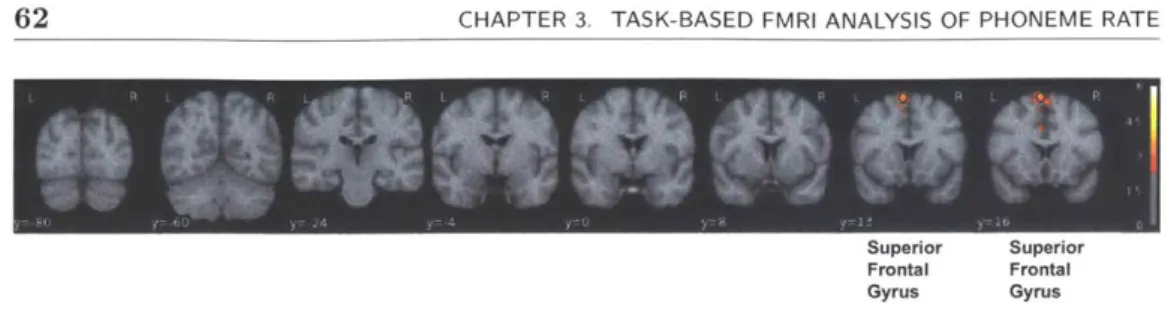
3.11 The group effect of controls vs depressed for the absolute value of valence reveals increased activation in the superior frontal gyrus and paracingu-late cortex for controls relative to depressed. L1 contrast: absolute value of valence > baseline, Group: controls > depressed. . . . . 61 3.12 Coronal view of limbic activations with sentence valence. L1 contrast:
absolute value of valence > baseline, Group: controls > depressed. . . . 62
3.13 The group effect of controls vs depressed for the absolute value of valence reveals increased activation in the superior frontal gyrus and paracingu-late cortex for controls relative to depressed. L1 contrast: absolute value of valence > baseline, Group: controls > depressed . . . . 63 3.14 There is a strong putamen and anterior insula activation difference
be-tween controls and depressed subjects when speaking. L1 contrast: task > baseline, Group: controls > depressed. . . . . 63 3.15 The subject level effect sizes within the left putamen and other regions
that were used in the group level contrast of Figure 3.13. The vertical line corresponds to the BDI threshold of 14 for classification as depressed, and the effect sizes differ between the groups. This plot visually shows the interaction of depression with speaking because there is a linear rela-tionship with non-zero slope between depression severity and effect size. L1 contrast: task > baseline, Group: controls > depressed. . . . . 64 3.16 DCM A connectivity matrix. Intrinsic connections present in yellow,
disconnections in dark blue. Hypothesized connections in light blue. . . 71 3.17 Two examples from subject 846 showing the predicted and true HRF
waveforms in the left putamen (top) and inferior frontal gyrus, pars tri-angularis (bottom) for the first fMRI run. The predicted waveform is generated using connectivity weights estimated from the second fMRI run, but stimuli from the first fMRI run (i.e., true out-of-sample pre-diction). The estimated connectivity matrix is Aconnected. p values are uncorrected... ... 73 3.18 Comparison of the Aconnected and Adisconnected matrices by considering
the within run and out-of-run fits across all regions of interest for controls and depressed subjects. Goodness-of-fit (GOF) was evaluated by the Spearman correlation (mean, standard deviation) between the true and predicted runs. . . . . 76 4.1 An example of two phonemes in F and F2 space. The auditory target
region (dotted grayed box), and the auditory width parameter, w, for the F dimension are shown for the [IY] phoneme. . . . . 80 4.2 Speech control occurs at multiple time scales from high level, paragraph
timescales to low level, phoneme timescales. DIVA operates at low level control, and GODIVA operates at the next higher level from DIVA. . . 82
13 LIST OF FIGURES
4.3 An initial and expanded auditory target region for a vowel (left) and con-sonant (right) in F1 and F2 space. The difference in regions is a result of differences in production requirements for vowols vs consonants. An ex-panded vowel target causes a greater reduction in travel distance (arrow length) from a starting point with a smaller F2 than the target relative to an expanded consonant target. Consequently vowels are shortened in duration more than consonant in fast speech. After [59]. . . . . 85 4.4 Schematic version of the DIVA model after [60] with the hypothesized
locations of the two neural phoneme rate control variables, w and a. . . 86
4.5 Hypothesized separation of subjects in latent parameter space. Controls (HC) have narrow auditory targets (small w) and an agile, responsive motor system (large a) in contrast to depressed subjects (MDD). . . . . 89 4.6 Algorithm for estimating w and a illustrated schematically with
hypo-thetical data. (a) Input waveform from the subject. (b) Automatic phoneme recognition. (c) Sequence of phonemes and their corresponding auditory targets. phoneme duration is not specified, only phoneme or-der. (d) Output from optimization of the model for a control vs depressed subject. The depressed subject has large auditory targets that are only imprecisely attained as opposed to the narrow, precisely met targets of a healthy control. Because of differences in the latent parameters, the underlying model yields differences in phoneme duration. Consequently the durations for the depressed subject are increased and the time series appears stretched relative to the control. . . . . 91 4.7 Simple feedback control system with controller, c, plant, g, reference, r,
plant output, yp, and feedback signal, Yfb. . . . . 93 4.8 Smith's problem: c was designed for a system without a bulk delay. How
should the new c=? be chosen such that the system with the bulk delay behaves as if c were the controller for a system without the bulk delay? 94 4.9 Smith's solution: the original c can be reused in the system with a bulk
delay by using a prediction model of the plant, , and an estimate of the bulk delay, k . . . . .94
4.10 The Smith predictor updated to use the auditory width parameter, w,
inside a comparator block, w, that controls the current target phoneme. 95 4.11 Inside the controller, c, which features a proportional error mechanism
(dotted line), an inverse Jacobian for converting between errors in au-ditory space to updates in articulator position space, the limiter, L with parameter a, and an accumulator that together make c act as a proportional-integral controller. . . . . 96 4.12 The Maeda Man: a schematic version of the articulatory speech synthesis
system used as the plant, g, to convert articulator positions to formant frequencies [56, 86]. . . . . 98
4.13 Simulated and actual phoneme durations for one emotional sentence for one subject with depression. Spearman correlation: 0.18 (p = 0.08).
Mean absolute error: 37 ms. . . . 100
4.14 Scatter plot of subjects using the phoneme rate model parameters for each passage. Dot size is proportional to goodness-of-fit (smaller dot implies better fit i.e., smaller mean absolute error). a.u. = arbitrary units. 101 5.1 Examples of low-level features that can be derived from the speech wave-form. The large diversity of measurements makes speech an information rich biom arker. . . . 106
5.2 Neurocomputational control framework for the vocal source. The bio-physical source model enters in the forward model and auditory inversion blocks. Dotted lines and gray modules are not used in the results. . . . 111
5.3 True and model-generated fundamental frequency (top) and inferred CT and TA muscle activations (bottom). . . . 113
6.1 There is less activation in the precuneus (both a dorsal segment and ven-tral segment shown by two black circles) in controls relative to depressed subjects when producing consonants as opposed to vowels. L1 contrast: consonant rate > vowel rate, Group: controls > depressed. Multiple comparison corrected. . . . 130
A. 1 Two equivalent graphical representations of the fictional data in Table A.2.138 A.2 Mock data demonstrating possible relationships or lack thereof between phoneme rate, depression, and sentence emotion. . . . 142
A.3 Hypothesized dependence of phoneme rate, depression, and emotional sentences. ... ... ... ... 142
C.1 BDI vs phoneme durations: Rainbow . . . 146
C.2 BDI vs phoneme durations: Caterpillar . . . 147
C.3 BDI vs phoneme durations: Grandfather . . . 148 15 LIST OF FIGURES
Chapter 1
Introduction
T
HIS thesis investigates the neurobiology of depression's effect on speechthrough neurocomputational models with the aim of advancing the practical application and scientific understanding of using speech as a biomarker of depression. We contribute a novel analysis paradigm that uses neurocomputational models of speech to identify biomarkers of depression, and we investigate depression's effect on a specific aspect of speech production, phoneme rate control.
S1.1
Need for Depression Biomarkers
A major depressive episode afflicts 6.7% of the adult US population each year [25], and major depression disorder costs the US $210 billion annually [58]. A key step to combating depression effectively is to develop biomarkers for timely detection of depression and for tracking its severity in the presence or absence of treatment. A biomarker of depression is a datum derived from a measurement of an individual that relates to the individual's depression severity. This information may be helpful to caregivers and also to the individual by making the individual aware of the condition
[73].
Biomarkers are needed because methods for assessing depression are unreliable, slow to administer, subjective, late to diagnose the problem, and only intermittently per-formed. The gold standard by which depression is diagnosed is the structured clinical interview (SCI) by a trained clinician. The SCI is used to evaluate a subject for essen-tially qualitative, not quantitative, signs of depression where the signs of depression are set forth in the Diagnostic and Statistical Manual of Mental Disorders (DSM) [5]. To be diagnosed with major depressive disorder (MDD), the DSM V [4] requires five of nine conditions to be met, and at least one of the five conditions must be either depressed mood or loss of pleasure in life. Unfortunately, even though trained clinicians are the only ones certified to make the diagnosis, even among them there is large variability. Diagnosing MDD has a low inter-rater agreement with a kappa value of 0.28 (compare to schizophrenia with kappa of 0.46 and post traumatic stress disorder with kappa of 0.67 [109]).
Because the SCI is limited to clinicians as well as time consuming to administer (it can take between 45 minutes to two hours), alternative patient self-report surveys
have been created. There are a plethora of both open source and proprietary measures. These include the Beck Depression Inventory [10], the Quick Inventory of Depression [112], and the Patient Health Questionnaire [75]. The existence of so many screening tools highlights the challenge of identifying depression, but also presents obstacles to progress as different studies might use different tools. Therefore results may not be directly comparable.
We highlight one self-report survey, the Beck Depression Inventory, for its use in this thesis. The BDI was originally published in 1961 [9] and has since been revised. The current version, and the one used in this thesis, is the BDI-II [10], though for brevity the second edition version will be abbreviated as BDI. The BDI is a 21 question, multiple choice survey with a minimum score of 0 and a maximum score of 63. In this thesis, a cutoff score of greater than or equal to 14 is used to classify a subject as depressed according to the guidelines established by Beck et al. [10].
One major limitation of all predictive evaluations in this thesis is that our predictions can be no better than the accuracy of the BDI reported by the subject. We must acknowledge this limitation, but we also see using the BDI for validation as a means to build credibility in objective measures. The long term goal would be to use biomarkers both to predict onset of depression and individual-appropriate intervention.
Other problems with the current clinician centered system are the delays before diagnosis is made, the availability of clinicians, and the infrequency of follow up. Huerta-Ramirez et al. [69] found an average delay of 9.89 weeks from time of symptom onset in a large study in Spain, and in Belgium only 14 percent of people sought treatment within a year of symptom onset[20]. With the diversity of qualitative measures and the reliance on variable professional opinion as the gold standard, there is a clear need for an objective, low cost, fast alternative for tracking depression.
0 1.2 Motivation and the Phoneme Rate Biomarker
Biomarkers derived from speech have shown predictive value in associating an individ-ual with a depression level (see Cummins et al. [33] for a review). Speech in particular is well suited as a source of biomarkers for mental illnesses because of its ease of collec-tion, and potential to scale globally by taking advantage of ubiquitous, wireless mobile devices (e.g. smart-phones). This thesis focuses on low level acoustic phenomenon, but other levels of communication analysis exist (e.g. language content and communication behaviors [37]), and should be considered in a full voice and language based assess-ment system. The array of candidate features that may be extracted from the voice include measures of voice quality, pitch stability and variance, clarity of speech, fluency, grammatical complexity, and level of interactivity with another person.
A person's overall speaking rate was one of the earliest investigated voice based biomarkers of depression because of its ease of measurement and hypothesized sign of psychomotor retardation. However, overall speaking rate has had mixed success as a depression biomarker. Neither Darby and Hollien [34] nor Nilsonne [95] found
ing rate useful, but Ellgring and Scherer [40] found speech rate increased in subjects recovering from depression. A review by Sobin and Sackeim [123] did find that de-pressed subjects had greater speech pause time, which would slow overall speech rate. Consistent with Sobin and Sackeim [123], Mundt et al. [93] found depression patients responding to treatment increased speech rate over baseline.
Trevino et al. [129] advanced the field by moving from gross measures of rate to fine grained measures of timing. Specifically, they analyzed the timing of individual units of speech, consonants or vowels. These individual units of speech sound or phonemes are spoken with different average durations. Collectively the timing differences have been called the phoneme rate biomarker because the average speed at which a person speaks a particular phoneme within their words and sentences is called a phoneme rate. Williamson et al. [144] then used the phoneme rate biomarker as part of the best de-pression prediction algorithm in an international competition for predicting dede-pression severity.
Despite the phoneme rate biomarker's success, there is little known about the neural mechanism by which phoneme rate control would be tied to depression severity. We ad-dress this open question through a functional magnetic resonance (fMRI) investigation of overtly produced, read, implicitly emotional speech in a depressed population. We aim to encapsulate the science behind this biomarker within a computational modeling framework. We believe that doing so may lead to features from the model that improve depression tracking. Ultimately, knowledge encapsulated in a model may help with treatment decisions.
M 1.3 This Thesis as a Framework
We propose this thesis as a framework in which to advance tracking of neuropsycho-logical disorders through computational models. The approach of this thesis is an example of how different disciplines can be profitably unified to understand the science behind phenomenology and summarize findings in ways that can be practically used. We bring together four components and use them together to understand the science and practical application of the phoneme rate biomarker. These components in general are the brain, a neuropsychiatric disorder, computational modeling, and quantitative biomarkers. This thesis makes these components concrete by focusing on depression, neurocomputational models of speech production, and the phoneme rate biomarker. However, the general principle of focusing on observed phenomenology and using a brain inspired computational model to identify it can be applied to other disorders.
M 1.3.1 Why Create Computational Models?
We stress that modeling is the glue that binds together observations and neurobiological knowledge. A computational model is a mathematically defined set of inputs, outputs, and the functions or algorithms that relate inputs and outputs. A neurocomputational model is a computational model whose inputs, outputs, and especially functions, are 19 Sec. 1.3. This Thesis as a Framework
constrained or inspired by neurobiological principles.
Neurocomputational models have several strengths. First, a neurocomputational model acts as a human interpretable summary of knowledge about the process under study. Such a summary demands clarity of thought about the process which facilitates additional knowledge acquisition and communication of understanding to to others. A model makes transparent the pieces of a system and the level of complexity at which the pieces are developed as well as the assumptions made about the system's rules. Consequently, models can point towards future experiments that should be taken as well as reveal characteristics of the system under study that are not in the data that was collected [981.
Second, with a summary of how a disorder interacts with different mechanisms of the rest of the system, researchers may be able to identify therapeutic interventions or make predictions about outcomes of interventions. This is a domain in which computational models are advantageous relative to qualitative models. Specifically, a neurocomputa-tional model allows in silico experiments. Some experiments may be too costly, danger-ous, or otherwise experimentally difficult to implement, but a model allows hundreds of variants of an experiment to be explored with no risk. With quantitative predic-tions about experimental intervenpredic-tions, models provide a direct means of comparing decisions. Computational models also allow reconciling quantitative experimental data with model predictions in order to refine model structure [98].
Third, a neurocomputational model enables inference from symptoms to mecha-nisms of symptoms. This is the particular practical use to which we apply neurocom-putational models in this thesis. A neurocomneurocom-putational model may permit an inverse solution in which observations are linked back to underlying causes. Importantly, the inverse solution of cause from effect may be ill-posed without using the constraints imposed by a neurocomputational model. A neurocomputational model's inherent con-straints act as a prior on what can be a possible causative mechanism. Consequently, decisions based on inference through models may be robust to noise and artifacts, and invariant under perturbations to the raw biomarkers themselves [98].
E 1.3.2 Computational Models in Psychiatry and Speech Production
In the field of computational psychiatry, others have proposed the use of computa-tional models to identify neuropsychological disorders [90, 140]. The general approach to inverse modeling the brain through observed behavior is outlined by Wiecki et al. [140],
Parameters of a computational model are fit to a subject's behavior on a suitable task or task battery. Different parameter values point to differences in underlying neurocircuitry of the associated subject or subject group. These parameters can be used either comparatively to study group differences (e.g., healthy and diseased) or as a regressor with, for example, symptom severity. Despite substantial development of several neurocomputational models of speech
l ll ll 'ImNpP illi in
Sec. 1.3. This Thesis as a Framework 21
Brain
Bhvior - Mdig
Figure 1.1: This thesis brings together three key elements and studies their relation-ships. These elements are neurobiology ("Brain"), behavioral responses, in particular speech ("Behavior"), and computational modeling ("Modeling").
production [61, 68, 76], and extensive analysis of the speech waveform to identify
neu-ropsychological disorders in the decades since some of the earliest publications (Parkin-son's disease, Canter [23]; depression, Darby and Hollien [34]), using neurocomputa-tional models of speech to identify disorders is virtually unknown in the speech analysis literature. G6mez-Vilda et al. [54] recognized that disorders with a neurological basis such as Parkinson's can impact speech output, and that parameters from a biomechan-ical model of the speech system could be informative. However, the brain is at the root of neuropsychological disorders, so we propose that computational models should emphasize the neural control of the speech production process and not be limited to a biomechanical model of the vocal source alone.
0 1.3.3 Research Approach of this Thesis
This thesis is a specific instance of a research framework that aims to understand the mechanisms of a neuropsychological disorder and the relationship of that disorder to observed symptoms through computational models. Figure 1.1 graphically depicts the three key components: the brain, a person's behavior as measured through his speech, and computational models that seek to unify neural and behavioral responses.
We used functional magnetic resonance imaging (fMRI) experiments to attempt to gain some neurobiological understanding that can be used to inform the model, and by using the model itself, we attempt to perform inference on the unobserved latent state of the person (e.g., the person's depression severity). In addition, providing new insight into methods of sensorimotor integration with cognitive processes may lead to better identification, tracking, and prediction of treatment efficacy not just for depression but also Parkinson's, Alzheimer's, traumatic brain injury (TBI), and autism, as examples. The brain, in all its complexity, is a difficult entity to understand. The brain can be studied at multiple levels, and this thesis approaches the brain at a system level. As a nucleating paradigm around which we could fashion a research program, we narrowly focused on one component of speech, phoneme rate, and one particular neuropyscho-logical disorder, depression. This narrow scope necessarily limited our explorations,
22 CHAPTER 1. INTRODUCTION
Acoustic Signal
*Analysis
Neural T 0rtq. Modeling
Activity h Machine Learning
P c i Quality Assurance .- Psychological
Assessment
Systens Level Understanding
fer Assessing Neuropsychological Disorders
Figure 1.2: This thesis aims to understand an individual at a systems level by applying analysis, modeling, machine learning, and quality assurance techniques to acoustic and neuroimaging observeables of psychological health.
but it did provide structure for our investigative techniques of analysis, modeling, and machine learning.
As shown in Figure 1.2, an individual is a complex system from which we can gather multiple (noisy) measurements. We collected an assessment of psychological health through a self-reported depression inventory, neural activity through task-based fMRI, and speech production function through acoustics. Then, we sought to relate our available measurements to psychological health both directly and through models that attempted to capture operational mechanisms within these domains. A particular challenge to this thesis because of its system level approach is the complexity of the big picture. From data collect to processing, we must be cognizant of the input data quality and the appropriateness of the processing algorithms to be confident our results are meaningful. While any individual modality could have been developed in-depth, we chose a system level approach as an opportunity to relate different disciplines in order to use speech to track neuropyschological disorders.
E 1.4 Summary of Contributions
This thesis makes contributions to data collection, analysis, and modeling that support our conceptual advance: the introduction of neurocomputational models for neurologi-cal disorder assessment to the speech analysis community. We advocate this method as a powerful, general research framework for unifying investigations across disorders and experiments within a quantitative, model-based framework. We first proposed this idea in Williamson et al. [145] as part of a larger effort to assess Parkinson's severity, and have since developed this idea as discussed below with a particular focus on phoneme rate and depression.
Established a multi-faceted MRI and voice data collection
We establish a multi-faceted dataset of a variety of tasks in a depressed and control pop-ulation. Using the state-of-the-art fMRI acquisition technique of simultaneous
multi-slice acquisition, we collect eight task-based functional MRI runs as well as a resting scan, a diffusion weighted imaging scan, and structural scans. A defining feature of our protocol was the inclusion of six overt speech production tasks intended to elucidate how depression interacts with the brain during different aspects of speech production. These aspects included speech rate, prosody (the rhythm and timing of speech), and sequencing (how vowels and consonants are synthesized into syllables and words). Characterized the phoneme rate biomarker and its neural basis
We perform a replication study to assess the viability of the phoneme rate biomarker, and go beyond previous studies in this area to assess the generalizability of the phoneme rate biomarker across different read passages. We analyze fMRI and acoustic data from one of the fMRI tasks, overt production of implicitly emotional sentences. We study the interaction of depression, phoneme rate, and stimulus valence to advance our scientific understanding of the phoneme rate biomarker with a view towards using this knowledge to build a computational model to aid in tracking depression. We achieve a receiver operating characteristic area under the curve (ROC AUC) of 0.73.
Created models of vocal source control and phoneme rate control, and a predictive model of depression severity from speech
We have applied the neural control framework to the vocal source. To do so, we de-veloped an approximation to the vocal source as a new element to the computational model of speech production. This approximation focuses on the neural control of the biophysical model of the vocal source. Different than Larson et al. [79], our full neural model of source control includes both this biophysical source model, and the sensori-motor transformation between acoustic and sensori-motor space. We then applied this vocal source model to both depression and Parkinson disorder with some promising results [29]. We develop a model of phoneme rate variability that integrates phonemes, rate, and sensorimotor processing with an algorithm that allows fitting the model to an individual's speech.
We compare the features derived from model-based and model-free features. We answer the question of how model-based features compare to model-free features and consider whether model-based features add value when combined with model free fea-tures. We find peak ROC AUC performance on model-free features of 0.82, and peak performance using phoneme rate model features of 0.55.
0 1.5 Thesis Organization
Chapter 2 presents an analysis of the phoneme rate biomarker on read speech. Chap-ter 3 moves into the neuroscience facet of the thesis with an fMRI investigation of the phoneme rate biomarker. Chapter 4 creates a neurocomputational model for the phoneme rate biomarker. Chapter 5 takes this thesis's work in neurocomputational modeling and the phoneme rate biomarker into a full-featured, voice-based, depression 23
CHAPTER 1. INTRODUCTION 24
analysis system. It compares model-based and model-free vocal biomarkers of depres-sion. Chapter 6 summarizes the thesis's contributions and highlights promising research directions.
Chapter 2
Characterization of Phoneme Rate
in Read Speech
N this chapter, we consider two issues that have practical bearing on how the phoneme rate biomarker might be applied in real applications. First, we consider how passage duration affects the ability to discriminate between depressed and control subjects. How many seconds of speech are needed for accurate assessment of depression severity? How does accuracy of assessment relate to number of seconds of analyzed speech? Second, we consider how stable phoneme rate features are across different read passages. Does an assessment tool designed using one speech passage generalize across passages?
Section 2.1 formally defines phoneme rate and related terminology. Section 2.2 describes the experiment setup and analysis procedures. Section 2.3 presents results, and Section 2.4 concludes the chapter with a discussion.
* 2.1 Basic Definitions
Previously we had described a phoneme as the sound of a consonant or vowel, and phoneme rate was the rate at which a person spoke a particular consonant or vowel. In this section, we formalize our terminology.
A phone is a speech sound, and it is the shortest speech sound distinguishable from other speech sounds based purely on the acoustic properties of the sound [132]. A set of phones has been defined by the International Phonetics Organization Association (IPA) to represent essentially all the sounds found among all the world's languages. Each language only uses a subset of phones from among all possible phones [6].
A phoneme is different than a phone. A phoneme is the shortest speech sound that distinguishes one word from another within a language. Whereas a phone is con-stant across languages, a phoneme is language dependent. One or more phones may correspond to the same phoneme [28].
This thesis recognizes 39 phonemes for the English language and a 4 0th phoneme to represent silence. The IPA has designated symbols for each phone in its alphabet, but for computational ease, this thesis represents phonemes using the ASCII friendly Arpabet notation of one or two alphabetic characters per phoneme. An example of each of the phonemes along with a word that uses the phoneme in Arpabet notation is in
CHAPTER 2. CHARACTERIZATION OF PHONEME RATE IN READ SPEECH
"Colors"
E 0*W E I 0K
AH
L
ER
Z
Time (600 ms)Figure 2.1: Phoneme annotated example of the word "colors." The top row shows the amplitude vs time of the utterance. The middle row shows the spectrogram of frequency vs time with darker regions corresponding to greater energy. The bottom row shows each automatically identified phoneme label and its phoneme boundaries in Arpabet notation.
Table 2.1 from the Carnegie Mellon University (CMU) pronunciation dictionary [81]. Arpabet phonemes will be represented with capital letters, and they will be surrounded by square brackets outside of tables and figures. We represent the "silence" phoneme as [H#] or with an asterisk, [*].
Phonemes are identified automatically from spoken utterances using a proprietary phoneme recognizer [118]. An example of the output of the program is shown in Figure 2.1.
The phoneme recognizer solves two challenges. It must identify the phoneme start and stop boundaries and label the phoneme itself. This is in contrast to other forms of phoneme alignment or recognizers that use a transcript of the text to know which phonemes to identify in which order. These other forced alignment algorithms then only need to solve the boundary placement problem. We chose to use a transcript-free phoneme aligner because in practical cases a transcript is not going to be available. Furthermore, a transcript assumes that all individuals pronounce a word and all its phonemes according to the dictionary's pronunciation. Regional dialects and speaking habits can cause the same word to be pronounced with different phonemes. A forced alignment program can mistakenly attempt to identify boundaries of phonemes that are not present as well as miss inserting phonemes that were not in the forced aligner's transcript.
Table 2.1: Examples from the CMU pronunciation dictionary of the 39 phonemes and silence (the 4 0th "phoneme") in this thesis [81].
Arpabet Example Word Example Pronunciation
Phoneme ' Abbreviation AA odd AA D AE at AE T AH hut HH AH T AO ought AO T AW cow K AW AY hide HH AY D B be BIY CH cheese CH IY Z D dee D IY DH thee DH IY EH Ed EH D ER hurt HH ER T EY ate EY T F fee FIY G green G R IY N HH he HHIY IH it IH T IY eat IY T JH gee JH IY K key K IY L lee L IY M me M IY N knee N IY NG ping P IH NG OW oat OW T OY toy T OY P [pea] P IY R read R IY D S sea S lY SH she SH IY T tea T IY TH theta TH EY T AH UH hood HH UH D UW two T UW V vee V IY W we W IY Y yield Y IY L D Z zee ZIY ZH seizure S IY ZH ER H#, * <silence>
CHAPTER 2. CHARACTERIZATION OF PHONEME RATE IN READ SPEECH
Phoneme rate is the rate at which an individual phoneme is spoken. To compute the phoneme rate for the jth phoneme in our alphabet of 40 phonemes, we count the total number of times the phoneme is spoken over the course of an utterance and divide by the total amount of time spent saying that phoneme. Let D be the set of durations of every instance of every phoneme in the utterance, let Dj be the subset of D that is the set of durations of every instance of phoneme
j,
and let dij be the duration of theith instance of the jth phoneme. Then the phoneme rate for phoneme
j
isr =~j (2.1)
where .- represents cardinality of the set.
The reciprocal of phoneme rate is mean phoneme duration, which is the average amount of time spent pronouncing each phoneme. Because phoneme duration is mea-sured per phoneme, taking the mean is just one summary descriptor for the collection of durations associated with a given phoneme. Other summary statistics include the median, standard deviation, interquartile range, maximum, and minimum.
In addition to phoneme rate, there are two other important measures of speech rate: speaking rate and articulation rate. Speaking rate is the total number of non-silent phonemes spoken divided by the total time of the entire utterance, including the silence between words and sentences:
rspeak = = >j 1 (2.2)
By contrast, articulation rate is the same as speech rate except total duration ex-cludes silence:
rart =- . (2.3)
E
2.2 MethodsIn this section, we cover our experimental protocol and analysis procedures for charac-terizing phoneme rate as a biomarker of depression.
* 2.2.1 Protocol
Subjects read aloud "My Grandfather" [35, 138], "The Rainbow" [42], and "The Cater-pillar" [99] into a laptop's built-in microphone at a self-paced speed and volume. These three passages were selected for their wide use and long history in the speech community. In particular, they have been used for tracking neuropsychological disorders through the voice. Each subject also completed a Beck Depression Inventory II questionnaire to determine depression severity. A BDI score greater than or equal to 14 was used 28
Table 2.2: Linguistic characteristics of the read passages determined from readability-score.com.
Attribute Rainbow Caterpillar Grandfather
Nominal 2:38 1:43 1:02
Speaking Time (mm:ss)
Sentiment Neutral Neutral Neutral
(Slightly (Slightly (Slightly Positive) Positive) Positive)
Flesch-Kincaid 7.8 4.8 6.4 Grade Level Sentence 19 16 8 Count Words per 17.4 12.2 16.4 Sentence Syllables per 1.4 1.3 1.3 Word
as the depression cutoff [10]. Additionally, each subject completed a battery of other questionnaires that were not analyzed as part of this study. Study data were collected and managed using REDCap electronic data capture tools hosted at MIT [64,97], and this study had MIT Institutional Review Board approval.
Our aims with the read passages were to identify which of the standard read passages is best used to identify depression and to understand why a passage is successful for identifying depression. These passages may differ in emotionality, length, and complex-ity of writing. A highly emotional passage may cause different responses from depressed or control subjects. Longer passages provide more speech over which to compute speech features, so we would anticipate estimates would be less variable. Complex writing both in terms of word and sentence structure will have more demanding motor requirements than simple words and sentences. Therefore, the more emotional, longer, and more complex a passage, the greater the accuracy with which we would expect to classify depressed vs control subjects.
We characterize these attributes using an available analysis service, readability-score.com. The results from this service for the Grandfather and Rainbow passages agreed well with a published study by Ben-David et al. [11]. Unfortunately, the Cater-pillar passage was not part of Ben-David et al. [11]'s study, so we present in Table 2.2 all the results from readabilityscore.com for comparability across all our passages.
We observe that all three passages have similar syllables per word at around 1.3, and similar sentiment, which is essentially neutral. However, they differ markedly in terms of their nominal speaking time and in their grade level difficulty. The Rainbow passage 29
CHAPTER 2. CHARACTERIZATION OF PHONEME RATE IN READ SPEECH
is more than twice as long as the Grandfather passage and about fifty percent longer than the Caterpillar passage. Because of their similar emotional content but varying lengths we can test for the influence of passage duration on depression classification
performance.
We used the Flesch-Kincaid (F-K) system to evaluate reading difficulty [74]. The F-K system is a weighted sum of words per sentence and syllables per word, and it is widely used for evaluating the difficulty of comprehension of written material. We observe that the Rainbow passage is at a 7.8 US grade level vs the 6.4 grade level of the Grandfather passage and the 4.8 grade level of the Caterpillar passage. The small disparity in reading levels may be a confound to passage length, but given that all our subjects are adults, we do not anticipate this to be an influential variable.
0
2.2.2 Vocal Biomarkers
Phonemes were automatically identified and segmented using an automatic phoneme recognizer described previously. For each of the 39 phonemes and silence, which we counted as a 4 0th phoneme, we computed the mean phoneme duration. We also
com-puted a phoneme based speaking rate and articulation rate.
* 2.2.3 Direct Comparisons with Prior Art
We have mentioned that phoneme rate was first explored by Trevino et al. [129], and then later by Williamson et al. [144]. In this section, we follow their respective method-ologies to facilitate direct comparison of our study's results with their findings.
Comparison with Trevino et al. [129]
Trevino et al. [129] studied 35 subjects in an English free speech task whose depres-sion severity was quantified by a clinician administered Hamilton Depresdepres-sion Scale as-sessment (HAMD). This study's metric differed from our use of the Beck Depression Inventory-Il (BDI), which is a self-report score. We chose to use the BDI over the HAMD because self-report scores can scale to assessing patients worldwide since a clin-ician is not required. Our phoneme recognizer is the same recognizer employed by Trevino et al. [129] in their study.
Trevino et al. [129] created an aggregate phoneme rate biomarker based on correla-tions of individual phoneme rates with the HAMD. For each phoneme, the phoneme's mean duration was computed per subject. Then, these subject specific mean durations were correlated per phoneme against the subject HAMD scores using a Spearman cor-relation. If a phoneme was significantly correlated (p < 0.05) with the total score, it was added to the set of phonemes that would be aggregated. The sign of the correlation was also noted. Once all the phonemes to be aggregated were identified, the phonemes were combined per subject by creating a signed weighted sum of the mean phoneme durations. Weights were either
+
1 or -1 depending on the sign of the phoneme's uni-variate Spearman correlation. The formula for the aggregate or fused mean phoneme 30duration biomarker, LTrevino, is
nsig
LTrevino = an L (2.4)
n=1
where neig is the number of significantly correlating phonemes, on is the sign of the Spearman correlation, and Ln is the mean duration of the nth significantly correlating phoneme.
Both univariate significance testing and aggregation were also computed by Trevino et al. [129] to determine an aggregate mean phoneme duration for the psychomotor retardation (PMRT) HAMD subscore. Our study did not have the HAMD available, so we followed the same methodology but correlated against the BDI.
Comparison with Williamson et al. [144]
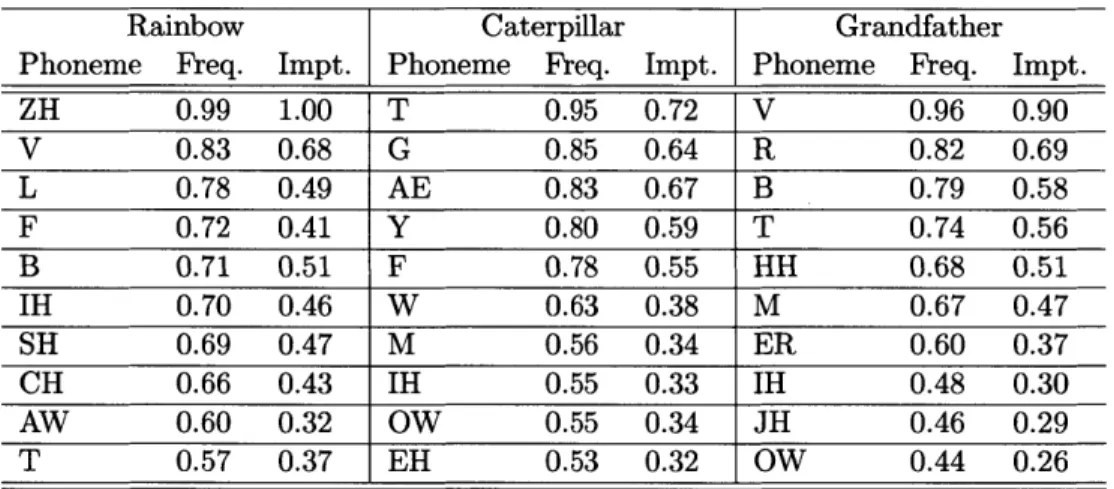
Williamson et al. [144] studied phoneme rate among other vocal biomarkers of depres-sion in a population of German speakers. In the analyzed speech, the subjects read one German passage in German, and also responded in German to a free response set of questions. The depression severity metric was the Beck Depression Inventory II, and Williamson et al. [144] used the same phoneme recognizer as Trevino et al. [129] and our study. Williamson et al. [144] followed a similar but not identical procedure to Trevino et al. [129] in deriving an aggregate phoneme duration measure. Rather than performing a significance test, they picked the top phonemes with the largest absolute values of a univariate Pearson correlation with the BDI. They then combined these phoneme durations using a signed weighted sum. They used the sign of the Pearson correlation and the magnitude of the correlation when computing the weight. Their formula is
fltop . ( n
Liiamsn sign (Rn)
Ln=1 1 - R2(2.5)
n=1 n
nt, was chosen as 6 for the read passage and 10 for the free speech passage. We show results using the top 6 phonemes.
0
2.2.4 Machine Learning
To evaluate the utility of phoneme rate as a biomarker of depression, we must move beyond the correlation analyses just discussed. In those analyses, we were only assessing whether the phoneme rate biomarker correlates with depression severity. However, those correlations provide an optimistic view of the biomarker's utility in practice. To assess how well the biomarker would do in classifying a subject as depressed or not depressed, we must construct a classifier that returns a binary decision on a previously unseen
subject.
Ideally, we would have so many subjects that we could construct a classifier on a training set of subjects and then test the classifier's performance on a held out test set
CHAPTER 2. CHARACTERIZATION OF PHONEME RATE IN READ SPEECH
Training
Data
-Data Pre-processing Feature Classifier
Selection Construction
~LE
Test Pre-processing Feature Prediction
Data -Selection
Figure 2.2: The machine learning pipeline operates within a shuffle-split cross-validation loop, so parameters from the processing stages that operate on training data (top row) are applied to the test subjects (bottom row). Raw feature vectors are pre-processed before feature selection, feature fusion, and classifier construction.
of subjects. Instead, our small sample size drives us to use shuffle-split cross-validation. Shuffle-split cross-validation splits the available data into a train set and test set. The classifier is trained on the training set and tested on the test set to derive performance metrics. Then, the entire dataset is randomly split again into a train set and test set. The new train set will partially overlap with the previous train set, and the new test set will partially overlap with the previous test set. Shuffle-split differs from K-fold cross-validation in that the test sets in shuffle split have overlapping subjects. However, shuffle split allows many more folds of the data to be tested by relaxing this constraint, and consequently provides a more complete picture of the variability of performance than K-fold cross-validation.
Our machine learning pipeline consists of the following stages: pre-processing, fea-ture selection, classifier construction, and classifier performance evaluation. Each of these steps is performed within a shuffle-split cross-validation loop, so, for example, processing parameters are derived using all the training subjects, and then the pre-processing parameters are applied to the test subjects. Figure 2.2 shows a graphical description of the process that we now describe in detail.
Pre-processing through Classification
For a single shuffle-split fold, we divide the dataset such that 83 percent of the subjects are used for training and 17 percent of the subjects are used for testing (for a 30 subject
![Table 2.1: Examples from the CMU pronunciation dictionary of the 39 phonemes and silence (the 4 0 th "phoneme") in this thesis [81].](https://thumb-eu.123doks.com/thumbv2/123doknet/14245187.487445/28.918.263.690.249.941/table-examples-pronunciation-dictionary-phonemes-silence-phoneme-thesis.webp)

![Table 2.6: Williamson et al. [144] reported Pearson correlations of fused mean phoneme durations with the BDI scale on the Audio Visual Emotion Challenge (AVEC) depres-sion dataset [133]](https://thumb-eu.123doks.com/thumbv2/123doknet/14245187.487445/39.918.171.726.729.952/williamson-reported-pearson-correlations-phoneme-durations-emotion-challenge.webp)