HAL Id: hal-00299338
https://hal.archives-ouvertes.fr/hal-00299338
Submitted on 1 Dec 2005
HAL is a multi-disciplinary open access
archive for the deposit and dissemination of
sci-entific research documents, whether they are
pub-lished or not. The documents may come from
teaching and research institutions in France or
abroad, or from public or private research centers.
L’archive ouverte pluridisciplinaire HAL, est
destinée au dépôt et à la diffusion de documents
scientifiques de niveau recherche, publiés ou non,
émanant des établissements d’enseignement et de
recherche français ou étrangers, des laboratoires
publics ou privés.
Systems during the 10 June 2000 event
T. Rigo, M. C. Llasat
To cite this version:
T. Rigo, M. C. Llasat. Radar analysis of the life cycle of Mesoscale Convective Systems during the 10
June 2000 event. Natural Hazards and Earth System Science, Copernicus Publications on behalf of
the European Geosciences Union, 2005, 5 (6), pp.959-970. �hal-00299338�
SRef-ID: 1684-9981/nhess/2005-5-959 European Geosciences Union
© 2005 Author(s). This work is licensed under a Creative Commons License.
and Earth
System Sciences
Radar analysis of the life cycle of Mesoscale Convective Systems
during the 10 June 2000 event
T. Rigo and M. C. Llasat
GAMA Team, Dept. of Astronomy and Meteorology, University of Barcelona, Avda. Diagonal, 647, 08028 Barcelona, Spain Received: 1 April 2005 – Revised: 1 August 2005 – Accepted: 1 September 2005 – Published: 1 December 2005
Part of Special Issue “HYDROPTIMET”
Abstract. The 10 June 2000 event was the largest flash flood
event that occurred in the Northeast of Spain in the late 20th century, both as regards its meteorological features and its considerable social impact. This paper focuses on analysis of the structures that produced the heavy rainfalls, especially from the point of view of meteorological radar. Due to the fact that this case is a good example of a Mediterranean flash flood event, a final objective of this paper is to undertake a description of the evolution of the rainfall structure that would be sufficiently clear to be understood at an interdisci-plinary forum. Then, it could be useful not only to improve conceptual meteorological models, but also for application in downscaling models. The main precipitation structure was a Mesoscale Convective System (MCS) that crossed the region and that developed as a consequence of the merging of two previous squall lines. The paper analyses the main meteo-rological features that led to the development and triggering of the heavy rainfalls, with special emphasis on the features of this MCS, its life cycle and its dynamic features. To this end, 2-D and 3-D algorithms were applied to the imagery recorded over the complete life cycle of the structures, which lasted approximately 18 h. Mesoscale and synoptic infor-mation were also considered. Results show that it was an NS-MCS, quasi-stationary during its stage of maturity as a consequence of the formation of a convective train, the dif-ferent displacement directions of the 2-D structures and the 3-D structures, including the propagation of new cells, and the slow movement of the convergence line associated with the Mediterranean mesoscale low.
1 Introduction
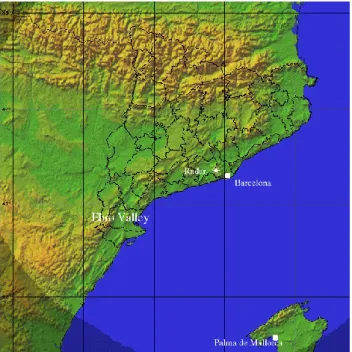
During the dawn of 10 June 2000 there occurred a heavy rainfall over Catalonia (NE Spain, Fig. 1) that caused se-rious damage due to rainfall, floods, landslides and debris Correspondence to: T. Rigo
flows. The episode caused material damage estimated at over 65 000 000 EUR, and there were five fatalities. Tak-ing into account the accumulated rainfall, the affected area and the damage produced, it can be classified as a catas-trophic flood episode (Llasat and Puigcerver, 1994). The most marked hydrometeorological feature was the consider-able intensity of sustained precipitation, with accumulated hourly quantities of over 100 mm. The maximum accumu-lated rainfall between 21:00 UTC 9 June and 21:00 UTC 10 June was 224 mm (Fig. 2), of which more than 200 mm were recorded in less than 6 h. A more detailed evolution of the rainfall at surface is shown in Llasat et al. (2003). This case is considered to be the most important heavy rainfall event arising in spring in the region during the 20th century, al-though other such spring events have been recorded in the previous centuries (Llasat et al., 2003). It is a good exam-ple of a Mediterranean flash flood, and for this reason it has been proposed as a case for study within the framework of various national and international projects, as is the case of the European project HYDROPTIMET. Although some pa-pers devoted to this case have already been published (Sem-pere Torres et al., 2000; Llasat et al., 2001, 2003; L´opez and Ar´an, 2005), this is the only one devoted to analysis of the dynamic of the rainfall structures, with special emphasis on their internal structure and life cycle. Knowledge of it could help to improve both the nowcasting of future events and the downscaling process applied to the hydrological models.
With this aim, the observations made by the meteorologi-cal radar located in the affected region were used. The radar imagery allows identification of the main precipitation struc-tures, such as mesoscale convective systems, MCS. From the meteorological radar point of view, Houze’s definition of MCS (1993) is generally accepted, describing an MCS as a precipitation structure that contains convective and strati-form precipitation regions at some stage of its life and has a major axis with a length equal to or exceeding 100 km for 3 h or more. Rigo and Llasat (2004) proposed that a mini-mum of 30% of the area covered by the MCS in each image should be associated with convective rainfall. This condition
Fig. 1. Orographic map of Catalonia with the INM-radar location.
Barcelona, Palma de Mallorca and the Ebro Valley are also shown.
has been added in order to eliminate those structures domi-nated by stratiform precipitation, which are usual in winter and have a completely different dynamic.
In relation to the different stages of a MCS from the radar point of view, Leary and Houze (1979) found that the life cy-cle is divided in four phases: formation, intensification of the convection, maturity, and dissipation. Hilgendorf and John-son (1998) presented a different separation of the stages of a MCS: three initial stages of growth (with similar time dura-tion), a maturity phase and a decay stage. In the same study it was suggested that the time of initiation is the moment when the convection presents a certain degree of organisation.
Regarding the initiation process, Loehrer and Johnson (1995), within the framework of the OklahomaPRE-STORM experiment, showed that the organization of the convection into the system could be of four types: linear, back-building, disorganized, and intersecting convective bands. A simi-lar classification for MCSs in Switzerland was presented by Schiesser et al. (1995), although they did not include the last kind. In relation to the mature stage, the first classification of the MCS concerns the degree of symmetry of the squall line (Houze et al., 1989), considering two types: symmetric, which presents a line on the flank that is well-defined and slightly curved at the central part, where the most active con-vection develops; and asymmetric, showing a more active wing, in which the cells included are affected by a strong atmospheric instability. Later, a classification based on the position of the stratiform region in front of the movement of the MCS during the mature phase was proposed by Rigo and Llasat (2004), taking into account the proposals of Parker and Johnson (2000) and Schiesser et al. (1995): TS (with trailing stratiform area), LS (leading stratiform region) and NS (with
Fig. 2. Distribution of accumulated rainfall between 21:00 UTC on
9 June 2000 and 21:00 UTC on 10 June 2000. The shaded area was the most severely affected.
practically no stratiform precipitation). A specific case of the NS class would be when the stratiform region is located on a flank of the convective line and its movement is parallel to this one of the convective region.
This paper presents the different stages of the convective structures that produced the heavy rainfalls, following the Leary and Houze (1979) proposal and the classification for the maturity stage shown in Rigo and Llasat (2004). Due to the fact that the criteria and radar algorithms applied to an-alyze the 2-D and 3-D structures were also shown in Rigo and Llasat (2004), the complete explanation about them will not be included here. A first section shows data and a short explanation of the methodology. The second section shows the environment prior to development of the first MCSs, es-pecially from the point of view of the thermodynamic and mesoscale features. The following sections show the differ-ent stages of the precipitation systems: formation and early stages, maturity stage and merging of both MCSs, the most active stage of the new MCS and the final stage of the system over the area of study. Finally, some concluding remarks are presented.
2 Data and methodology
The meteorological radar is situated 20 km away from Barcelona City, in the Northeast of Spain, at an altitude of 654 m a.s.l. (Fig. 1). It belongs to the radar network of the Spanish Weather Service (INM), and it operates in C-band. The radar implements 20 elevations (PPIs) in each cycle of data collection. This cycle has a duration of 10 min, and in-cludes a scanning in normal mode (reflectivity), another in Doppler mode (radial wind), and, finally, processing of the information. From these PPIs an interpolation procedure is undertaken in order to obtain 12 CAPPIs (the radar volume used in this study), with a gap of 1 km at the first levels and 2 km in the highest ones (CAPPI altitudes range between 0.8 and 15.8 km). The range of the images is 240 km and the
pixel size is 2×2 km2. The procedure applied to deal with the present study is based on application of specific algo-rithms that allow a distinction to be made between pixels as-sociated with convective or stratiform precipitation. Images were slightly corrected previously by the INM and the main ground echoes were eliminated using a ground clutter mask created previously (Sanchez-Diezma, 2001). Next, a proce-dure was applied in order to convert the polar coordinates of the raw images to Cartesian coordinates. Once this conver-sion had been made, a 2-D procedure was applied to the low-est PPI to distinguish between pixels associated with convec-tive or stratiform precipitation. The 2-D process (Rigo, 2004; Rigo and Llasat, 2004) is an adaptation of the SHY algorithm (Steiner et al., 1995) to identify convective pixels. It takes account of three requirements, and one pixel is considered “convective” if it verifies at least one of them. Firstly, the 43 dBZ reflectivity threshold should be surpassed by some contiguous pixels in order to have a minimum size for the “convective” pixel, with a radius of 10 km. Secondly, a pixel that does not exceed the “convective” threshold is labelled as “convective” if the difference between its value and a mean value of its background exceeds a considered function, which depends on the background reflectivity and the radar charac-teristics. The third requirement considers that if there are some “convective” pixels adjacent to the analysed pixel, the latter could be considered as “convective”. Once the three requirements had been applied to all the pixels, those that did not verify any of them but that had a reflectivity above 18 dBZ were classified as “stratiform”. Those pixels with re-flectivity below 18 dBZ had been considered as “drizzle” or “no-precipitation”. The last feature to validate the appropri-ateness of the selected convective region uses the entire radar volume and considers the vertical gradient of the reflectivity, following the proposal of Biggerstaff and Listemaa (2000). The objective is to re-classify those pixels associated with the bright band as stratiform ones. Only precipitation struc-tures of more than 32 km2are considered.
The 3-D procedure was applied taking account of the fol-lowing aspects (Johnson et al., 1998; Rigo, 2004). Firstly, it aims to select in each level those pixels (labelled as “con-vective”) that exceed one of the various reflectivity thresh-olds (30, 35, 40, 45, 50, 55 and 60 dBZ), in order to find the cell’s core. Then, for each region with “convective cores”, the method selects the zones that have the same reflectivity value as the core for 6 pixels or more, that is 24 km2. If there are fewer than 6 pixels for a reflectivity threshold, the method automatically selects the next reflectivity value. The pixels that do not reach the core threshold cannot be consid-ered as a part of the “convective core”. Finally, if the cell has been detected in more than one level, the algorithm takes it as a valid convective cell. If a gap of one level exists, the algo-rithm considers the two nearest cells in the vertical as being the same.
The pluviometric data were obtained from the Automatic System of Hydrologic Information (SAIH) of the Catalan Water Agency (Agencia Catalana de l’Aigua). Besides other hydrological sensors, this network comprises 126
tipping-bucket automatic raingauges for rainfall exceeding 0.1 mm. The precipitation is accumulated and registered every 5 min. The information is stored in hourly files, which include the code of the station, the date, a validation code, and the 5-minutal rain rate registered. Charts for each 10-min period were obtained using a krigging method.
3 Meteorological environment and pre-storm stage
As the complete synoptic description of the event is shown in Llasat et al. (2003), and in other contributions to this is-sue connected with the EU Project Hydroptimet, only the most significant features for understanding the evolution of the MCS will be commented upon here. Before the devel-opment of the two MCSs, which occurred at 22:00 UTC on 9 June 2000, the synoptic and mesoscale environments were the ones common to the heavy rainfall events that usually af-fect Catalonia (Ramis et al., 1994; Llasat et al., 1996). Of those characteristics, the following may be noted: the exis-tence of an anticyclone over Central Europe that affected the Mediterranean region, and the presence of a trough over the centre of the Iberian Peninsula; very wet and warm advection at low levels from the Southeast with high values of Con-vective Available Potential Energy (CAPE) and Precipitable Water Mass (PWM) at all levels; considerable instability re-vealed by the Lifted Index (LI); and, finally, the usual pres-ence of a Mediterranean mesoscale cyclone to the Southeast of Catalonia (Jans`a et al., 1996; Rigo and Llasat, 2003).
The best-known events have been registered in late sum-mer or, especially, in autumn, when the atmospheric condi-tions are more favourable to the occurrence of heavy rains in Catalonia (Llasat et al., 2000; Jans`a, 1997). The case anal-ysed here occurred in spring and differed from the autumn cases mainly by the presence of cold air in the middle tro-posphere, which is not necessary for the autumn events. Al-though spring is not the usual season for extreme heavy rain-falls in Catalonia, some results obtained from the historical climatology records show that at least one spring catastrophic event has been recorded every century, as was the case of the catastrophic event of May 1853 (Llasat et al., 2003).
Besides this June case, the most important floods recorded in Catalonia in the last 60 years were the events of 25 September 1962, 20–23 September 1971, 6–8 November 1982 and 2–5 October 1987 (Llasat, 1987, 1990, 1991; Ramis et al., 1994). Table 1 shows a comparison of the ther-modynamic features of the June 2000 event and some other severe events. In particular, it shows the minimum value of the LI, the maximum value of the CAPE, and the Precip-itable Water Mass (PWM) between different levels: surface-850 hPa, surface-850 hPa–700 hPa and 700 hPa–500 hPa. The ob-tained values are for the Palma de Mallorca sounding (sit-uated 200 km to the Southeast of Catalonia), due to the fact that the Barcelona sounding started in 1997 and during the 9 and 10 June 2000 the strong winds over Barcelona pre-vented radiosounding launching. In spite of the distance, the magnitudes are quite representative of the atmospheric
char-Table 1. Thermodynamic features of the June 2000 event and some other severe events. All the values correspond to the Palma de Mallorca
radiosonde, except the last one (Barcelona). In this last case the sounding only arrived until 600 hPa. All the soundings have been made at 00:00 UTC. Event LI CAPE (J/kg) PWMsrf −850(mm) PWM850−700(mm) PWM700−500(mm) September 1962 −4.5 1800.0 12.3 7.6 3.1 September 1971 −7.9 2641.9 16.6 8.0 2.4 September 1980 −6.0 1547.4 19.6 8.5 6.7 August 1981 −3.9 878.5 17.9 10.0 5.9 October 1982 −5.0 2904.4 17.6 8.8 7.0 September 1986 −5.6 2426.7 18.3 11.3 9.0 June 2000 −4.3 1922.0 16.8 5.7 3.9 June 2000 (Bcn) 0.5 820.2 15.8 7.5 3.4
Fig. 3. Sea level pressure analysis (isobars every 2 hPa) on 10 June
2000 at 12:00 UTC for the HIRLAM(INM)-0.5◦Model.
acteristics, as has been demonstrated in previous papers (e.g. Ramis et al., 1994). In all cases, the LI indicated moderate or high instability (the threshold is −3), confirming a high prob-ability of risk of thunderstorms in the area. The June 2000 event did not present the most significant value, but was quite similar to the September 1962 case, which is the most catas-trophic flash flood recorded in Spain during the 20th century, with more than 815 fatalities. The other magnitudes present similar features, all of them indicators of high instability.
Figure 3 shows clearly the typical meteorological config-uration at the surface discussed previously. First of all, the presence of an anticyclone over Central Europe, producing a blocking effect over the low that came in from the Atlantic. In this situation, the low remains stationary to the NW of the Iberian Peninsula and produces a flow that, combined with the orography, triggers a mesoscale cyclone in the Mediter-ranean, generally towards the north of Algeria (Picornell et al., 2001). This mesocyclone tends to move northward, and depending on its movement (Jans`a et al., 2001), Catalonia or another neighbouring region would be affected by heavy rains and strong winds. In the case that affects Catalonia, the typical movement of the cyclone is from SW to NE, moving
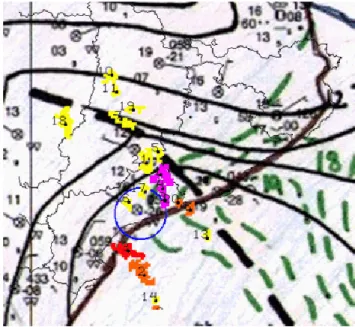
Fig. 4. Detail of the surface low showing the convergence line
(black discontinous line) and the cells (in different colours) that de-veloped over it on 10 June 2000 at 00:00 UTC. Green discontinous lines show the dew point temperature, black lines are isobars.
quasi-parallel to the coast. The case of June 2000 shows the strong influence of this kind of surface low on the evolution of the precipitation structures. The inflow introduced by the low could be considered as a low level jet (LLJ), because it arrived at 35 kt at 925 hPa, and would be one of the most influential factors in the development of the degree of sym-metry (Hilgendorf and Johnson, 1998). On the other hand it gave way to a convergence line where the cells developed, and the movement and maturity phase of the MCS were re-lated with the movement of the low and of the convergence line (Fig. 4).
4 The early stages
At 21:00 UTC on 9 June 2000, a front associated with the Atlantic low reached Catalonia from the west, as can be
ob-Fig. 5. Echotop20 at 21:00 UTC on 9 June 2000.
Fig. 6. Zmaxat 22:00 UTC on 9 June 2000. The rectangle shows
the area presented in Fig. 7.
served in the Echotop20 (the maximum altitude where the 20 dBZ threshold is exceeded) image (Fig. 5). In this fig-ure it is possible to appreciate the moderate vertical devel-opments (close to 11 km) of the reflectivity echoes included in the frontal band. The adjective “moderate” has been used in comparison with the high Echotop20 values achieved over the mature phases leading to the event, but it would be an extraordinary value compared with the typical ones achieved in a frontal band (Echotop20 normal values do not exceed usually 6 or 7 km). The maximum values of the Echotop20 (11.3 km), and also of the reflectivity (50 dBZ), were regis-tered at the Southern part of Catalonia. In this area, the warm and moist flow coming from the Mediterranean reached in-land through the Ebro Valley (Fig. 1). By 22:00 UTC two MCS had already developed. One MCS (MCS-2 in Fig. 6) formed over the frontal region. At the same time, another
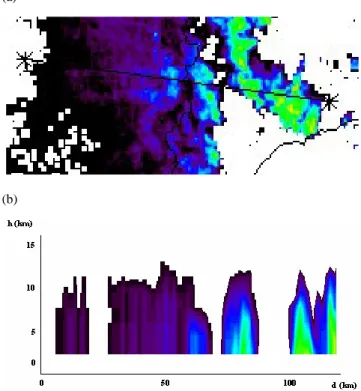
(a)
(b)
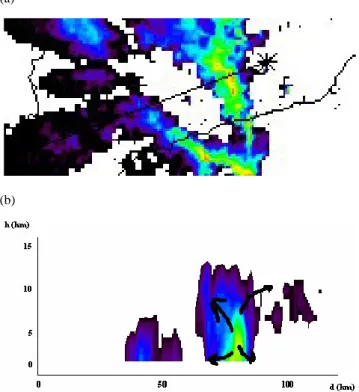
Fig. 7. Vertical section at 22:00 UTC on 9 June 2000 (b) of the line
marked in the CAPPI image at 1 km (a).
MCS (MCS-1 in Fig. 6) had developed over a convergence line formed approximately 30 km to the NE of the MCS-2. This line was due to the convergence of two different air masses: the first one (moist and warm) was advected by the mesoscalar depression (meso-α) at the surface, and the sec-ond one, colder than the first, arrived from the North and was associated with the anticyclone situated in Central Europe (Fig. 3).
Using the criteria of Hilgendorf and Johnson (1998), it seems reasonable to fix the initial time of these MCS at 22:00 UTC. At that moment, the degree of organisation of both squall lines was considerable (Fig. 6). The analysis of surface data (not shown) confirmed the presence of a pool of precipitation-cooled air behind both MCS, where new up-drafts developed. This fact confirmed that the two MCS could be considered as squall lines (Doswell et al., 1996). This development stage presented a predominant and in-creasing convective area and a rear, little-developed strati-form precipitation region (Figs. 6 and 7), related with the disappearance of the frontal structure. The most active con-vective cells were situated over or near the Mediterranean Sea, which fed them with warm, moist air. This fact also helped to increase the life cycle of the cells, which attained 2 h in many cases, a feature that is very unusual in this region (Rigo and Llasat, 2004). In spite of the increased number of convective cells and the maximum value of the reflectivity (55 dBZ), the vertical development did not show any growth, maintaining the maximum at 9 km for the Echotop20.
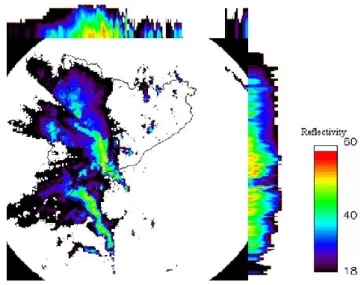
Fig. 8. Zmaxat 23:00 UTC on 9 June 2000.
In the vertical cross section (perpendicular to the con-vective lines) shown in Fig. 7 it can be observed how the mesoscale system presents practically no stratiform area and its vertical development does not exhibit any tilt. These two facts indicate that the cells are in their development stage and that there scarcely existed vertical shear in the environ-ment in this line direction. However, the vertical cross paral-lel to the MCS-1 (not shown here) shows how the strongest updrafts had produced small outflow anvils associated with each cell independently of each other and oriented towards the left side of the system. These facts are the result of the strong wind at upper levels, as well as the moderate vertical shear (Rotunno et al., 1988).
The development stage can be summarised by the presence of a strong, warm and moist inflow at low levels (LLJ) com-ing from the right hand side of the MCSs (observed from the HIRLAM data model and thermodynamic analysis, not pre-sented here), and favoured by the cyclone and the proximity to the Mediterranean Sea, by the small tilt of the convective cells, produced by the strong updrafts, and, finally, by the non-existence of vertical shear in the direction perpendicu-lar to the convective lines, and moderate shear in the parallel direction, mainly due to the high wind speed at upper levels.
5 Maturity stages of MCS-1 and MCS-2
Both MCSs evolved in a similar way in the hours following their formation. However, by comparing Figs. 6 and 8 it is possible to observe a clear difference between their move-ments. In the case of MCS-1, the system remained prac-tically anchored in the same position (the distance covered was less than 10 km in 1 h), and only its internal organisa-tion evolved towards a more linear one. On the other hand, MCS-2 moved fast and changed its orientation (the squall line passed from the initial N-S to a NNW-SSE direction). This difference between the two MCSs’ movements allowed their approach. Beside this, the orientation of the squall lines,
perpendicular to the coast, and the inflow coming from the sea assisted the cells formed into the MCS and developed over the sea to move over land and, in their maturity stage, discharge precipitation in the coastal areas. The repetition of this process produced high amounts of rainfall and the first floods.
During the time interval between 22:00 UTC and 23:00 UTC the vertical development was similar, taking into account the maximum values of Echotop20 (∼11 km). How-ever, if the value considered is the Echotop40 (defined as Echotop20 but for the 40 dBZ threshold, and more closely related to the active convection), the most active cells had reached the maximum top at 23:00 UTC (approximately 8 km, compared with the 7 km recorded 1 h earlier). Besides this, the number of echoes with high values of reflectivity increased, affecting a major region. As noted previously, the organization of the convection of the MCS-1 was prac-tically linear from 23:00 UTC, and it is possible to observe in Fig. 9 (00:00 UTC) that it was formed by different cells, which were in different stages of their life cycle. Further-more, due to the intense winds at upper levels, it began to form an anvil outflow at the left of the squall line. At the same time, the stratiform precipitation had practically disap-peared from the rear part of the most active section of the MCS-1 (Fig. 10). The maturity stages of MCS-1 and MCS-2 were achieved by approximately 00:00 UTC on 10 June.
6 Formation of MCS-12 and maximum of convective ac-tivity stage
At 01:00 UTC (Fig. 11), MCS-1 and MCS-2 had al-ready merged into a single structure (hereafter called MCS-12). Then, convective activity growths arose, as the val-ues of reflectivity echoes (58 dBZ) and the vertical devel-opment altitudes (13 km for the Echotop20 and 11 km for the Echotop40) show. This re-activation of the convection was probably due to two factors: the connection between the gust fronts of the previous MCSs, and also the feed-ing of the MCS-12 by the Mediterranean air mass. Besides this, the considerable slope between the coast and the Prelit-toral range, 25 km away and with altitudes reaching 1000 m, favoured the development of the convection (Fig. 12). At that moment there were many convective cells that were practi-cally aligned over an area nearly 200 km long and oriented from NNW to SSE. The development of the convective cells was practically vertical, without any tilt. Only a small anvil could be appreciated in the left part of the MCS, practically undeveloped in comparison with the image from 1 h earlier.
Once the two systems merged, the new MCS-12 had a very slow movement. This quasi-stationarity was one of the most important factors favouring the heavy rainfalls responsible for the flash-floods, as other authors have proposed (Fritsch et al., 1986; Doswell et al., 1996). This effect is associated with the movement of the cells drawn into the system. The movement of an MCS can be divided in two parts (Doswell et al., 1996): displacement (generally associated with the
gen-(a)
(b)
Fig. 9. Vertical section parallel to the MCS-1 at 00:00 UTC on 10
June 2000 (b) of the long line marked in the CAPPI image at 1 km
(a).
eral flow at mid or high levels), and propagation (due espe-cially to the movement of the convective cells, more closely linked with low-level flow). In this stage of the event, the flow at mid levels (south-westerly) and low levels (easterly)
(a)
(b)
Fig. 10. Vertical section perpendicular to the MCS-1 squall line at
00:30 UTC on 10 June 2000 (b) of the line marked in the CAPPI image at 1 km (a).
Fig. 11. Echotop20 at 01:00 UTC of 10 June 2000.
was practically perpendicular, and the propagation factor was sizeable enough to suppress the displacement vector of all MCSs. The systems then remained over the same position for long periods, and the movement of the cells helped to maintain high rain rates over those regions for time inter-vals longer than the usual duration. Following the definition of Doswell (Doswell et al., 1996; Doswell, 1997), this be-haviour was identified as a “convective train” The
combina-Fig. 12. Orography of the area (shaded regions), contour of the
MCS-12 at 01:00 UTC (lined area) and inflow over the region (black arrow).
tion of large-scale and mesoscale factors, but also the orog-raphy (which also contributed to the cell movement) was de-cisive.
Analysis of this maximum of convective activity stage faced the difficulty of lack of information due to the gen-eral attenuation of the radar signal as a consequence of the intense rainfall over the radom (Sempere Torres et al., 2003), as can be observed in the comparison between the reflectiv-ity field (Fig. 13) and the rainfall field at surface (Fig. 14). Although it was impossible to determine the internal struc-ture of the MCS-12 for some 2 h, it is feasible to know the position of the convective structure.
Before the general attenuation of the radar signal, at 02:00 UTC (Fig. 15) the MCS-12 observed in the meteoro-logical radar remained anchored in a similar position. The convective cells usually presented an early stage over the sea, or very close to the coastline. Due to the inflow, those cells moved inland and parallel to the squall-line, reaching their maturity stage in the most affected area, where the maximum rain rate occurred. At that time, the stratiform region asso-ciated with the MCS-12 was situated in the area where the flow was outgoing.
In this stage the vertical developments (Fig. 16) presented different features from the previous ones. At that moment, the outflow at high levels started to develop the main anvil common in the maturity stages of MCSs (Rotunno et al., 1988; Doswell et al., 1996). This anvil had started in the rear part of the cells in the previous stage, and approximately 3 h later it had reached its maximum development, indicating the initiation of the dissipating stage and the end of the con-vective activity. However, by 02:00 UTC that activity was
es-(a)
(b)
Fig. 13. CAPPI at 1 km at 02:00 UTC (a) and 02:40 (b) of 10 June
2000.
pecially significant, with the development of new cells in the leading part of the old ones (Fig. 16). The new cells had de-veloped over the gust front produced by the cells when they were in the maturity and dissipation stage. This front resulted from the effect of the crash of the downdraft associated with precipitation with the ground. Considering the two types of classification of MCSs in the mature stage presented in the introduction, the MCS-12 can be classified firstly as asym-metric and as an NS-MCS. Figure 15 shows the most active
Fig. 14. Evolution of the 30 min accumulated rainfall, between
02:00 UTC and 03:00 UTC on 10 June 2000.
Fig. 15. Echotop20 at 02:00 UTC on 10 June 2000. The red arrow
shows the inflow; the convective part of the squall-line area is in-cluded in the blue line; the stratiform region is surrounded by the black dotted line.
convection displaced to the right flank, over or close to the sea, where the influence of the LLJ is more appreciable. On the other hand, on the left flank the vertical development is less notable and the existence of the stratiform precipitation region can also be observed. In this sense, the position of this region is very significant and not usual, how it is presented in different climatologies (Parker and Johnson, 2000; Rigo and Llasat, 2004; Hilgendorf and Johnson, 1998), where the TS type has been presented as the common one.
7 The final stage
In spite of the fact that the most intense activity (both from the point of view of convective development and also from the rain rates recorded at the surface) finished at approxi-mately 05:00 UTC, the rainfall due to the MCS-12 remained in the region for another 4 h, until the system left Spain and went into France. In Fig. 17 it is still possible to observe clearly the linear organization of the MCS. This fact shows how the inflow continued to be from sea to land. However, the convection was less developed than in previous hours due to the northward displacement of the mesoscale low
mov-(a)
(b)
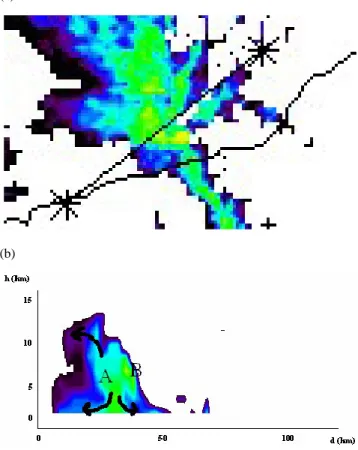
Fig. 16. Vertical section perpendicular to the MCS-12 squall line at
02:00 UTC on 10 June 2000 (b) over the line marked in the CAPPI image at 1 km (a). The figure shows the development of new cells (marked “B”) in the leading part of the older ones (marked as “A”).
ing away from the Catalan coast and the decrease of the en-ergy necessary to trigger the convection. Simultaneously, the stratiform area increased its percentage over the convective area, a factor associated with the beginning of the dissipating stage of the MCS-12. The arched shape of the stratiform pre-cipitation area (Fig. 17) confirms the asymmetry of the MCS and corroborates that the system belongs to the NS type, with the particular feature of having the stratiform zone on a flank of the squall line.
The above effects are more appreciable in Fig. 18, where the MCS-12 is practically reaching the Northern border of the region. At 07:00 UTC, the vertical development of the structure was practically non-existent (the highest altitude of the Echotop20 was close to 5 km), with most or all the precip-itation stratiform and remaining in this position for a further 2 h. Thus the complete life cycle of the MCS was close to 8 h if the beginning is considered as the moment of the joining of the previous MCSs, or to 11 h, if the starting point were the formation of the MCS-1 and MCS-2. Finally, it should be noted that at 09:00 UTC a new structure appeared, which produced light to moderate precipitation in the central area of the region. In spite of the minor importance of the rainfall records of that second structure (less than 50 mm), the total values recorded an appreciable increase in some zones.
Fig. 17. Zmaxat 05:00 UTC on 10 June 2000.
Fig. 18. Echotop20 at 07:00 UTC on 10 June 2000.
8 Final remarks and conclusions
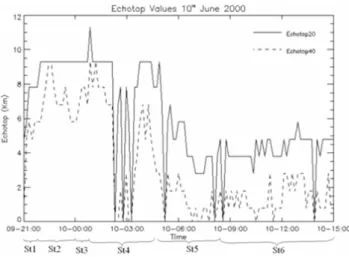
Figures 19 and 20 show a synthesis of the evolution of the organization of the convection based on the maximum reflec-tivity at CAPPI-1km, CAPPI-7km, CAPPI-15km, the maxi-mum value of VIL and the maximaxi-mum Echotop for 20 and 40 dBZ threshold. The figures show that it is possible to distin-guish six stages of evolution, considering the vertical devel-opments and rain rate at surface (characterized by the cited features). Using those figures, it is possible to summarize the event in the following stages:
1. The first stage, or “Pre-storm stage” (from 21:00 UTC to 22:00 UTC of 9 June), shows the emergence of a frontal structure arriving from the West and moving to-wards the East. This period comprises from 21:00 UTC to 22:00 UTC of 9 June, and during this period all the magnitudes presented the highest increases of their val-ues, except the reflectivity at the highest levels. Thus, we can summarise this first part as a stage of major
de-Figure 19. Evolution of reflectivity at 1 km, 6 km and 12 km, and VIL magnitudes for the event of 10 June 2000. St1 means “Pre-storm stage”, St2 is “Early stage”, St3 is the equivalent of “Maturity stage of MCS-1 and MCS-2”, St4 is “Merging stage”, St5 means “Final stage of MCS-12”, and St6 is “Non-convective stage”.
Figure 20. The same as figure 19, but for Echotop20 and Echotop40
29
Fig. 19. Evolution of reflectivity at 1 km, 6 km and 12 km, and VIL
magnitudes for the event of 10 June 2000. St1 means “Pre-storm stage”, St2 is “Early stage”, St3 is the equivalent of “Maturity stage of MCS-1 and MCS-2”, St4 is “Merging stage”, St5 means “Final stage of MCS-12”, and St6 is “Non-convective stage”.
Figure 19. Evolution of reflectivity at 1 km, 6 km and 12 km, and VIL magnitudes for the event of 10 June 2000. St1 means “Pre-storm stage”, St2 is “Early stage”, St3 is the equivalent of “Maturity stage of MCS-1 and MCS-2”, St4 is “Merging stage”, St5 means “Final stage of MCS-12”, and St6 is “Non-convective stage”.
Figure 20. The same as figure 19, but for Echotop20 and Echotop40
29
Fig. 20. The same as Fig. 19, but for Echotop20 and Echotop40.
velopment of the convection, due to the contribution of potential energy, which was advected from the sea by a surface cyclone situated close to the coast of Catalonia. 2. In the “Early stage” (between 22:00 UTC of 9 June and 00:00 UTC of 10 June) the MCS-1 and MCS-2 devel-oped as a result of various interacting factors: the frontal band, the orography of the region, a convergence line, and the influence of the surface low. The maximum re-flectivity at low levels and the Echotop20 did not in-crease, while the reflectivity at medium and high levels, the VIL and the Echotop40 showed first a rise to a max-imum (22:30 UTC of 9 June), and then a sharp fall until 00:00 UTC of 10 June. This evolution leads to the con-clusion that those maximum values coincided with the initial moment of the high degree of convection. 3. The “maturity stage of MCS-1 and MCS-2” (from
quasi-stationarity of the MCS-1, which led to it merging with MCS-2. All the magnitudes, except the Echotop20, presented two relative maxima, due to the development of new strong updrafts, associated with the interaction between the gust fronts and the inflow coming from the sea. Those factors were also associated with the con-vective train that arose in both MCSs.
4. During the “Merging and maturity stage of MCS-12” (between 01:00 UTC and 05:00 UTC of 10 June) three important phenomena were discerned: firstly, the merg-ing of the two MCSs into a smerg-ingle structure (MCS-12), maintaining initially the maximum values of the magni-tudes for a brief time period; next, the progressive de-crease of all the magnitudes (with a small rise at the final part), the updrafts becoming gradually less important (a fact associated with the maturity of the convection, and also with the decrease of the contribution of potential energy); finally, the quasi-stationarity of the MCS and the high values of reflectivity at lower levels, combined with the orography, were the contributing factors that led to the maximum values of precipitation and the most severe floods.
5. In the “Final stage of MCS-12” (between 05:00 UTC and 09:00 UTC), it is possible to observe how there was practically no vertical development until the end of the period. During this period the dissipating phase of the MCS-12 is appreciated, with predominance of strat-iform precipitation in front of the convective. This is the result of the movement of the low, and then the ex-haustion of the source of the instability, because of the changes in the low levels wind regime.
6. Finally, during the “Non-convective stage” (from 09:00 UTC to 15:00 UTC of 10 June) the convection was residual and only slightly present over Catalonia. After 09:00 UTC a new structure appeared in the cen-tral part of Catalonia, though less sizeable that the pre-vious ones. Most of the precipitation was the result of the preceding convection, quite similar to that presented by Houze (1997).
From the previous description, the duration including the non-convective stage, the formation of the MCS-12 by merg-ing of two previous squall lines, the presence of the convec-tive train effect, the quasi-stationarity of the MCSs and, fi-nally, the intense values of precipitation, make the case pre-sented one of the most interesting observed in the region since the presence of the meteorological radar began. Com-parison with other stages of the life cycle presented by the bibliography in the introduction is quite difficult, however, due to the fact that the MCS-12 was the result of the merg-ing of two previous MCSs with a marked individual identity. Thus, this case is quite different from the typical MCS life cycle. If we compare it with the phases proposed by Leary and Houze (1979) it would be possible to identify our phase 2 as the “formation”, the “intensification of the convection”
would be our stage 3, the phase of “maturity” would coin-cide with our stage 4, and, lastly, our stages 5 and 6 could be identified as the “dissipation” proposed. Our stage 1, rela-tive to the pre-storm stage, does not in fact belong to the life cycle of the MCS. With this last consideration in mind, com-parison with the stages presented by Hilgendorf and Johnson (1998) shows the same number, but the distribution is differ-ent: the three initial “stages of growth” proposed by those authors would be our phase 2 and part of the phase 3, the “maturity phase” would be the rest of stage 3 and the greater part of our stage 4, and, finally the “decay phase” could be identified with the final part of our stage 4 and stages 5 and 6. However, the coincidences in time duration are scarce, be-cause in our case the maturity stage is equal to the sum of the three growth stages. In that study the mean duration of the complete growth stage was approximately 8 h, while in our case it was only 3 h. The early merging of both MCS-1 and MCS-2 is a probable explanation for this difference. Fol-lowing this argument, the duration of the mature phase was greater in the 10 June 2000 event than in the compared study. The same explanation can be provided in this case: the merg-ing of both MCSs into a smerg-ingle one re-activated the updrafts and the gust front of the MCS-12.
In conclusion, the heavy rainfalls during the 10 June 2000 event in Catalonia were due to the passing of two mesoscale convective systems (MCS-1 and MCS-2) that crossed the re-gion from Southwest to Northeast and merged to give way to a quasi-stationary MCS (MCS-12). The structures devel-oped over a convergence line formed over the southern coast of Catalonia. The line was formed by the convergence of two air masses. The first one, dry and cold, came in from the North and was associated with a low situated over France that advected the air mass over the Iberian Peninsula. On the other hand, a Mediterranean cyclone advected warm and moist air over the south-eastern part of the cold mass. The front associated with the Atlantic low also helped to trigger the convection over the region.
Acknowledgements. The authors thank the Agencia Catalana de
l’Aigua (ACA) of the Generalitat de Catalunya and the Regional Meteorological Center of the INM in Catalonia for the data provided. Our thanks to the STAP of the INM and to E. Velasco of ACA for their kind collaboration. This work has been sponsored by the MONEGRO (REN 2003-09617-C02-02) Spanish project, and the HYDROPTIMET (Interreg IIIB Medocc) European project. Our thanks to T. Molloy for reviewing the English language.
Edited by: R. Romero
Reviewed by: R. Pascual and another referee
References
Biggerstaff, M. I. and Listemaa, S.: An Improved Scheme for Con-vective/Stratiform Echo Classification using Radar Reflectivity, J. Appl. Meteorol., 39, 2129–2150, 2000.
Doswell III, C. A., Brooks, H. E., and Maddox, R. A.: Flash Flood Forecasting: An Ingredients-Based Methodology, Wea. Forecast-ing, 11, 560–581, 1996.
Doswell III, C. A.: Flash Flood Forecasting – Techniques and Limitations. Jornades de Meteorologia Eduard Fontser´e, 15–16 November 1997.
Fritsch, J. M., Kane, R. J., and Chelius, C. R.: The contribution of mesoscale convective weather systems to the warm-season pre-cipitation in the United States, J. Climate. Appl. Meteor., 25, 1333–1345, 1986.
Hilgendorf, E. R. and Johnson, R. H.: A Study of the Evolution of Mesoscale Convective Systems Using WSR-88D Data, Wea. Forecasting, 13, 437–452, 1998.
Houze, R.: Cloud Dynamics, International Geopysic series, Aca-demic Press, 53, 1993.
Houze Jr., R. A.: Stratiform Precipitation in Regions of Convection: A Meteoroligical Paradox?, Bull. Amer. Met. Soc., 78, 2179– 2196, 1997.
Houze Jr., R. A., Rutledge, S. A., Biggerstaff, M. I., and Smull, B. F.: Interpretation of Doppler weather radar displays of midlati-tude mesoscale convective systems, Bull. Amer. Met. Soc., 70, 608–619, 1989.
Houze Jr., R. A., Smull, B. F., and Dodge, P.: Mesoscale organi-zation of springtime rainstorms in Oklahoma, Mon. Wea. Rev., 118, 613–654, 1990.
Jansa, A., Genov´es, A., Campins, J., Picornell, M. A., Riosalido, R., and Carretero, O.: Mesoscale Cyclones vs. Heavy Rain and MCS in the Western Mediterranean, MAP Newsletter, 5, 24–25, 1996.
Jans`a, A.: A general view about Mediterranean Meteorology: cy-clones and hazardous weather, INM/WMO International Sympo-sium on cyclones and hazardous weather in the Mediterranean, Palma de Mallorca, April 1997, 33–42, 1997.
Jans`a, A., Genov´es, A., Picornell, M. A., Campins, J., Riosalido, R., and Carretero, O.: Western Mediterranean cyclones and heavy rain, Part II: Statistical approach, Meteorol. Appl., 8, 43–56, 2001.
Johnson, J. T., MacKeen, P. L., Witt, A., Mitchell, E. D., Stumpf, G. J., Eilts, M. D., and Thomas, K. W.: The storm Cell Identifi-cation and Tracking (SCIT) Algorithm: An Enhanced WSR-88D Algorithm, Wea. Forecasting, 13, 263–276, 1998.
Leary, C. A. and Houze Jr., R. A.: The structure and evolution of convection in a tropical cloud cluster, J. Atmos. Sci., 36, 437– 457, 1979.
Llasat, M. C.: Episodios de lluvias copiosas en Catalu˜na: genesis, evoluci´on y factores coadyuvantes, Publicacions de la Universitat de Barcelona, Barcelona, 1987.
Llasat, M. C.: Influencia de la orografia y de la inestabilidad convectiva en la distribuci´on espacial de lluvias extremas en Catalu˜na, Acta Geol´ogica Hisp´anica, 25, 197–208, 1990. Llasat, M. C.: Gota fr´ıa, Colec. Boixareu Universitaria, n. 6. Ed.
Marcombo, Barcelona, 1991.
Llasat, M. C. and Puigcerver, M.: Meteorological Factors Associ-ated with Floods in the North-Eastern Part of the Iberian Penin-sula, Natural Hazards, 9, 81–93, 1994.
Llasat, M. C., Ramis, C., and Barrantes, J.: The meteorology of high-intensity rainfall events over the West Mediterranean Re-gion, Remote Sensing Reviews, 14, 51–90, 1996.
Llasat, M. C., Rigo, T., and Montes, J. M.: Orographic role in the temporal and spatial distribution of precipitation, The case of the internal basins of Catalonia (Spain), Proceedings of the EGS Plinius Conference, Maratea, Italy, October 1999, 41–55, 2000. Llasat, M. C., de Batlle, J., Rigo, T., and Barriendos, M.: Las
in-undaciones del 10 de junio del 2000 en Catalu˜na, Ingenier´ıa del Agua, 8, 53–66, 2001.
Llasat, M. C., Rigo, T., and Barriendos, M.: The “Montserrat-2000” flash-flood event: A comparison with the floods that have oc-curred in the Northeastern Iberian Peninsula since the 14th Cen-tury, Int. J. Climatol., 23, 453–469, 2003.
Llasat, M. C. and Rigo, T.: Nowcasting of convective structures in the NW of the Mediterranean, Hydrological Risk: recent ad-vances in peak river flow modelling, prediction and real-time forecasting, Assessment of the impacts of land-use and climate changes (Proceedings of the ESF LESC Exploratory Workshop held at Bologna, Italy, 24–25 October 2003), 10 pp., 2004. Llasat, M. C., Rigo, T., Ceperuelo, M., and Barrera, A.: Estimation
of convective precipitation: the meteorological radar versus an automatic rain gauge, Adv. Geosci., 2, 103–109, 2004.
Loehrer, S. M. and Johnson, R. H.: Surface pressure and precipi-tation life cycle characteristics of PRE-STORM mesoscale con-vective systems, Mon. Wea. Rev., 123, 600–621, 1995.
L´opez, J. M. and Ar´an, M.: Estudio de una ciclog´enesis mediterr´anea: Catalu˜na, 9–10 de junio de 2000, Serie Mono-graf´ıas, Instituto Nacional de Meteorolog´ıa, 108 pp., 2005. Parker, M. D. and Johnson, R. H.: Organizational Modes of
Mid-latitude Mesoscale Convective Systems, Mon. Wea. Rev., 128, 3413–3436, 2000
Picornell, M. A., Jans`a, A., Genov´es, A., and Campins, J.: Auto-mated database of mesocyclones from the HIRLAM(INM)-0.5◦ analyses in the Western Mediterranean, Int. J. Climatol., 21, 335– 354, 2001.
Ramis, C., Llasat, M. C., Genov´es, A., and Jans`a, A.: The October-87 floods in Catalonia. Synoptic and mesoscale mechanisms, Meteorol. Appl., 1, 337–350, 1994.
Rigo, T.: Estudio de sistemas convectivos mesoescalares en la zona mediterr´anea occidental mediante el uso del radar meteorol´ogico, Ph. D. Thesis, Universitat de Barcelona, 2004.
Rigo, T. and Llasat, M. C.: Flash floods and heavy rain events in Catalonia: analysis of the 1996–2000 period, Hydrology of the Mediterranean and Semiarid Regions (Proceedings of an interna-tional symposium held at Montpellier, April 2003), IAHS Publ. no. 278, 269–275, 2003.
Rigo, T. and Llasat, M. C.: A Methodology for the Classification of Convective Structures using Meteorological Radar: Applica-tion to Heavy Rainfall Events on the Mediterranean Coast of the Iberian Peninsula, Nat. Hazards Earth Syst. Sci., 4, 59–68, 2004,
SRef-ID: 1684-9981/nhess/2004-4-59.
Rotunno, R., Klemp, J. B., and Weisman, M. L.: A theory for strong, long-lived squall lines, J. Atmos. Sci., 34, 463–485, 1988. S´anchez-Diezma, R.: Optimizaci´on de la medida de lluvia por radar meteorol´ogico para su aplicaci´on hidrol´ogica, Ph. D. Thesis, Universitat Politecnica de Catalunya, 313 pp., 2001.
Sempere Torres, D., Corral, C., Berenguer, M., S´anchez-Diezma, R., and Dolz, J.: El episodio pluviom´etrico del 10 de junio en Catalu˜na. Un primer estudio hidrometeorol´ogico, Ingenier´ıa del Agua, 7, 105–115, 2000.
Sempere Torres, D., S´anchez-Diezma, R., Berenguer, M., Pascual, R., and Zawadzki, I.: Improving radar rainfall measurement sta-bility using mountain returns in real time, 31th Conference on Radar Meteorology, Seattle (USA), 6–12 August 2003. Steiner, M., Houze Jr., R. A., and Yuter, S. E.: Climatological
Char-acterization of Three-Dimensional Storm Structure from Opera-tional Radar and Rain Gauge Data, J. Appl. Meteorol., 34, 1978– 2007, 1995.
Schiesser, H. H., Houze Jr., R. A., and Huntrieser, H.: The mesoscale structure of severe precipitation systems in Switzer-land, Mon. Wea. Rev., 123, 2070–2097, 1995.