HAL Id: hal-03252285
https://hal.archives-ouvertes.fr/hal-03252285
Submitted on 8 Jun 2021
HAL is a multi-disciplinary open access
archive for the deposit and dissemination of
sci-entific research documents, whether they are
pub-lished or not. The documents may come from
teaching and research institutions in France or
abroad, or from public or private research centers.
L’archive ouverte pluridisciplinaire HAL, est
destinée au dépôt et à la diffusion de documents
scientifiques de niveau recherche, publiés ou non,
émanant des établissements d’enseignement et de
recherche français ou étrangers, des laboratoires
publics ou privés.
Energy Optimization in Redundant WSNs under
Deterministic and Probabilistic Sensing Models
Ibrahima Diané, Rahim Kacimi, Zoubir Mammeri, Ibrahima Niang
To cite this version:
Ibrahima Diané, Rahim Kacimi, Zoubir Mammeri, Ibrahima Niang. Energy Optimization in
Redun-dant WSNs under Deterministic and Probabilistic Sensing Models. IEEE 80th Vehicular Technology
Conference (VTC 2014 - Fall), IEEE Vehicular Technology Society, Sep 2014, Vancouver, Canada.
pp.1–5, �10.1109/VTCFall.2014.6965959�. �hal-03252285�
Energy Optimization in Redundant WSNs under
Deterministic and Probabilistic Sensing Models
Ibrahima Dian´e1, Rahim Kacimi1, Zoubir Mammeri1, Ibrahima Niang2 1 IRIT-UPS, University of Toulouse, France
2 LID-UCAD, University of Dakar, Senegal
{diane, kacimi, mammeri}@irit.fr, [email protected]
Abstract—Almost all WSNs are deployed with some redundancy degree which is used only for robustness objectives. If not handled in an intelligent way, redun-dancy results in energy wasting because of redundant transmission and reception operations. In view of this energy wasting, a redundancy detection method under sensing models is proposed. We propose to take benefit from measurement redundancy to optimize the energy consumption and improve the end-to-end delay. We propose OER (Optimization of Energy based on Re-dundancy) protocol, to improve energy consumption in WSNs.
Index Terms—Wireless sensor networks, measure-ment redundancy, geographical proximity, sensing models
I. Introduction
WSNs deployment raises problems of power manage-ment and end-to-end communication delay. Indeed, de-spite the use of clustering schemes, WSNs are still faced with energy consumption and delay issues. Most of ex-isting work propose improvements in terms of energy consumption. However, these solutions do not consider measurement redundancy and use data aggregation and sleep periods to improve energy consumption and delay.
When the network size becomes large, its management raises difficulties. The structuring of a sensor network is one of the main mechanisms to save energy in each node, which allows to extend the system lifetime. One of the best known structures is the hierarchy. The hierarchization technique enables to partition the network into subsets in order to facilitate its management. In such a technique, network view becomes local; special nodes may have addi-tional roles. The literature includes several contributions on hierarchization techniques of sensor networks. This article advocates the use of geographical proximity and probabilistic sensing model for energy saving improve-ment. Indeed, we argue, in favor of a grouping technique where the nodes having redundant reading should be grouped. The measurement redundancy is the fact that several sensors in a same geographical proximity, report a same measurement value. Thus, the core idea of our approach is to determine and to group redundant nodes in order to have only one representing node by group which detect the eventual events and sends its data.
The rest of this paper is organized as follows. Related work in the field of hierarchical power management in WSNs is summarized in section II. Section III describes OER protocol and details the grouping technique based on the geographical proximity and the probability to detect events. In Section IV, we evaluate the performance of OER. Finally, we conclude this work in Section V.
II. Related Work
Low Energy Adaptive Clustering Hierarchy (LEACH) [6] is a cluster-based approach in which clusters are formed in a self-organized way. Each cluster is controlled by a cluster-head (CH). With the aim of maximizing the network lifetime, the selection of the CHs is based on the residual energy level of nodes. CHs collect data from their cluster member nodes and, after processing, communicate the results to a global sink node. In order to reduce the amount of transmitted data to the sink, the CHs aggregate the collected data by their member nodes, and send an aggregated packet to the sink. However, although LEACH may increase the network lifetime, it has some limitations. Unlike LEACH, where nodes self-configure themselves into clusters, LEACH-C [5] utilizes the sink for cluster formation. The sink receives information regarding the lo-cation and energy level of each node in the network. Using this information, the sink finds a predetermined number of CHs and organizes the network into clusters. The clusters are chosen to minimize the energy required for non-CH nodes to transmit their data to their respective CHs. The results presented in [5] indicate a definite improvement over LEACH.
In [3], the authors proposed a hierarchical protocol based on LEACH. The CHs formed in LEACH are grouped and organized in a hierarchy. They showed that the energy consumption decreases when the number of levels of the hierarchy increases. However, they did not improve the end-to-end delay of LEACH.
Hierarchical-PEGASIS [11], which is an extension to PEGASIS, is designed to address the delay incurred by packets during transmission to the base station. In or-der to improve the performance by reducing the delay in PEGASIS, messages are transmitted simultaneously. Another similar protocol to PEGASIS called C2E2S, has
is a centralized protocol where the base station organizes the network on the basis of energy information of nodes.
TEEN protocol [12] is another hierarchical protocol coupled with data centric approach that is designed to react to sudden changes in the sensing attributes such as weather conditions. TEEN approach is more proactive rather than reactive. This is particularly important for time-sensitive applications. The sensor network architec-ture is based on a hierarchical grouping where closer nodes form clusters and this process goes on the second level until base station (sink) is reached. However, TEEN is not suitable for applications where periodic data are required since the user may not get any data at all if the thresholds are not reached.
APTEEN proposed in [13] is an extension to TEEN and designed to capture both periodic data and react-ing to time-critical events. The architecture is similar to TEEN. The main drawbacks are the overhead and com-plexity of forming clusters in multiple levels, implement-ing threshold-based functions and dealimplement-ing with attribute-based naming of queries.
In [2], [1], the authors proposed a clustering approach called Virtual Grid Architecture (VGA) to maximize the lifetime of WSNs where nodes are stationary or move at low speed. They used GPS-free approach [14] to build clusters. In VGA, the area of deployment of sensors is formed in a rectilinear virtual topology containing of small areas in the shape of a square, and in each of them, a node is selected as CH. The data aggregation is performed at two levels: local and global. The local aggregation is performed by all CHs also called Local Aggregators (LAs), while the global aggregation is performed by a subset of LAs, called Master Aggregators (MAs). However, the determination of all MAs is a hard problem.
The authors in [9], [10] proposed a self-organisation technique based on the clustering approach to optimize the energy consumption in sensor networks. This technique consists in grouping the nodes close geographically in clusters. It requires determining parameters to produce a small number of clusters, homogeneous clusters (in size and radius), and stable clusters. Two thresholds are used to control the size of generated clusters and the dis-tances between cluster members and their corresponding clusterhead are at most two hops. However, no solutions were provided for thresholds settings and inter-cluster communication.
We have proposed MR-LEACH [4], which is an ex-tension to the wellknown LEACH protocol to improve energy consumption in cluster-based WSNs. MR-LEACH combines geographical proximity of the nodes and their readings redundancy in order to reduce the number of the intracluster transmissions. In the first stage, the CHs col-lect and observe the cluster readings, while in the second they determine the measurement redundancy and group the redundant nodes. After identifying the redundancy groups, only one representing node will send its readings
and the other nodes stop their transmissions. However, MR-LEACH uses memory space to collect data to analyze.
III. Redundancy in wireless sensor networks
A. Problem statement
WSNs are still faced with problems of energy consump-tion and delay. The initial node placement may explicitly specify some redundancy in the deployed sensor nodes. The measurement redundancy may result from this high density of nodes. Multiple neighboring nodes, which are placed at specific locations and/or at given distance each from other, may detect the same event and/or report the same value. It is therefore necessary to propose mech-anisms to manage possible measurement redundancy in order to improce the network lifetime.
This article proposes and analyzes OER (Optimization
of Energy based on Redundancy), a technique which
re-duces the measurement redundancy in WSNs.
B. Partitioning technique by geographical proximity
OER uses a partitioning technique based on geographic proximity. Depending on the geographic location, our technique allows the grouping of the nodes which detect the same events. Thus, only the representing nodes send their packets. This way, the communications are reduced and the energy consumption of the nodes is optimized.
1) Assumptions: For easier understanding of our scheme in the remainder of this paper, we make some reasonable assumptions.
• Nodes are densely and randomly deployed on a square
area and their placement is known.
• Nodes observe the physical events, generate a
moni-toring traffic and send it to the BS.
2) Principe of our approach: OER combines
geograph-ical proximity of the nodes and their probability to detect the same events in order to reduce the number of the transmissions. In the first stage, we determine and group the redundant nodes, while in the second we determine if the partitioning is best minimizing an objective function. The process is repeated until an optimal partitioning is found. We give more details hereafter.
• As soon as the sensor nodes are deployed on the
net-work, the starting of uncertainty in sensor detection is used to form the groups of redundant nodes. The value of objective function is also determined.
• After the redundant groups set-up, using the value of
objective function, we verify if the new partitioning is better. So we designate a function that serves as a criterion to determine the best solution to our partitioning problem. The goal of our optimization problem is then to minimize this function by using a
tabu search method.
After the initialization phase, OER enters in the sensing and transmission phase. Thus, only one representing node will be active at a time in a same redundancy group. The
representing nodes detect a possible event and send their data to the base station.
Geographical proximity grouping method: The
geograph-ical proximity exists if the distance between the nodes is less than the given threshold d and that these nodes detect the same events. This threshold is deduced directly from the starting of uncertainty in sensor detection.
Let the Euclidean distance between a sensor si and a
point p in the given region be d2(si, p). In the binary
disk model, the maximum sensing range of the node s is parameterized by Rmax. The target at point p can be
detected by the sensor s if and only if d2(s, p) ≤ Rmax.
The probability that an event at a distance d(s, p) from the node will be detected is:
pdet(x) =
!
1, x≤ R
0, otherwise (1)
where, x = d2(s, p). If pdet(x) = 1, it means that the
target at point p can be detected by sensor s.
According to the Elfes sensing model [7], the probability that a sensor detects an event to a distance x is:
pdet(x) = 1, x≤ R e−λ(x−R)β, R < x≤ R max 0, otherwise (2) where, R defines the starting of uncertainty in sensor de-tection and the parameters λ and β are adjusted according to the sensor physical properties. Rmax is the maximum
sensing range of the node.
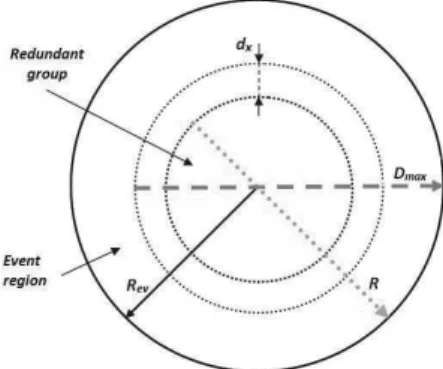
To partition the network, we group the redundant nodes according to the selected nodes as centers of the event regions. For this, we start from a randomly selected node that serves as center of a first region of events. We group redundant nodes of this region. Thereafter we move the center to another node to form the next event region and group the corresponding redundant nodes. This process is repeated until each node is member of one group. For that there is geographical proximity between a set of nodes and a redundancy, it is necessary that:
d2(Ni,Cc) ≤ R − Rev (3)
and therefore,
d2(Ni,Nj) ≤ 2 (R − Rev) (4)
where, Cc defines the center of the current event region,
Rev defines the radius of events regions and the ith node
is like a point Ni in the space that can be represented
as Ni= (xi,yi). Under the probabilistic sensing model,
we consider a threshold probability (Pt) to determine the
redundant nodes. Equation (3) can be approximated for
R < x≤ Rmax and β = 1 as
pdet(x) = e−λ(x−R) (5)
Considering the threshold probability (Pt), we have:
Fig. 1. Sensing for redundancy nodes
Pt= e−λ(Dmax−R) (6)
and therefore,
Dmax= R −
ln(Pt)
λ (7)
where, Pt defines the probability that a sensor detects
an event to a distance Dmax. For that there is redundancy
between a set of nodes at a probability Pt, it is necessary
that:
d2(Ni,Nj) ≤ 2 (Dmax− Rev) (8)
d2(Ni,Nj) ≤ 2 (R − (
ln(Pt)
λ + Rev)) (9)
The nodes are densely and randomly deployed on a square area and their placement is known. BS creates a table of coordinates where it will store the reported coordinates by the sensor nodes. To form a redundant group, we first consider an unvisited node (random sampling without replacement). Then we determine all redundant nodes of the event region whose center is the previously selected node. A redundant group is thus formed. Finally, all nodes in the formed group are marked as visited as detailed in Algorithm 1.
Objective function: We propose a function that serves
as a criterion to determine the optimal solution to our partitioning problem. Specifically, it associates a value with each instance of our problem. Let a network of N deployed sensors in an area. The algorithm 1 seeks to group redundant nodes and thus create the partitions of nodes. This is an algorithm receiving as input the set of nodes and provides k partitions as output.
By considering a partitioning P with k partitions,
P = {p1, p2, ..., pk} (k ≤ N ). A packet transmission is
performed by one node of the partition 1 or by one node of the partition 2 or ... by one node of the partition k. The average energy consumption of a node is written by:
E(P) = (1 k· 1 |p1| +1 k· 1 |p2| +···+1 k· 1 |pk−1| +1 k· 1 |pk| )etx (10)
Algorithm 1Partitioning procedure
Require: Setof N odes, Dist
Ensure: reGroup[][], N umberof Group
N umberof Groups← 0;
reGroup[][] ← ∅;
{the set of nodes is not classified}
for (i ← 1; i ≤ Setof N odes.size; i++) do
N ode← Setof N odes.get();
if (Node is not visited) then
mark Node as visited;
CardGroup← 0;
for (j ← 0; j < Setof N odes.size; j++) do
if (d2(N odej, N ode) ≤ Dist + ǫ and (Node is not visited)) then
Group[i][CardGroup] ← idN odej;
CardGroup← j + 1;
end if
compt[i]← CardGroup;
end for
N umberof Groups← N umberof Groups + 1;
end if
end for{groups calculation}
for (i ← 0; i < Setof N odes.size; i++) do
weight← 0;
for (j ← 0; j < N umberof Groups; j++) do for (z ← 0; z < compt[j]; z++) do
if (idN odei = Group[j][z] and compt[j]< weight) then D← j; weight← compt[j]; end if end for end for
reGroup[D][i] ← idN odei; end for
Return reGroup[][], N umberof Group
E(P) = 1 k k % i=1 1 |pi| etx (11)
where k is number of partitions, |pi| is the cardinal of
the partition i, etx the energy consumed by transmission
of one packet, and E(P ) is the average energy consumed by a node under the partitioning P . The average energy consumed during a superframe, with partitioning P , is written by: EG(P) = k % i=1 1 |pi| etx (12)
After designing our objective function, we do a tabu search to find an optimal solution (a partitioning with the lowest possible energy consumption) as detailed in Algorithm 2. After having found an optimal partitioning, only the representing nodes have to send data to the BS.
IV. Performance Evaluation
To evaluate the performance of OER, we used NS2 simulation tool which provides an opportunity to integrate the news protocols.
Algorithm 2Optimization using tabu search s∗
represents the best solution obtained so far;
Lis the maximum number of event regions can be formed;
k is the number of iterations since the last improvement of
s∗;
T is the tabu list;
Ns is the neighborhood of the solution s;
f(x) is the objective function;
Ensure: s∗
Choose an initial solution s;
s∗← s; k← 0; T ← ∅; while (L > k) do if (Ns− T '= ∅) then k← k + 1; Search s′ ∈ (Ns− T ) such as s′= minx∈Ns−Tf(x); s′
← P artitioning(Setof N odes, Dist);
U pdate the list T;
if (f (s) > f (s′)) then s∗ ← s′ ; k← 0; end if s← s′ ; end if end while Return s∗ A. Simulation set-up
We used a network scenario consisting of 100 to 1000 nodes randomly deployed over a 250 ∗ 250 m2 area. The
sink’s coordinates are (135, 155). The simulation parame-ters are as follows:
TABLE I Simulation parameters
Packet length 55 bytes Initial node energy 2 j Transmission bit rate 250 kbs−1
Transmit power 24.75 mW Receive power 13.5 mW
Idle power 6.5 mW Sleep power 15 µW Maximum sensing range Rmax 50 m
Starting of uncertainty in sensor detection R 30 m Radius of event region Rev 25 m
B. Simulation results
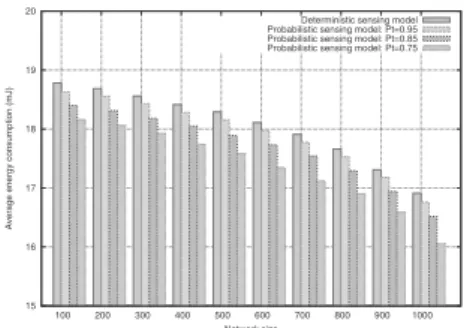
From Fig. 2, we can see that when the network size increases the energy consumption of the nodes in OER decreases. Indeed, with high density the measurement redundancy increases. Thus, the sink receive less data. This is because, the number of redundant groups decreases which reduces the number of transmissions in the network. So, when the number of nodes is being higher, they are grouped and only the group representing nodes send their packets in the network. Furthermore, the curves of Fig. 2 also show that the performance gap between boolean sens-ing model and probabilistic senssens-ing model becomes more significant when the event detection probability decreases.
15 16 17 18 19 20 100 200 300 400 500 600 700 800 900 1000
Average energy consumption (mJ)
Network size
Deterministic sensing model Probabilistic sensing model: Pt=0.95 Probabilistic sensing model: Pt=0.85 Probabilistic sensing model: Pt=0.75
Fig. 2. Average energy consumption of each node during one round
Fig. 3 shows how the network lifetime is affected over time
0 200 400 600 800 1000 1200 1400 0 2000 4000 6000 8000 10000
Number of nodes alive
Time (S)
Deterministic sensing model Probabilistic sensing model: Pt=0.95 Probabilistic sensing model: Pt=0.85 Probabilistic sensing model: Pt=0.75
Fig. 3. Network lifetime
using boolean sensing model versus probabilistic sensing model. In this set of experiments, we consider a network size of 1000 sensor nodes. Probabilistic sensing model has a greater network lifetime compared with boolean sensing model. OER under probabilistic sensing model, is more effective to extending the network lifetime. Compared to OER under boolean sensing model, it takes approximately 1.7 times longer until the first node dies. Fig. 4 plots
36 38 40 42 44 46 0 200 400 600 800 1000
End to end delay (ms)
Network size
Deterministic sensing model Probabilistic sensing model: Pt=0.95 Probabilistic sensing model: Pt=0.85 Probabilistic sensing model: Pt=0.75
Fig. 4. End-to-end delay
the results of the average end-to-end delay evolution. As first result, we can see that the average delay grows with increasing of the network size. However, this increasing is less significant for OER under probabilistic sensing model, due to the reduced number of redundant groups. In fact, the sink in OER under probabilistic sensing model, expects a number of packets k ≪ n, where n is the size of the cluster.
V. Conclusion
This paper addresses energy efficiency in WSNs. Our so-lution consists in taking benefit from the measurement re-dundancy. We proposed OER protocol, to improve energy consumption in WSNs. OER has several strengths. It com-bines the sensing models and the geographical proximity of the nodes with the measurement redundancy in order to improve the energy efficiency and provides better end-to-end communication delays. Furthermore, we assessed how it outperforms the protocols based on deterministic sensing model. In our future work, we would like to extend our approach to consider initial WSN deployment including explicit redundancy specification.
References
[1] J.N. Al-Karaki, R. Ul-Mustafa, and A.E. Kamal. Data ag-gregation in wireless sensor networks - exact and approximate algorithms. In Workshop on High Performance Switching and
Routing, 2004.
[2] J.N. Al-Karaki, R. Ul-Mustafa, and A.E. Kamal. Data aggre-gation and routing in wireless sensor networks: Optimal and heuristic algorithms. Computer Networks, 53(7):945 – 960, 2009. [3] S. Bandyopadhyay and E.J. Coyle. An energy efficient hier-archical clustering algorithm for wireless sensor networks. In
Proc. of 22 Annual Joint Conference of the IEEE Computer and Communications, INFOCOM’03, 2003.
[4] Ibrahima Dian´e, Rahim Kacimi, Zoubir Mammeri, and Ibrahima Niang. Energy optimization based on the redundancy in wsns. In 6th Joint IEEE IFIP Wireless and Mobile
Network-ing Conference. IEEE, 2013.
[5] W.B. Heinzelman, A.P. Chandrakasan, and H. Balakrishnan. An application-specific protocol architecture for wireless mi-crosensor networks. Wireless Communications, IEEE
Trans-actions on, 1(4):660–670, October 2002.
[6] W.R. Heinzelman, A. Chandrakasan, and H. Balakrishnan. Energy-efficient communication protocol for wireless microsen-sor networks. In Proc. of the 33rd Annual Hawaii International
Conference on System Sciences, 2000.
[7] Ashraf Hossain, PK Biswas, and S Chakrabarti. Sensing models and its impact on network coverage in wireless sensor network. In IEEE Region 10 and the Third international Conference on
Industrial and Information Systems. IEEE, 2008.
[8] T.T. Huynh and C.S. Hong. An energy* delay efficient multi-hop routing scheme for wireless sensor networks. IEICE
trans-actions on information and systems, 89(5):1654–1661, 2006. [9] M. Lehsaini, H. Guyennet, and M. Feham. A novel
cluster-based self-organization algorithm for wireless sensor networks. In International Symposium on Collaborative Technologies and
Systems, 2008.
[10] M. Lehsaini, H. Guyennet, and M. Feham. An efficient cluster-based self-organisation algorithm for wireless sensor networks.
International Journal of Sensor Networks, volume 7:85–94, March. 2010.
[11] S. Lindsey, C. S. Raghavendra, and M. Sivalingam, Krishna. Data gathering in sensor networks using the energy delay metric. In Proc. of the 15th International Parallel & Distributed
Pro-cessing Symposium, IPDPS’01, Washington, DC, USA, 2001. [12] A. Manjeshwar and D.P. Agrawal. Teen: a routing protocol
for enhanced efficiency in wireless sensor networks. In Proc. of
International Parallel and Distributed Processing Symposium, pages 2009 –2015, april 2001.
[13] A. Manjeshwar and D.P. Agrawal. Apteen: a hybrid protocol for efficient routing and comprehensive information retrieval in wireless sensor networks. In Proc. of International Parallel and
Distributed Processing Symposium, IPDPS’02, 2002.
[14] A. Savvides, C.C. Han, and M.B. Strivastava. Dynamic fine-grained localization in ad-hoc networks of sensors. In
Inter-national Conference on Mobile Computing and Networking, volume 2001, pages 166–179, 2001.