A Determination of the Effective Thickness of a
Liquid Deuterium Target for a Quasielastic
Scattering Experiment
by
Jared Ripley Turkewitz
Submitted to the Department of Physics
in partial fulfillment of the requirements for the degree of
Bachelor of Science in Physics
at the
MASSACHUSETTS INSTITUTE OF TECHNOLOGY
MASSACHUSETTS INSTITUTE OF TECHNOLOGY
AUG 13 2010
LIBRARIES
ARCHIVES
June 2010
©
Massachusetts Institute of Technology 2010. All rights reserved.
/l/ Author ... V
v..T.
. ....
Department of Physics
May 14, 2010
C ertified by ...
()
June L. Matthews
1-Professor
Thesis Supervisor
Accepted by ...
...
David E. Pritchard
Senior Thesis Coordinator, Department of Physics
A Determination of the Effective Thickness of a Liquid
Deuterium Target for a Quasielastic Scattering Experiment
by
Jared Ripley Turkewitz
Submitted to the Department of Physics on May 14, 2010, in partial fulfillment of the
requirements for the degree of Bachelor of Science in Physics
Abstract
The effective thickness of a liquid deuterium target was determined by measuring the yield of the neutron-deuteron elastic scattering cross section. The flux of incident
neutrons was determined by a fission ionization chamber. The scattered deuterons
were detected with a Delta E - E (thin plastic scintillator - thick CsI calorimeter)
telescope. The effective target thickness was determined to be larger than is thought physically possible. Possible reasons for the unphysical result are discussed, but fur-ther analysis is needed to ascertain why the effective target thickness was determined to be an unphysical length.
Thesis Supervisor: June L. Matthews Title: Professor
Acknowledgments
I would like to thank Professor June Matthews for her support and ability to quickly determine the heart of a problem. I am also extraordinarily thankful for the help and guidance provided by Vladimir Henzl. Vlad you were truly dedicated, patient and inspirational. Art Bridge, thanks for your work ethic and friendly personality; you were integral in the successful operation of this experiment. Professor Mark Yuly thanks for ensuring this experiment got started on the right foot. Also thanks to Katrina Koehler, Peter Kroening, Jonathan Slye and Sho Uemura who all worked tirelessly and maintained a positive attitude, even if things took more time than expected. Finally, I would like to thank my parents for the love and support you both have always given me.
Contents
1 Introduction
2 Experimental Setup
2.1 Overview of Experiment . . . .
2.2 Neutron Beam Production...
2.3 Liquid Deuterium Target . . . .
2.4 Fission Chamber . . . .
2.5 Detectors. . . . ...
2.5.1 Proton Spectrometer . . . .
2.5.2 Neutron Detection . . . .
2.5.3 Charged Particle Telescope . . . .
3 Incident Neutron Flux
3.1 Fission Chamber Overview . . . .
3.2 Fission Chamber Time of Flight . . . . .
3.2.1 Incident Neutron Kinetic Energy
3.3 Fission Chamber ADC Spectrum . . . .
3.4 Incident Neutron Flux . . . .
4 Effective Target Thickness
4.1 Principles of Effective Target Thickness
4.2 Effective Target Thickness . . . . 4.3 Live Time of the Data Aquistion System
7 25 . . . . 25 . . . . 25 . . . . 27 . . . . 28 . . . . 31 33 33 34 35
4.4 Kinetic Energy of Incident Neutron and Elastically Scattered Deuteron
from the ToF of the Neutron and Deuteron . . . . 36
4.5 Energy Loss in Target . . . . 37
5 Measurement of Elastically Scattered Deuteron 43
5.1 Identification of Elastically Scattered Deuteron . . . . 43
5.2 Total Time of Flight of the Neutron and Elastically Scattered . . . . 44
5.3 Number of Detected Deuterons as a Function of Incident Neutron Energy 47
5.3.1 DE2 ADC Cut for Elastically Scattered Deuterons . . . . 48
5.3.2 CsI ADC Cut for Elastically Scattered Deuterons . . . . 48
5.4 Determination of Background in Elastically Scattered Deuteron
Detec-tion... . . . . . . . . . . . . 51
5.5 Alternative Method for Determining Background in Scattered Deuteron
Determination... . . . . . . . .. 53
5.6 Energy Loss in Target . . . . 56
6 Results and Error Analysis 61
6.1 Value of Effective Target Thickness . . . . 61
6.2 Error A nalysis . . . . . . 64
7 Conclusion 65
List of Figures
2-1 Flight paths at WNR. The neutron deuteron breakup experiment used flight path 4FP15R, marked ND Breakup. Detectors were located in
building 29A
[3].
. . . .
18
2-2 False color image of the beam intensity profile. Produced by exposing a FUJI storage-phosphor image plate in the beam. The beam has a
diameter of 1 in... . . . . . . . . 19
2-3 Experimental setup of detectors involved in measuring the position and
energy of the scattered proton or neutron, to scale
[7].
. . . . . . 212-4 Experimental setup, to scale. Angles were calculated using the Law of
Cosines... . . . . . . . . . . . . 23
3-1 Fission chamber uncalibrated ToF spectrum. . . . . 26
3-2 Time calibrator spectrum. The time calibrator output signals 10 ns apart, with a range of 1.28 ps, which completely covers the range of the fission raw TOF spectrum. Only the part of the spectrum for which
physical events occur during data collection is shown here. . . . . 27
3-3 Fission chamber ToF spectrum. The -- flash is visible around 50 ns. . 28
3-4 Fission chamber kinetic energy from ToF of the incident neutron. The maximum physical neutron kinetic energy for this experiment was 800
M eV . . . . . 29
3-5 Fission chamber ADC spectrum. The left peak corresponds to a-particles and the right peak to fission fragments. The minimum of
3-6 The incident neutron kinetic energy as calculated by Equation 3.2
plot-ted against the fission chamber ADC. . . . . 30
3-7 238U cross section spline . . . . 32
3-8 Incident neutron flux as determined by the yield of the fission chamber. 32 4-1 Incident neutron kinetic energy as a function of total time of flight,
i.e. the time of flight of the incident neutron and elastically scattered deuteron. The thin black line is the spline fit, the black circles are the
calculated values the spline is fit to. . . . . 37
4-2 Elastically scattered deuteron kinetic energy as a function of total time of flight, i.e. the time of flight of the incident neutron and elastically scattered deuteron. The thin black line is the spline fit, the blue circles
are the calculated values the spline is fit to. . . . . 38
4-3 The red line is the energy of the incident neutron when energy lost by the elastically scattered deuteron in the liquid deuterium target is compensated for; the blue line is the energy of the incident neutron when the energy lost in the target is assumed to be zero. Note that for equal incident neutron energies, the spline fit which corrects for energy
loss has longer total times of flight. . . . . 41
4-4 The blue line is the kinetic energy of the elastically scattered deuteron when energy lost by the deuteron in the liquid deuterium target is compensated for; the red line is the kinetic energy of the scattered deuteron when the energy lost in the target is assumed to be zero. Note that for equal deuteron energies, the spline fit which corrects for energy loss should have a shorter total time of flight, because higher energy
neutrons produce higher energy deuterons. [Check This Tomorrow] . 41
5-1 The DE2 ADC value plotted against the CsI ADC value when the
tar-get is filled with liquid deuterium. Events outside the black graphical
cut are considered to be from particles which are not deuterons. . . . 44
5-3 CsI calibrated TOF, the smeared out -y - flash is visible around 60 ns. 46
5-4 Incident neutron energy determined by total time of flight of the
inci-dent neutron and scattered deuteron as described in Section 4.4. . . 46 5 DE2 vs CsI ADC spectra when the graphical deuteron cut in Figure
5-1 is applied for 6 different cuts on 5-10 MeV ranges of incident neutron
kinetic energy are made. . . . . 47
5-6 DE2 ADC spectrum for liquid deuterium target after the graphical deuteron cut in Figure 5-1 is applied for 6 different cuts on 10 MeV
ranges of incident neutron kinetic energy. . . . . 48
5-7 The CsI ADC spectrum shown for runs when the target was filled with liquid deuterium after the following cuts have been made: elastic trigger, deuteron graphical cut shown in Figure 5-1, an incident neutron in one of six different 10 MeV energy ranges, and the DE2 ADC cut
described in Section 5.3.1. . . . . 50
5-8 The DE2 ADC value plotted against the CsI ADC value when the
target is em pty . . . . 52
5-9 DE2 vs CsI ADC spectra for empty target runs when the graphical deuteron cut in Figure 5-1 is applied for 6 different cuts on 10 MeV
ranges of incident neutron kinetic energy are made. . . . . 53
5-10 The CsI ADC spectrum shown for runs when the target was empty after the following cuts have been made: elastic trigger, deuteron graphical cut shown in Figure 5-1, an incident neutron in one of six different 10
MeV energy ranges, and the DE2 ADC cut described in Section 5.3.1 54
5-11 Incident neutron energy determined by total time of flight of the inci-dent neutron and scattered deuteron as described in Section 4.5. This accounts for energy lost by the elastically scattered deuteron in the
12 DE2 vs CsI ADC spectra when the graphical deuteron cut in Figure 5-1 is applied for 6 different cuts on 5-10 MeV ranges of incident neutron kinetic energy are made (calculated with total time of flight of the neutron and scattered deuteron accounting for energy lost in the liquid
deuterium target). . . . . 57
5-13 DE2 ADC spectrum for liquid deuterium target after the graphical deuteron cut in Figure 5-1 is applied for 6 different cuts on 10 MeV ranges of incident neutron kinetic energy (calculated with total time of flight of the neutron and scattered deuteron accounting for energy
lost in the liquid deuterium target). . . . . 58
5-14 The CsI ADC spectrum shown for runs when the target was filled with liquid deuterium after the following cuts have been made: elastic trigger, deuteron graphical cut shown in Figure 5-1, an incident neutron in one of six different 10 MeV energy ranges (accounting for energy loss
in the target), and the DE2 ADC. . . . . 59
List of Tables
3.1 The dividing ADC cut between fission fragments and a-particles for different incident neutron energy ranges. The ADC cut for the energy
range 0-800 MeV occurs at channel 510. . . . . 30
4.1 Elastic scattering cross section for neutron-deuteron scattering, found
by interpolating data from telescopes located at angles of 36' and 420
presented in [4].. . . . . . . . . 35
4.2 Bethe-Bloch variables... . . . . . . . . 38
5.1 DE2 ADC when the target is filled with liquid deuterium. . . . . 49
5.2 DE2 ADC cuts when the target is filled with liquid deuterium. . . . . 49
5.3 CsI ADC Gaussian fit parameters when the target is filled with liquid
deuterium... . . . . . . . . . . 50
5.4 CsI ADC cuts when the target is filled with liquid deuterium. .... 51
5.5 Empty target events identified as deuterons... . . . . . . . . 53
5.6 Incident neutron flux and number of detected deuterons. . . . . 54
5.7 Alternative background determination for elastically scattered deuteron
determination... . . . . . . . . . . . . 55
5.8 DE2 ADC when the target is filled with liquid deuterium and energy
loss is accounted for when determining Ninc energy. . . . . 57
5.9 DE2 ADC cuts when the target is filled with liquid deuterium and
energy loss is accounted for when determining Nine energy. . . . . 58
5.10 CsI ADC Gaussian fit parameters when the target is filled with liquid deuterium and energy loss is accounted for when determining Nine energy. 59
5.11 CsI ADC cuts when the target is filled with liquid deuterium and
en-ergy loss is accounted for when determining Nj, enen-ergy... . . . . 60
5.12 Incident neutron flux and number of detected deuterons... . . . . 60
6.1 Effective target thickness determined as described in Chapter 5. . . . 62 6.2 Mean and standard deviation of the values of the effective target
Chapter 1
Introduction
A great deal of experimental and theoretical work was devoted to understanding in-teractions between two nucleons (neutrons or protons). When the theoretical models of two nucleon interactions are extrapolated to interactions involving three nucleons, there are discrepancies between the theoretical predictions and the experimental re-sults. This suggests the need for new theories to explain the physical process behind three nucleon interactions. This process is named the three nucleon force.
One of the simplest systems that involves the three nucleon force is considered to be a nucleon colliding with a bound neutron and proton (deuterium nucleus). The majority of such experiments involve a proton colliding with the deuterium nucleus,
as in [8, 1, 9]. The experiment described in this thesis instead involves the collision of
a neutron with a deuterium nucleus. The experiment seeks to measure the differential scattering cross section for interactions between the incident neutron and the bound proton over a wide range of incident neutron energies. The results in this experiment are the first that will measure this cross section for incident neutron kinetic energies above 25 MeV.
This thesis focuses on the determination of the yield of the incident neutron flux needed to measure the neutron induced deuteron breakup d(n, np)n inelastic scat-tering cross section. The yield of the incident neutron flux depends on the total neutron flux and the effective thickness of the liquid deuterium target. The effective target thickness could potentially differ from the physical target thickness primarily
because of pressure induced bulging of the target container's windows and because of bubbling of the liquid deuterium. Pressure induced bulging increases the volume of the target, which increases the effective thickness relative to the physical thickness as measured at atmospheric pressure. The physical thickness of the target was measured when the target was at a pressure similar to the pressure maintained when the target was filled with liquid deuterium, but the target was not filled with liquid deuterium when this measurement was made. Bubbling of the liquid deuterium decreases the effective density of the deuterium, which decreases the effective thickness relative to the physical thickness. Bubbling of the liquid deuterium was qualitatively observed, but the quantitative effect that bubbling has on the liquid deuterium density was not directly measured.
A charged particle telescope, discussed in Section 2.5.3, was used to determine the effective target thickness by measuring the yield of deuterons elastically scattered by neutrons. This determination depends on several factors, which include: the incident neutron flux, discussed in Chapter 3, the solid angle of the detectors, discussed in Section 4.2, the live time of the detectors, discussed in Sections 3.4 and 4.3, and the detection of elastically scattered deuterons, discussed in Chapter 5. The analysis in this thesis determines the effective target thickness to be 2.0 ± 0.2 in, while the phys-ical target thickness is thought to be no more than 1.2 in. This discrepancy suggests that at least one of the factors affecting the effective target thickness determination is not correctly accounted for, as discussed in Chapter 6.
Chapter 2
Experimental Setup
2.1
Overview of Experiment
The experiment was performed at the Weapons Neutron Research (WNR) facility at the Los Alamos Neutron Science Center (LANSCE) at the Los Alamos National Laboratory (LANL). At the WNR facility a beam of neutrons ranging in energy from a little above 0 MeV to 800 MeV was incident upon a liquid deuterium target. Two nucleons from the d(n, np)n collision were observed in coincidence. The scattered proton was observed by a magnetic spectrometer on the right side of the beam (ori-ented in the direction the neutrons propagate), while one of the scattered neutrons was observed on the left side of the beam by a plastic scintillator.
2.2
Neutron Beam Production
The LANSCE linear accelerator accelerates protons up to 800 MeV before it directs them to a spallation tungsten source, called Target 4. The collision of the proton beam with Target 4 produces neutrons with energies ranging from below a few MeV to 800 MeV. The neutrons are collimated and directed down several beams into different
experiments. This experiment used flight path 4FP15R, which is located 150 to the
right of the proton beam when oriented in the direction in which the beam propagates. Figure 2-1 shows the different flight paths at WNR.
Proton beam
Weapons Neutron Research Faclity
0 scale 0 NRS N ? (Blue Roo0m) Targe-4 3ee 4FP9(N4F90 GEANIESE FIGARO 31 3" ND Breakup
Figure 2-1: Flight paths at WNR. The neutron deuteron breakup experiment used flight path 4FP15R, marked ND Breakup. Detectors were located in building 29A [3].
As discussed in [4], the accelerator produces protons which collide with Target 4 to produce neutrons at a rate of 40 macropulses per second, with each macropulse
having a width of 635 p1s. Each macropulse is made up of 0.2 ns long micropulses
separated by 1.8 ys. The short duration of each micropulse and long time between micropulses ensures that the slowest neutrons from one burst arrive before the fastest
neutrons from the next burst. The WNR facility provides each flight path with a signal that records the time at which the neutrons were produced, referred to in this thesis as to.
The neutron beam to the flight path this experiment used is controlled by two depleted Uranium shutters. A shutter opening of 1.5 in x 1.5 in was used for this experiment. An iron collimator further reduced the size of the neutron beam. This collimator defined the final neutron beam size of a circle with a diameter of 1 in.
Figure 2-2: False color image of the beam intensity profile. Produced by exposing a FUJI storage-phosphor image plate in the beam. The beam has a diameter of 1 in.
2.3
Liquid Deuterium Target
A horizontal cylindrical flask, which measures 5 inches in diameter and 0.99 inches in thickness at atmospheric pressure, with 2 mil mylar windows served as the liquid deuterium target. This target could be filled with either liquid deuterium or liquid
hydrogen. In this experiment the fission chamber, discussed in Section 2.4, did not function properly when the target was filled with liquid hydrogen, which limits the
usefulness of data collected during this time. The problem with the fission chamber was fixed before the target was filled with deuterium. The problem was fixed by placing 50 ohm BNC terminators on unused BNC connectors on the fission chamber to prevent charge buildup.
A cryogenic refrigeration system was used to cool the deuterium to a temperature of about 20 Kelvin and maintained a gauge pressure between 13.5 and 14 psi. At this pressure the target thickness was measured to be 1.1 in, but this measurement was made without liquid deuterium in the target. The liquid deuterium was observed to bubble at this pressure. The target was housed inside a large vacuum chamber. The chamber was shaped like a vertical cylinder with a diameter of 32 cm. The body of
the vacuum chamber was made of 3 inch stainless steel
[4].
16
2.4
Fission Chamber
The flux of incident neutrons is determined using a fission ionization chamber, or fission chamber. The fission chamber was located 1545 cm downstream from Target 4, 145 cm upstream from the liquid deuterium target. The fission chamber contains several 0.0013 cm thick stainless steel foils which hold deposits of fissionable materials,
such as 2 38U. When neutrons pass through the fissionable material charged fission
products, such as o-particles and heavy fission fragments are produced. The fission chamber outputs a signal which depends on the ionization caused by these charged fission products. The incident neutron flux was determined by measuring the yield
2.5
Detectors
2.5.1
Proton Spectrometer
As discussed in Chapter 1 the goal of this experiment was to measure the quasielas-tic scattering cross section for neutron induced deuteron breakup, d(n, np)n. The scattered proton passed through a magnetic spectrometer as shown in Figure 2-3. Detectors DEL, P1 and P2 are made up of thin plastic scintillator material. Not shown in Figure 2-3 are two rear wire chambers, located between P1 or P2 and the rear magnet. These wire chambers are shown in Figure 2-4. These wire chambers can be used to determine the path the proton takes as it travels through the magnet spectrometer, and in theory can determine the energy of the proton through momen-tum resolution [3]. However, in practice it is difficult to get the position resolution of the wire chambers accurate and reliable enough to measure the proton momentum by how much it bends in the magnetic fields. The strength of each magnet is about 0.3 T. Ba Maqn [I Ca rnbLer e Neutro N ran
Figure 2-3: Experimental setup of detectors involved in measuring the position and energy of the scattered proton or neutron, to scale [7].
... ... ... . ... ... .. . .. .... . ...
2.5.2
Neutron Detection
The position and time of flight of the scattered neutron was measured by one of nine plastic scintillators, labeled neutron bars in this experiment, positioned as shown in Figure 2-4. Although neutrons are not charged particles, they do scatter off the hydrogen and carbon nuclei in the scintillator. These scattered particles can be
detected by the scintillator, with an efficiency of about 10% [4]. The energy of the
scattered neutron was determined by measuring both the total time of flight of the incident and scattered neutron, as well as the total time of flight at two different
positions of the incident neutron and scattered proton, as described in
[7).
2.5.3
Charged Particle Telescope
This experiment used a charged particle telescope to measure the effective thickness of the target. The telescope consisted of a thin AE detector composed of plastic scintillator, labeled 'DE2' in this experiment, and a thick CsI calorimeter, composed of CsI crystal. The front center of the CsI calorimeter was located 203.9 cm from the center of the target at an angle of 400 to the left of the beam (oriented looking downstream). The center of the thin DE2 detector was located 203.7 cm from the center of the deuterium target, also at an angle of 40' to the left of the beam, as shown in Figure 2-4. The dimensions of the thin DE2 detector were 9.6 cm x 9.6 cm x 2.5 mm, while the dimensions of the thick CsI calorimeter in were 9.6 cm x 9.6 cm x 14 cm. The DE2 detector was positioned so as to completely cover the face of the CsI calorimeter.
Figure 2-4: Experimental setup, Cosines.
to scale. Angles were calculated using the Law of
d(n,np)n
X .uy Ma
P=Proton sclntillator F=Finger detector
dE=change In energy detector WC= Wire chomber
Cs|= Cesitum Iodide detector NB=Neutron bor
Chapter 3
Incident Neutron Flux
3.1
Fission Chamber Overview
As discussed in Section 2.4, the flux of incident neutrons (Nie) is determined by the
fission chamber. The fission chamber outputs a signal proportional to the charge of the fission product produced by an incident neutron. This signal is recorded by an Analog to Digital Converter (ADC), and is used to distinguish between o-particles and heavier fission fragments, as discussed in Section 3.3. In addition, the time of flight of the neutron, or time difference between when the charged fission fragment was produced and the time when the neutron was produced at Target 4 was measured, as discussed in Section 3.2. The time of flight and ADC value determine the total flux of incident neutrons, as discussed in Section 3.4.
3.2
Fission Chamber Time of Flight
A Time to Amplitude Converter (TAC) was used to measure the time of flight of the incident neutron between Target 4 and the fission chamber. The output pulse from the fission chamber was sent to a Constant Fraction Discriminator (CFD), the CFD output a logic signal that was the start signal of the TAC. The stop signal of the TAC was a delayed to pulse (described in Section 2.2. The TAC output signal was recorded by an ADC.
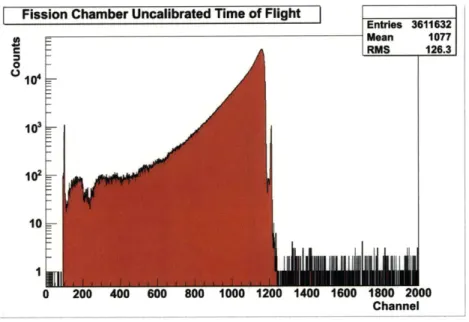
The spectrum of the ADC for about 200 hours of data collection is shown in Figure 3-1. During this series of runs the amount that the to signal was delayed before stopping the TAC did not change by more than about 1 ns. During the experiment to was observed to change suddenly, within the course of a single 2 hour run, relative to the experiment several times; this drift in to was corrected for by adding a run dependent offset when calibrating the detectors. The cause of to drift was either drift in the to pulse sent to all experiments, often after a period of time when the beam was off, or a change in this experiment's setup.
Fission Chamber Uncalibrated Time of Flight
is - Mean 1077 C - RMS 126.3 o 0 -103 102 10 0 200 400 600 800 1000 1200 1400 1600 1800 2000 Channel Figure 3-1: Fission chamber uncalibrated ToF spectrum.
The fission chamber ToF spectrum was calibrated using a time calibrator and an event with a known time of flight. The time calibrator also tested the linearity of the ADC. Figure 3-2 shows that the ADC is linear. The straight line fit has a reduced
x
2 of 0.29 assuming an error of 1 channel. This calibration gives a conversion factorof 0.3625ns - chn-1. When the proton beam is incident upon Target 4, a prompt -y
emission occurs. The emitted '-rays travel at the speed of light. This is referred to as the -- flash and is important for calibrating many detectors in this experiment. The -y-flash is visible around channel 1210 in Figure 3-1. The 'y-flash travels the 1545 cm between Target 4 and the fission chamber in 51.5 ns.
Fission Time Calibrator pO -41.63 ± 0.06397 .50 p1 0.3625 7.639e-05 E 1400 300 200 100 -0 ' 200 400 600 800 1000 1200 1400 Channel J
Figure 3-2: Time calibrator spectrum. The time calibrator output signals 10 ns apart, with a range of 1.28 p1s, which completely covers the range of the fission raw TOF spectrum. Only the part of the spectrum for which physical events occur during data collection is shown here.
The final conversion from channels to ns is given by Equation 3.1.
TOFcai = a - (b - TOFraw) (3.1)
where a is the time offset, 488.9 ns for this set of runs, and b = 0.3625 ns -ch-1 was
calculated using the time calibrator, TOFeai is the time of flight in ns, while TOFraw is the time of flight in channels. For different sets of runs the value of a was adjusted to correct for drift over time in to relative to the fission chamber signal. The upper bound on the error associated with the fission chamber timing can be estimated by the width of a Gaussian fit around the -- flash. The standard deviation, o, of this Gaussian fit was .7 ns. The calibrated ToF spectrum of the fission chamber is shown in Figure 3-3.
3.2.1
Incident Neutron Kinetic Energy
The ToF was converted into an energy spectrum through standard relativistic kine-matics, as shown in Equation 3.2.
Fission lime of Flight FissionTOF Entries 6143971 Mean 110.5 0 $00oo- RMS 57.61 Underflow 1.783e+04 70000 - Overflow 0 680 iooooo20000 -0 O' 50 100 150 200 250 300 350 400 450 500
Fission TOF (nsec)
Figure 3-3: Fission chamber ToF spectrum. The -y-flash is visible around 50 ns.
m2
T
mc
- Mc2 (3.2)|1 -v2c
where T is the kinetic energy of the incident neutron in MeV, mc2 is the neutron
mass in MeV, and v is the velocity of the neutron and c is the speed of light.
The resulting spectrum is shown in Figure 3-4. This is similar to the spectrum
obtained in past experiments using a similar setup [7, 4, 2].
3.3
Fission Chamber ADC Spectrum
The amplitude of the fission chamber output signal was recorded by an ADC. This ADC value was used to distinguish between a-particles and charged fission fragments.
a-particles are produced both by a-decay of the 238U and by collisions between the
neutrons from the beam and the stainless steel foil in the fission chamber [4). The
fis-sion fragments produce larger signals than the a-particles do, so the fisfis-sion fragments produce higher ADC values than the a-particles do. A quadratic polynomial was fit to the dip in the ADC between a-particle and fission fragments. The minimum value of this polynomial was used to discriminate against a-particles, as shown in Figure 3-5.
Incident Neutron Flux Before Normalization FissionKE -Entries 6083409 10= - Mean 246.9 U RMS 187.6 Underflow 0 sonoOverflow 1016 00 00 ioo 20 a co o o 70 so e 10 MeV
Figure 3-4: Fission chamber kinetic energy from ToF of the incident neutron. The maximum physical neutron kinetic energy for this experiment was 800 MeV.
I Fission ADC| fission adc
Entries 1.320189e+07 4S004l iUnderflow 0 s45 Overflow 4.338e+04 480 - 2 i ndf 182.9/197 3500 --. pO 1.994e+04 30000p1 -70.03 2500 -- p2 0.06865 20000 1000 1 1000 00 200 400 600 S00 1000 1200 1400 1600 1800 2000 Fission ADC
Figure 3-5: Fission chamber ADC spectrum. The left peak corresponds to a-particles and the right peak to fission fragments. The minimum of the polynomial fit is channel 510.
The number of a-particles produced relative to the number of heavy fission frag-ments produced changes as a function of incident neutron energy. Therefore it is possible that the position of the ADC minimum changes as a function of incident neutron energy. Figure 3-6 shows how the fission chamber ADC spectrum varies with incident neutron kinetic energy.
In the analysis a different value of the ADC cut of a-particles was used for differ-ent energy ranges. The analysis in this thesis focuses on six differdiffer-ent energy ranges,
-U 20 400 600 500 1000 1200 1400 1600 1800 2000 ~
Fission ADC (channel)
The incident neutron kinetic energy as calculated by Equation 3.2 plotted against the fission chamber ADC.
as discussed in Section 4.2. The minimum values of the ADC which was considered
a fission fragment for these energy ranges are displayed in Table 3.1. Higher
en-ergy ranges tend to have a higher ADC cutoff value, which qualitatively agrees with Figure 3-6.
Table 3.1: The dividing ADC cut between fission fragments and a-particles for dif-ferent incident neutron energy ranges. The ADC cut for the energy range 0-800 MeV occurs at channel 510.
Incident Neutron Kinetic Energy [MeV] Minimum ADC Value Not
Considered an a-particle [chn] 135 - 145 471.7 155 - 165 479.6 175 - 185 489.7 195 - 205 506.5 215 - 225 528.6 235 - 245 536.1 Figure 3-6:
3.4
Incident Neutron Flux
The flux of incident neutrons (Nic), is related to the number of neutrons detected by the fission chamber by Equation 3.3.
Nic(E) = _Nfis(E) (33)
NlfcPUu(E)
where Ninc(E) is the incident neutron flux as a function of incident neutron kinetic
energy, Nfis is the number of neutrons detected by the fission chamber, E is the
efficiency of the fission chamber, lfis is the live time of the fission chamber, pu is
the density of 238U in the fission chamber and ou(E) is the cross section for fission
fragments to be produced for incident neutrons with a kinetic energy E. The live time of the fission chamber, lfis, can be measured with the help of a scaler, but this analysis has yet to be done. It is believed that the live time should be very close to 1 because the count rate of the fission chamber is low (about 6 Hz), and the electronics associated with the fission chamber are decoupled from the other detectors in the
experiment. From [11], E is 0.98 and pu is 0.9080 - 10-6 atoms-barn-'. The cross
section of 238U as a function of energy is determined by fitting a spline to interpolate
and extrapolate between the known data points. The spline fit is shown in Figure 3-7.
As discussed in
[2],
there is not much data for neutrons with kinetic energies aboveabout 100 MeV, which introduces an error of about 10% on the spline.
Equation 3.3 is used to determine to the total flux of neutrons, shown in Figure 3-8. An ADC cut above channel 510 was applied to select out fission fragments when making the histogram shown in Figure 3-8.
101 1 10 Neutron Energy (MeV)
Figure 3-7: 238U cross section spline
by the yield of the fission chamber. Figure 3-8: Incident neutron flux as determined
Chapter 4
Effective Target Thickness
4.1
Principles of Effective Target Thickness
The effective target thickness, xgff, is the length that a neutron from the beam would
travel as it passed through the target if the neutron did not interact with any of the
matter inside the target. While the physical target thickness, Xphy, was measured
to be 1.1 inches when at a gauge pressure of 14 psi, the Weff could differ from this
measurement, as discussed in Chapter 1. The measurement of xphy could be differnt
for the liquid deuterium target because it was not made when the target was filled with liquid deuterium. Additionally, the liquid deuterium bubbled, which decreases
its density, p. While this bubbling affects p and not the xeff, in this thesis this effect
is accounted for by changing xeff and keeping p constant. If Xeff determined in
this thesis is used in the determination of the quasielastic scattering cross section for
the d(n, np)n interaction, as discussed in [10], the expression used would be Xeff - p.
There is no need in this thesis to separately define an effective target thickness and an effective target density; instead any factor which would change p is accounted for by its effect on the determination of eff. Finally the target could be oriented at a
small angle to the beam, which would increase Xeff relative to Xphy by a factor of
4.2
Effective Target Thickness
The effective target thickness, xeff is determined by measuring the yield of elastic
scattering between deuterons and neutrons from a liquid deuterium target, as given by Equation 4.1.
Nd k 1
eff dNine AQdpl
dQ
where Xeff is the effective thickness in cm, Nd is the number of detected deuterons
which are elastically scattered into AQd, the solid angle of the charged particle
tele-scope given by Equation 4.3, Nisc is the flux of incident neutrons discussed in Sec-tion 3.4, k is the electronic prescale factor (which is set to 1), p is the density of the liquid deuterium (5.1 . 10-5 atoms-mb-1-cm-1) as given by Equation 4.2, 1 is the
live time of the DE2 - CsI detectors discussed in Section 4.3, and d, is the
neutron-deuteron elastic scattering cross section, determined in [4], and shown in Table 4.1.
Note that while Xeff should be independent of the energy of the incident neutron,
Nd, Nie and d' all depend on the incident neutron energy. The calculation of the
cross section is performed for 6 different neutron energy ranges; the standard
devia-tion of xeff determined at these 6 energies is related to the error associated with this
determination.
The density of the liquid deuterium in the target is given by Equation 4.2.
P Pg/cm3 A .10 27 (4.2)
where p is the density of liquid deuterium in the target in atoms-mb-1-cm-1, Pg/cm3
is the density of liquid deuterium in grams per centimeter cubed, 0.169 g-cm-3 for
a gauge pressure of 14 psi as given by [4], NA is Avogadro's number (6.022 - 1023
atoms-mol- 1), and AD2 is the molar mass of deuterium (2.014 g-mol-1).
The solid angle occupied by the charged particle telescope is given by:
Q Ate, (4.3)
where AQd is the solid angle of the telescope (0.0022 sr), Ate is the area of the charged
particle telescope normal to the elastically scattered deuterons (which is 9.6 cm x 9.6
cm as discussed in Section 2.5.3, thus Atei = 92.16cm 2, and ztee is the distance from
the center of the target to the center of the telescope (203.7 cm).
Table 4.1: Elastic scattering cross interpolating data from telescopes
section for neutron-deuteron scattering, found by
located at angles of 360 and 420 presented in [4].
Neutron Energy [MeV] da [mb-sr- 1] Error of d,- [mb-sr-1]
140 0.285 0.028 160 0.211 0.021 180 0.136 0.014 200 0.11 0.011 220 0.091 0.009 240 0.085 0.006
4.3
Live Time of the Data Aquistion System
The live time of the data aquistion system (DAQ) is given by the fraction of detected deuterons that are read by the computer and stored as data. It could be determined with the help of a scaler, as given by Equation 4.4.
Ncomp
Nscal
(4.4)where 1 is the live time, Ncal is the number of triggers recorded by a scaler, and
Ncomp is the number of triggers recorded by the computer. Unfortunately, there was no scaler which counted the number of charged particle telescope triggers (called elastic triggers in this thesis). However, the live time of the charged particle telescope is dominated by the live times associated with the DAQ, which could be determined with the help of scalers. The live time was assumed to be unity in this thesis; further analysis will be performed to check the validity of this assumption.
4.4
Kinetic Energy of Incident Neutron and
Elas-tically Scattered Deuteron from the ToF of the
Neutron and Deuteron
The thin DE2 plastic scintillator, discussed in Section 2.5.3, provides good timing resolution, a minimum resolution of 0.4 ns as discussed in Section 5.2, for determin-ing the total time of flight, i.e. the time of flight of the incident neutron and the scattered deuteron. This one quantity is sufficient to define both the kinetic energy of the incident neutron and the kinetic energy of the scattered deuteron. However, it is nontrivial to solve these equations algebraically, so a numerical solution was con-structed. This numerical solution can be arbitrarily precise, so it adds negligible error over the algebraic solution.
From relativistic kinematics
[5],
cos 6, = (E'+m'C2
-mdc Ed (4.5)
/En (En + 2mflc2)Ed(Ed
+ 2mnc2)
where 0, is the angle of the scattered deuteron in the lab frame (400), En is the kinetic
energy of the incident neutron [MeV], mnc2 is the neutron rest mass (939.57 MeV),
Ed is the energy of the scattered deuteron [MeV], mdc2 is the deuteron rest mass
(1877.84 MeV) and c is the speed of light (29.98 cm-ns-1). This equation is then
solved for Ed as a function of En:
Ed (cos 0,)2En(En + 2mc 2)2mc 2
(En + mnc2 + mdc2)2 - (cos 6) 2En((En + 2mnc2))
where all variables are the same as in Equation 4.5.
Now the total time of flight, ttot is related to Ed and En by
tt-Xfl+ Xtel (4.7)
whnc ittdc
the distance from the center of the liquid deuterium target to the center of the DE2
scintillator (203.7 cm), and = 1 - ("2)2 with 3, E and m being replaced by
#3
E, m, for the incident neutron and 3
d, Ed, md for the elastically scattered deuteron. These equations were solved numerically. The spline fits of the numerical solution are shown in Figure 4-1 and Figure 4-2.
Incident Neutron Energy Spline
w200 600- 400- 200-so 50 100 150 200 250 300 350 400
Total Time of Flight (nsec)
Figure 4-1: Incident neutron kinetic energy as a function of total time of flight, i.e. the time of flight of the incident neutron and elastically scattered deuteron. The thin black line is the spline fit, the black circles are the calculated values the spline is fit to.
4.5
Energy Loss in Target
Deuterons are charged particles which lose energy when passing through matter. Although deuterons lose energy in all stages of the flight from inside the target to the DE2 detector, as described in [4], only the loss of energy while in the liquid deuterium target will be discussed here. Energy lost in the target is likely to be the most significant in affecting the time of flight of the deuteron because energy lost in the target will affect the entire flight path of the deuteron, while energy lost in latter stages of the flight (for instance in the thin DE2 scintillator which is only 2 mm from the CsI detector) will have a smaller effect on the deuteron time of flight.
Because the deuterons move at relativistic velocities (13d = 0.23 for Ed = 51.8 MeV;
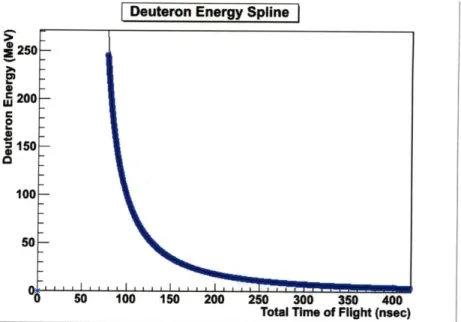
-Deuteron Energy Spline 2250 1200 150 100 50 so 100 150 200 250 300 350 400
Total Time of Flight (nsec)
Figure 4-2: Elastically scattered deuteron kinetic energy as a function of total time of flight, i.e. the time of flight of the incident neutron and elastically scattered deuteron. The thin black line is the spline fit, the blue circles are the calculated values the spline is fit to.
which are produced when E, = 200 MeV), the Bethe-Bloch formula as discussed in [6] is used. On the other hand, the energy of the scattered deuteron is small enough such that the density effect and shell correction are negligible.
dE 2 Z z2 - 2m 2 2Txa
dx 2rNa(re)2mec2 A A2
#ln(
2 ")with 27rNa(re)2mec2 = 0.1535 MeV-cm2 g-1.
Table 4.2: Bethe-Bloch variables.
- 202 (4.8)
re 2.817- 10-13 cm electron radius p density of absorber
Tmax max energy transfer in one collision me electron mass
Na Avogadro's number 6.022 -1023 atoms/mol
#
v/cI mean excitation potential z charge in units of e
A atomic weight of absorbing material Z atomic number
For the liquid deuterium target: p = (0.169 g.cm-3), z = 1 electron, A =
2.014 g-mol-1, I is assumed to be the same as for liquid hydrogen (19.6 eV), Z = 1, and
because md >> me Tmax is given by Equation 4.9.
I , .1 . .I .1 . . .1. . .
Tmax = 2mec2 2 2
(4.9
where -y =1/v/1 - 32, and mec2 is the electron mass in MeV. Using these numbers,
a 50 MeV deuteron (about a 200 MeV incident neutron) loses 3.9 MeV per cm or has
dE = 3.9 MeV-cm-1 in the liquid deuterium target.
dx
These equations were used to modify the kinematics discussed in Section 4.4.
E= Ed - Eloss (4.10)
where E is the energy of the elastically scattered deuteron after it leaves the target,
Ed is defined in Equation 4.6, and E10,, is the energy lost in the target, defined in
Equation 4.11.
The energy lost in the target is calculated with the simplifying assumption that the loss of energy is small enough that it is constant across the length of the target. A 50 MeV deuteron loses about 4 MeV per cm, therefore this assumption is justifiable for the deuterons produced by incident neutrons with kinetic energy in the energy ranges used in the analysis presented in this thesis.
I
dEd
dEd
E-oss = dx ~ - - Ax (4.11)
dx dx
where Ax is the length of the path the deuteron travels in the liquid deuterium
target and - is given by Equation 4.8. Assuming the neutron-deuteron occurs at
the center of the target (and that the height of the center of the charged particle telescope is the same height as the target),
Ax = .5xef f/ cos(thetatei) (4.12)
where xe! is the effective thickness of the target, and cos(thetatei is the angle at
which the charged particle telescope is located relative to the beam. Approximating
xeff as the physical target thickness Xphy= 2.8 cm, the average Ax is 1.8 cm. Note
that the variable xeff which is being determined is used to calculate the energy loss in
the target; this suggests the best way to analyze this data is in an iterative manner. Due to time constraints this analysis was not performed; however incorporating the
energy lost in the target has a relatively small effect, about a 10% increase in xeff,
so as long as xeff does not differ too much from Xphy the iterative process will not
lead to too large a difference. The analysis found that Xphy and xeff did differ by a
large factor (Xeff ~ 1.8xphy), but this means that xeff was unphysically large, and
adding energy loss would make it even larger. So there are larger errors somewhere in either the analysis or the experimental setup than the error caused by not iterating
the process. Using xphy for xeff, a 50 MeV deuteron loses about 7 MeV in the target.
This is a little less than the result found in
[4]
which uses a similar setup, but givesthe energy loss for the entire flight path of the deuteron as about 10 to 15 MeV for
deuterons scattered into a telescope located at an angle of 240 relative to the neutron
beam.
Equation 4.7 is modified to use E as opposed to Ed. A spline interpolation is shown in Figure 4-3 relating the total time of flight to the energy of the incident neutron, and a spline interpolation relating the total time of flight to the energy of the scattered deuteron is shown in Figure 4-4.
Not accounting for the energy loss in the target tends to cause an underestimation
of the effective target thickness, xegf, as defined by Equation 4.1. The
neutron-deuteron scattering cross section d, given in Table 4.5, and the incident neutron flux,
Nine, shown in Figure 3-8, both increase as incident neutron kinetic energy decreases.
The effective target thickness xeff varies inversely with the product Nine - d, thus
as the incident neutron kinetic energy decreases, so does xeff if all else (specifically
the number of elastically scattered deuterons) is constant. An underestimation of the incident neutron kinetic energy leads to an underestimation of xeff. As shown in Figure 4-3, not accounting for energy loss in the target leads to an underestimation of
the incident neutron kinetic energy, therefore it leads to an underestimation of Xeff.
Figure 4-3: The red line is the energy of the incident neutron when energy lost by the elastically scattered deuteron in the liquid deuterium target is compensated for; the blue line is the energy of the incident neutron when the energy lost in the target is assumed to be zero. Note that for equal incident neutron energies, the spline fit which corrects for energy loss has longer total times of flight.
Deuteron Kinetic Energy from Total ToF Spline Fit
!.300 E250 U E200 2150- -0100-0 ca
Figure 4-4: The blue line is the kinetic energy of the elastically scattered deuteron when energy lost by the deuteron in the liquid deuterium target is compensated for; the red line is the kinetic energy of the scattered deuteron when the energy lost in the target is assumed to be zero. Note that for equal deuteron energies, the spline fit which corrects for energy loss should have a shorter total time of flight, because higher energy neutrons produce higher energy deuterons. [Check This Tomorrow]
Chapter 5
Measurement of Elastically
Scattered Deuteron
5.1
Identification of Elastically Scattered Deuteron
The charged particle telescope described in Section 2.5.3 can be used to distinguish between elastically scattered deuterons and quasielastically scattered protons. The CsI calorimeter is thick enough to completely stop the deuteron or proton; thus its output signal depends on the kinetic energy of the particle. The DE2 (AE) thin plastic scintillator does not stop charged particles with energies of our concern; it outputs a signal which depends on both the particle's kinetic energy and velocity. Because a deuteron has a mass about twice that of a proton, a deuteron with the same kinetic energy as a proton will deposit more energy in the DE2 detector than the proton will. The CsI detector depends on the kinetic energy, mass and charge of the particle in a different manner than the DE2 detector does. Deuterons can be identified by comparing the DE2 output signal to the CsI output signal. The CsI output signal and the DE2 output signal are recorded by separate ADCs. This is shown in Figure 5-1.
For runs in which the target was filled with liquid deuterium, there were
9.35-107 triggers recorded in this experiment. The majority of these triggers were used
DE2 ADC vs CsI ADC Liquid Deuterium Target Runs 2000 C - - Entries 6259947 I1800 _ Mean x 496 1 ~Mean y 818.9 1600 -- Deuterons RuS x 274.7 1400RMS y 323.2 01400-1200 101 1000 800 600 400 200 tons 0 200 400 600 800 1000 1200 1400 1600 1800 2000 CsI ADC [Chn]
Figure 5-1: The DE2 ADC value plotted against the CsI ADC value when the target is filled with liquid deuterium. Events outside the black graphical cut are considered to be from particles which are not deuterons.
particle telescope (or elastic) trigger, which required a to pulse and a coincidence between the CsI and DE2 detectors, was used for the determination of the number
of scattered deuterons. There were 6.26 -106 elastic triggers. Of the elastic triggers
4.65. 105 were caused events in the graphical deuteron cut shown in Figure 5-1.
5.2
Total Time of Flight of the Neutron and
Elas-tically Scattered
The total time of flight of the incident neutron and elastically scattered deuteron determines the energy of the incident neutron and scattered deuteron as described in Section 4.4. The total time of flight is determined with the help of two TDCs. The start signal of the first TDC is the elastic trigger. The output signal of the DE2 detector is sent to a CFD, which outputs a logic signal that serves as the stop signal of the first TDC. Additionally, the to signal is recorded by the second TDC. This to is subtracted from the value of the first TDC to determine the total time of flight of the neutron and deuteron. Because the DE2 detector is made of plastic scintillator
.
while the CsI detector is a CsI crystal, the DE2 detector has better timing resolution than the CsI detector. The timing resolution is estimated by taking the standard deviation of a Gaussian fit to the -- flash. The -- flash is discussed in Section 3.2. The DE2 Gaussian fit has a standard deviation of 0.4 ns, which serves as an estimate of the minimum timing resolution of the detector. The DE2 detector was calibrated
using a time calibrator and 7-flash identification. The -- flash arrives at the DE2
detector 63.3 ns after the proton beam collides with Target 4. The calibrated DE2 ToF spectrum is shown in Figure 5-2.
DE2 Time of Flight
Entri 6259947Mean 110.2 -00 . RMS 27.3 0 000 40000 -20000 - y-flash 10000
-en
50 100 150 200 2503
0 TOF (nsecFigure 5-2: DE2 calibrated TOF, the -y-flash is visible around 60 ns.
Because the CsI detector has worse timing resolution than the DE2 detector, its time of flight spectrum was not used in the analysis. However, it should look qualitatively similar to the time of flight spectrum of the DE2 detector. The CsI was calibrated in the same manner as the DE2 detector was. Note that the --flash is smeared out, as shown in Figure 5-3.
The total time of flight of the incident neutron and elastically scattered deuteron as determined by the DE2 detector was converted into an incident neutron energy spectrum, shown in Figure 5-4, as described in Section 4.4. This spectrum has a different shape than the incident neutron energy spectrum derived from the fission chamber, shown in Figure 3-4. One possible explanation for this is that the cross
Endre 6250647
10000
-Figure 5-3: CsI calibrated TOF, the smeared out 'y -
flash
is visible around 60 ns.section for neutron-deuteron scattering differs from the cross-section for neutron in-duced fission. Another possibility is that low energy neutrons scatter deuterons which do not have enough energy to escape from the target. Finally, Figure 5-4 does not account for energy loss of the elastically scattered deuteron in the liquid deuterium target; this loss is accounted for in Figure 5-11.
NEnergy Calculated from Deuteron ToF
200 _Mean. 319.9
1600-
1400-0 -- 200 0 0 00 9 00
incident Neutron Kinetic Energy [MeV]
j
Figure 5-4: Incident eneto eegped by total time of flight of the incident
neutron and scattered deuteron as described in Section 4.4.
5.3
Number of Detected Deuterons
as
a Function
of Incident Neutron Energy
The effective target thickness, xeff, should be independent of the energy of the
in-cident neutron, thus measuring it for a few different inin-cident neutron kinetic energy ranges serves both to increase the statistics and as a test of the error associated with the measurement. The incident neutron kinetic energy ranges used, in MeV, were 140 ± 5,160 ± 5, 180 ± 5,200 ± 5, 220 ± 5 and 240 ± 5. These energy ranges were chosen because the neutron deuteron elastic scattering cross section is well known at these energies for similar angles of scattering to the angle of scattering used in this
experiment (400 in the lab frame) [4].
The energy of the incident neutron is determined by the total time of flight of the neutron and elastically scattered deuteron, as described in Section 5.2. When an incident neutron energy cut is made it selects out a small region of the deuterons shown in Figure 5-1. This is shown in Figure 5-5.
~00W 10 logo ~14W0 12W 1 100 1-400 200 0 100 200300 4 5 m ON " 10 Col ADC [Chn R140 1 1200 1010' 0000' 0 1002W 2W 4t 54W 700W W 10W C$1 ADC lChol DEaC vCDC - 00 g1Wi14hl - 1000-~14W0 ~1200 M m o- I 2a:-no Iwo". 0 102 W4 W W70W2123W low[ 1 4 00 M goM00 20, A Cn DEEAC4vsCalDC sgp17-185M0V [ema1as ~1m0 1200 100-200 Cal ADC [Chn]
DE2i AD= -C.DC AmMa
0141 1200 1g00 1000 400 20,0
Cal ADC (Chol
Figure 5-5: DE2 vs CsI ADC spectra when the graphical deuteron cut in Figure 5-1 is applied for 6 different cuts on 10 MeV ranges of incident neutron kinetic energy