HAL Id: inserm-01653778
https://www.hal.inserm.fr/inserm-01653778
Submitted on 1 Dec 2017HAL is a multi-disciplinary open access archive for the deposit and dissemination of sci-entific research documents, whether they are pub-lished or not. The documents may come from teaching and research institutions in France or abroad, or from public or private research centers.
L’archive ouverte pluridisciplinaire HAL, est destinée au dépôt et à la diffusion de documents scientifiques de niveau recherche, publiés ou non, émanant des établissements d’enseignement et de recherche français ou étrangers, des laboratoires publics ou privés.
Observation of Ripple Phase Transitions
Hirohide Takahashi, Atsushi Miyagi, Lorena Redondo-Morata, Simon
Scheuring
To cite this version:
Hirohide Takahashi, Atsushi Miyagi, Lorena Redondo-Morata, Simon Scheuring. Temperature-Controlled High-Speed AFM: Real-Time Observation of Ripple Phase Transitions. Small, Wiley-VCH Verlag, 2016, 12 (44), pp.6106 - 6113. �10.1002/smll.201601549�. �inserm-01653778�
Temperature-controlled high-speed AFM:
Real time observation of ripple-phase transitions
AUTHOR NAMES
Hirohide Takahashi1#, Atsushi Miyagi1#, Lorena Redondo-Morata and Simon Scheuring1*
#These authors have equally contributed to the work. AUTHOR ADDRESS
1 U1006 INSERM, Université Aix-Marseille, Parc Scientifique et Technologique de Luminy, 163 avenue de Luminy, 13009 Marseille, France
KEYWORDS
High-speed atomic force microscopy / Lipid bilayer / Phase transition / Ripple phase / Heater equipment / Temperature control
ABSTRACT
With nanometer lateral and Angstrom vertical resolution, atomic force microscopy (AFM) has contributed unique data improving the understanding of lipid bilayers. Lipid bilayers are found in several different temperature-dependent states, termed phases, the main phases are solid and fluid phases. The transition temperature between solid and fluid phases is lipid composition-specific. Under certain conditions some lipid bilayers adopt a so-called ripple phase, a structure where solid and fluid phase domains alternate with constant periodicity. Because of its narrow regime of existence and heterogeneity ripple phase and its transition dynamics remain poorly understood. Here, we developed and integrated a temperature-control device to high-speed atomic force microscopy (HS-AFM) to observe dynamics of phase transition from ripple phase to fluid phase reversibly in real time. Based on HS-AFM imaging, the phase transition processes from ripple phase to fluid phase and from ripple phase to metastable ripple phase to fluid phase, could be reversibly, phenomenologically and quantitatively studied. Our results show phase transition hysteresis in fast cooling and heating processes, while both melting and condensation occurs at 24,15°C in quasi-steady state situation. A second metastable ripple phase with larger periodicity is formed at the ripple phase to fluid phase transition when the buffer contains Ca2+. The presented temperature-controlled HS-AFM is a new unique experimental system to observe dynamics of temperature sensitive processes at the nanoscopic level.
TEXT
The matrix of a biological membrane is a phospholipid bilayer. A complex cell membrane is not homogeneous but rather a mosaic of proteins and lipids that form nanodomains of varying composition and physical properties. Sphingolipid-phospholipid segregation has been documented in rafts. The main components of rafts, sphingolipids and cholesterol, form liquid ordered nanodomains surrounded by liquid disordered phospholipids. Hence, phase heterogeneity of biological membranes, such as in and around rafts, is relevant for function and modulation of biochemical processes in cells[1,2].
Like in the cellular context, biomimetic membranes, typically studied as giant unilamellar vesicles (GUVs)[3], vesicle suspensions[4] or supported lipid bilayers (SLBs)[3], adopt different phases, solid (gel phase) and fluid phases (liquid ordered and liquid-disordered phases). The occurrence of these phases depends on the lipid nature, temperature and the environmental conditions. When the temperature changes, the dynamics and structure of the lipids in the bilayer change and hence they transit from one phase to another, a process also known as ‘phase transition’. At low temperatures lipids are arranged on a triangular lattice, known as solid phase (or gel phase or Lβ). In contrast, at high temperatures lipids are in the liquid phase (or fluid phase or Lα). These two terms describe two different structural orders in membranes that are directly related to the order-disorder transition of the hydrocarbon chains of the phospholipids. Phase transitions of lipid bilayers have been studied intensely by Monte-carlo simulations, X-ray diffraction, calorimetry, conventional AFM and other techniques [5–10]. At low temperature, lipid bilayers exist as solid phase with low mobility of lipid molecules. When the lipid bilayers are heated, the lipid molecules diffuse freely in the 2D-plane of the bilayer and transit into fluid phase. As an intermediate in lipid bilayers, a phase termed ripple phase may occur, in which solid and fluid phase coexist with a constant periodicity (which is lipid dependent)[11]. Ripple phases are curved structures with undulating surface topography. The temperature range in which ripple phases appear is narrow and slightly below the main phase transition to fluid phase. Since the discovery of ripple phase[12,13], its structure has been studied by various approaches, such as electron microscopy[14–16], X-ray diffraction[17], scanning tunnel microscopy[18,19] and atomic force microscopy (AFM)[20,21].
AFM has significantly contributed to study lipid ripple phases. AFM imaging has revealed the structure of ripple phase in hydrated condition at the nanometer scale. Especially, temperature-controlled AFM has elucidated the initial and end points of the phase transition process of ripple phase lipid bilayers[22–24]. In the ripple/fluid phase transition, the
partially organized ripple phase alters its state to the fluid phase, which is flat and has high fluidity. Because of the particular structural features of ripple phase, the process of the transition between ripple and fluid phase was ideal to be observed by AFM. However, conventional AFM could not provide insights into the dynamics of the phase transition process because of lacking temporal resolution. In this study, we have developed a temperature-control system for a high-speed atomic force microscope[25] and report direct analysis of two ripple phases to fluid phase transitions (reversibly) in real time and at high resolution.
Ripple phase is an intermediate between solid phase and fluid phase, it can be found when solid phase lipids experience increased temperature and go into fluid phase, and alternatively it occurs when the fluid phase is cooled down. The observation of a phase transition process is characterized by a melting point temperature of the ripple phase to fluid phase, nucleation point and growth directionality for the formation of the ripple phase. To observe dynamics in formation and deformation of ripple phase, we developed a temperature-control system for HS-AFM (Fig. 1A). In order to do so, we applied by surface sputtering a tungsten coating onto the glass coverslip that is at the basis of the HS-AFM fluid cell. The tungsten coat is connected to a power supply and the resistance that it provides upon voltage application is dissipated as heat into the liquid volume of the HS-AFM fluid cell (Fig. 1B). Using a thin thermocouple immersed into the fluid cell (Fig. 1B), we measure the temperature in the imaging solution during application of an input voltage to the resistance. Using this system, the temperature of the buffer solution within the HS-AFM fluid cell increases with about 0.4°C/s and reaches well-defined temperatures within 30 seconds – suitable for HS-AFM imaging - and can be maintained at given temperatures over extended experimental time spans with precision of about 0.5°C (Fig. 1C). Due to temperature dissipation out of the water bath, continuous application of a given voltage onto the resistance maintained constant temperature that needed only minor correction. Precise temperature recording during imaging was achieved by means of a thermocouple micro-thermometer that was placed as near as possible to the HS-AFM cantilever in the fluid cell (Fig. 1B).
For the study of ripple phase transitions with HS-AFM, 1,2-Dimyristoyl-sn-Glycero-3-Phosphocholine (DMPC) was chosen as a model system because the transition temperature from solid to fluid phase where the ripple phase occurs, is in the range between 24°C and 27°C on a supported substrate[26]. DMPC SLBs were formed from vesicle fusion of large unilamellar vesicles (LUVs), resulting in planar bilayers.
(Fig. 2A, t=0s). The entire surface of the lipid bilayer was covered by ripples; reporting the coexistence of curved solid and fluid phases at this temperature (with a periodicity of 16.0 ± 0.24 nm). Then, the temperature control unit was activated to increase the temperature in the imaging chamber (heating velocity: ~0.03°C/s) (t=15s to t=126s). At 26.0°C in the heating process, an initial melting point of fluid phase appeared on the top edge of the lipid patch. Melting progressed away from the initial melting location to transit the entire patch from ripple into fluid phase (t=30s to t=126s). At 27.5°C, the entire area of the lipid patch had transitioned into fluid phase (t=126s). At this moment, the heating was stopped to recover 24.7°C. Upon cooling down, the ripple phase reappeared (cooling velocity: ~0.03°C/s) (Fig. 2A, t=140 to t=174s). Interestingly, ripples occurred as concentric rings progressing from the edge region of the lipid patch towards the center upon cooling. This result might be explained in several ways: First, the circular lipid patch remained hottest in the center (despite its nanometric dimensions) and cooling progressed from the edges that expose the largest surface to the cooling bulk. Second, the bending and edge formation of the lipids at the patch border represented favorable nucleation spots for ripple phase reformation. The reformation of ripple phase from the bilayer edges in a concentric manner was a reproducible phenomenon in all circular lipid patches we observed (Supplementary movies
S1).
Section analysis of the lipid patch (Fig. 2B) showed that the maximum height of the lipid patch was around 4.7nm in the ripple area and constant around 4.0nm in the fluid area (center of the patch and section profile), which are typical values for DMPC lipid bilayers in solid and fluid states, respectively[27]. Statistical analysis of the ripples revealed that the periodicity was 16.0 ± 2.4 nm (Fig. 2C) and the height difference was 1.2 ± 0.4 nm (Fig. 2D), in good agreement with previously reported data[28,29]. Analyzing the relative surface area occupied by either ripple or fluid phase on the patch, the phase transition could be plotted as a function of temperature and time (Fig. 2E). In the heating process, the transition temperature (defined as the temperature where 50% of the patch area transited from the ripple phase to fluid phase) was 26.9°C. On the other hand, the transition temperature during the cooling process was estimated as 25.7°C. This gap of the transition temperature between the heating and cooling processes is highlighted when fitting the relative area occurrence of the phases as a function of temperature resulting in a strong hysteresis around 26.3°C (Fig. 2F). More heat is needed to melt the ripple phase than during condensation. This might be caused by initial heat conversion into intramolecular dynamics, molecular interaction between the solid phase lipids before increased lipid mobility induces phase
transition, or an influence of the substrate support.
To gain further insights into the ripple/fluid phase transition, we carried out an experiment in the presence of 1mM calcium ions (Ca2+). The presence of Ca2+ has been reported to increase by about 1°C the transition temperature range from ripple phase to fluid phase[28]. We performed a similar temperature-sweep HS-AFM imaging experiment as described above, but this time in the presence of 1mM calcium chloride (Fig. 3A,
supplementary movies S2). Initially, the entire area of the lipid patch was ripple phase with
periodicity of about 16nm, reminiscent of the ripples reported above (Fig. 3A, t=0s). Then during temperature increase (heating velocity: ~0.01°C/s), interestingly, at 25.6°C, instead of ripple phase melting, a second type of ripple phase with 26 nm periodicity, which has previously been described as metastable (Λ) ripple phase[24,30], appeared (Fig. 3A, t=30s). Significantly, the nucleation point of the metastable ripple phase was located at a position where the initial ripple phase was least ordered (compare Fig. 3A, t=30s with t=0s). Since the metastable ripple phase is often formed at the main transition temperature of the cooling process, the nucleation point of the metastable ripple phase may indicate the hottest point in the lipid patch, with the most fluid area to begin with. During the process of further heating to 27.2°C (Fig. 3A, t=30s to t=120s), the metastable ripple phase dominates over the initial ripple phase and spreads over the entire area of the lipid patch. As the temperature is further increased the metastable ripple phase melts into the fluid phase (Fig. 3A, t=120s to t=240s). Section analysis showed the difference of periodicity and amplitude of ripple phase and metastable ripple phase (Fig. 3B). Periodicity and height difference of the metastable ripples were 26.0 ± 3.8 nm (Fig. 3C) and 3.8 ± 0.7 nm (Fig. 3D), respectively. The imaged phase transitions were analyzed according to the relative area the phases occupied on the membrane and plotted against time and temperature (Fig. 3E). The transition temperature from ripple phase to metastable ripple phase was 26.8°C (Fig. 3E, F), identical to the transition temperature of ripple phase to fluid phase in the absence of calcium (see Fig. 2E). The transition temperature from metastable ripple phase to fluid phase was 28.2°C. These results suggest that calcium ions structure the bilayer to an extent that instead of a transition to fluid phase a second type of ripple phase is formed between 26.8°C and 28.2°C (Fig. 3F).
We then analyzed by HS-AFM the ripple/fluid phase transition on large membrane areas, more than several µm2 and much larger than our scan area (Fig. 4A). Again, we imaged the ripple phase area while adjusting and recording temperature with the particularity that we tried this time to apply fast temperature jumps, from 22°C to 32°C within a few seconds (heating velocity: ~0.98°C/s) (Fig. 4B). Initially, without heating, the ripple phase
covered the bilayer over the entire imaged area (Fig. 4A, t=0s). Increasing the voltage onto the tungsten coat resistor, we achieved 30.9°C within less than 5 seconds (Fig. 4A, t=17s to 22s). The ripple phase immediately started transiting into fluid phase. The transition started from several melting locations and proceeded uniformly throughout the imaging area (Fig. 4A, t=18s). At 30.9°C the entire area of the ripple phase transitioned into fluid phase (Fig. 4A, t=22s). Most of the melting locations occurred at ripple phase interfaces, i.e. locations where ripples of different orientations meet. In the cooling process, the ripple phase reappeared (cooling velocity: ~0.17°C/s) (Fig. 4A t=28 to 53s). Heating/cooling cycles were repeated several times while imaging (Fig. 4B, supplementary movies S3). For quantitative analysis of the ripple/fluid phase transition processes and back to ripple phase, we plotted the relative surface area occupied by ripples versus temperature from all heating/cooling cycles (Fig. 4C): During heating, the transition temperature defined as the temperature when 50% of the ripple phase melted into fluid phase was 28.9°C. Reversely, half of the fluid phase area condensed into ripple phase at 25.1°C in the cooling process. Previously, the transition temperature from ripple phase to fluid phase in DMPC SLBs has been reported as 23.35°C by conventional AFM[28]. We attribute the slightly higher phase transition temperature measured here by HS-AFM to the fact that the HS-AFM tip has lower energy delivery (force and contact time) into the system than the slow conventional cantilevers[25]. Yet the high transition temperature recorded during the melting process is another manifestation of an even larger hysteresis due to the faster heating process as compared to the slower process shown above (see Fig. 1).
We further investigated from these heating/cooling cycle experiments whether the bilayer maintained any sort of memory about the initial ripple phase structure after it had transformed into fluid phase. We found that throughout the 5 cycles of heating/cooling, the ripple phase pattern has each time been different. The angular change of ripple orientation between images before and after the heating/cooling process at the same locations was plotted and no angular correlation between ripple patterns before and after a melting process was found (Fig. 4D). This result clearly suggests that the thermal history of the bilayer is erased in the fluid phase. Since the fluidity of the lipids in fluid phase is higher than in the ripple phase, the nucleation location and orientation of a ripple pattern (in these large bilayers) during the cooling process is probably determined by the interaction of any two “cooler” lipid molecules interacting, and is hence a stochastic process. Since the regression and progression of the ripple phase is directly related to the diffusion of the lipid molecules at the phase interfaces, we can estimate the diffusion of the lipid molecules at the phase
boundary that should directly relate with the propagation speed (area gain) of the fluid phase. In these fast heating/cooling experiments on large bilayers we can assess the speed of regression of the ripple phase as 0.23 ± 0.01 µm2/s during the heating phase transition (Fig. 4A, t=17s to t=22s, supplementary movies S3). This value is close to the diffusion value of DMPC lipid measured by FRAP[31]. The speed of ripple phase formation during cooling was slower 0.053 ± 0.005 µm2/s (Fig. 4A, t=26s to t=50s), in agreement with the formation of a mixed phase where the dynamics of fluid and solid phase molecules are averaged. Furthermore, this process occurs – due to the hysteresis of the process – at a lower temperature. These results show that the temperature-controlled HS-AFM opens the possibility to estimate dynamic properties of lipid molecules at visible phase transitions.
The increased hysteresis detected when heating and cooling processes were performed fast, indicated that this phenomenon was related to out-of-equilibrium measurement conditions. To test this, we implemented a feedback loop within the temperature control circuit between the thermocouple and the tungsten-coated glass slide heater unit (see Fig. 1). Keeping the temperature over extended periods of time close to 24°C trying to achieve quasi steady-state conditions, HS-AFM imaged ripple/fluid phase transitions (Fig. 5A). Analyzing ripple phase area and temperature versus time traces (Fig. 5B), we found that the transition temperature (independent on whether it occurred during melting or condensation) was rather constant with 24.15 ± 0.15°C, corroborating that a steady state condition is almost reached. Importantly, imaging of coexistence of ripple and fluid phase areas were achieved over more than 5 minutes (between t=1000s and t=1404s) where the temperature was kept constant within about half of a degree.
In order to evaluate quantitatively and thermodynamically the phase transition processes analyzed here, we calculated the phase transition enthalpy for each condition. Based on the van’t Hoff expression, the equilibrium constant K of a phase transition changes with temperature T following:
𝑙𝑛𝐾 =
∆𝐻𝑣𝐻 𝑅(
1 𝑇0−
1 𝑇)
(1)where ΔHvH is the van’t Hoff enthalpy of transition, R is the gas constant, T0 is the temperature at which K=1, which is in this case the transition temperature where half of the bilayer is in ripple phase and half in fluid phase. Following Enders et al.[28], the ripple phase area fraction f, can then be expressed as a function of temperature T as:
𝑓 =
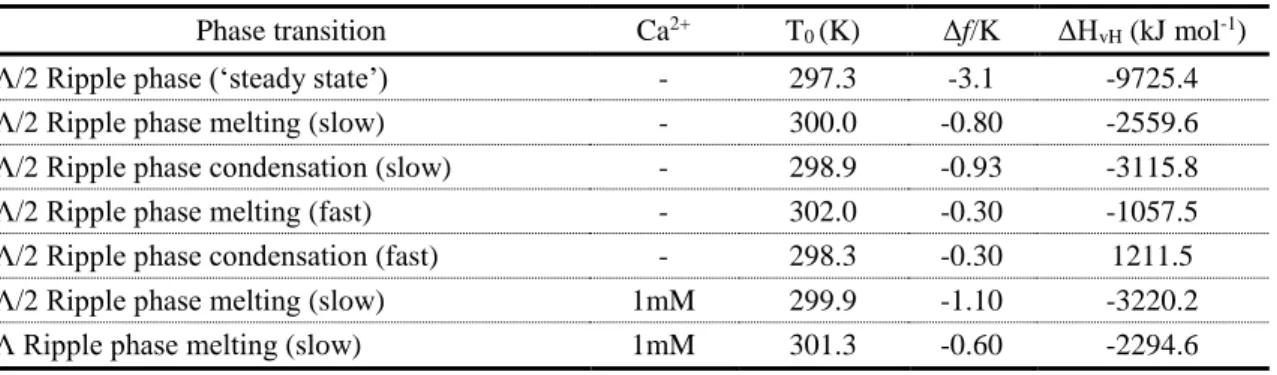
1 1+ 𝑒( ∆𝐻𝑣𝐻 𝑅 ( 1 𝑇− 1 𝑇0)) (2)Accordingly, ΔHvH, T0 and the slope of the transition at T0 were calculated by fitting the phase transition data acquired under the various conditions using equation 2 (Table 1). As discussed above, for those conditions where heating and cooling were performed fast, we detected a temperature hysteresis between the melting and the condensation processes (T0 (melting-fast) =302.0K and T0 (condensation-fast) =298.3K). This is less pronounced when heating and cooling are performed slowly (T0 (melting-slow) =300.0K and T0 (condensation-slow) =298.9K), and not at all when we keep the temperature on the transition point by feedback control reaching a quasi steady-state situation (T0(melting-‘steady-state’)=297.3K and T0(condensation-‘steady-state’)=297.3K) (Table 1, column 3). The fact that the hysteresis is larger the faster the process is induced, indicates that the process is under these conditions far out of equilibrium. In this context it is notable that the slopes of the transitions are steeper when the temperature transitions are performed slowly and shallower when the process is driven fast (Table 1, column 4; compare
Figs. 2F and 4C). The transition slopes at T0 report about cooperativity of the molecules in the bilayer during the process, and the steep slopes during slow heating and cooling indicate that molecules that transit into the other phase influence their neighbors, while the shallow slopes when the process was fast may be interpreted as a far out of equilibrium process where the molecules do not have the time to interact with each other. The slope and the cooperativity of each process also accounts for the order of the transition. The steeper and more cooperative are related to first order transitions, were the latent heat is required to change the phase, while in second order transitions the heat is also necessary for changing the temperature. Finally, the van’t Hoff enthalpy values (Table 1, column 5) under slow transition conditions - with or without calcium - were similar to previously reported[28]. In contrast, the van’t Hoff enthalpy values during fast temperature change condition were three times larger indicating a lack of cooperativity between individual DMPC molecules leading to higher energy consumption for the transition process.
Phase transition Ca2+ T
0 (K) Δf/K ΔHvH (kJ mol-1)
Λ/2 Ripple phase (‘steady state’) - 297.3 -3.1 -9725.4
Λ/2 Ripple phase melting (slow) - 300.0 -0.80 -2559.6
Λ/2 Ripple phase condensation (slow) - 298.9 -0.93 -3115.8
Λ/2 Ripple phase melting (fast) - 302.0 -0.30 -1057.5
Λ/2 Ripple phase condensation (fast) - 298.3 -0.30 1211.5
Λ/2 Ripple phase melting (slow) 1mM 299.9 -1.10 -3220.2
Λ Ripple phase melting (slow) 1mM 301.3 -0.60 -2294.6
Table 1: Quantitative and thermodynamic analysis of the phase transition processes.
spatio-temporal resolution by temperature-controlled HS-AFM. Real-time observations of the transition process of two types of ripple phases with different periodicities, 16nm and 26nm, respectively, have been achieved in the absence and presence of calcium ions. In the absence of Ca2+, we find a hysteresis between the melting and condensation processes that we term transition regime. This implies that the critical temperatures where the two phases occupy 50% each of the relative membrane area are clearly separated between the heating and cooling process. This hysteresis in the phase transition has been reported by studies with conventional AFM and differential scanning calorimetry[28,32,33]. However, these were rather small temperature differences, while we find here that the faster the process takes place, the larger the hysteresis (Table 1). Since our temperature measurement is a real-time read-out of the buffer temperature close to the tip, and heat should propagate fast in such small liquid volumes, we reason that the effect indeed emerges from the supported membrane. Interestingly, the metastable ripple phase (that only exists in the presence of Ca2+) rather precisely spans the temperature range between the melting transition points during slow heating and fast heating experiments, evidence that Ca2+ stabilizes the PC headgroups, maybe intercalating the phosphocholines[34], allowing some solid–like lipid areas to ‘survive’ up to temperatures where the ripple phase melts in the fastest possible transition accessible in our experiments. We propose that molecular dynamics simulations may shed light into Ca2+-PC interaction in the context of phase transitions[9,34]. In addition, we showed that ripple phase melting or the transition from ripple phase to meta-stable ripple phase occurred at locations where ripple pattern interfaces (disorders) were detected. These disordered areas probably comprised a slightly higher amount of liquid-like lipid molecules and hence present ideal locations for initiation of melting or nucleation of the meta-stable ripple phase. Furthermore, the local transition of the bilayer into fluid phase, i.e. a complete mixing of the lipids at high lateral dynamics, leads to a “loss of memory” of the bilayer. This finding could have implications for more complex cellular systems where lipid nanodomains form and dissociate reversibly.
HS-AFM has been utilized for imaging the diffusion dynamics of various biological membrane samples, such as membrane protein diffusion[35–37] and diffusion of pore forming toxins [38–40]. Most recently, HS-AFM has revealed the assembly dynamics of the ESCRT-III system on a bilayer[41]. Temperature-controlled HS-AFM presents itself as a powerful tool for the real-time analysis of temperature-sensitive processes, such as dynamics of enzymatic reactions, protein unfolding and membrane proteins diffusion. It will further allow accommodating mammalian proteins and cells to native-like environmental conditions. The
development of temperature-controlled HS-AFM completes a series of developments that allows buffers to be gradually exchanged and molecules to be uncaged during HS-AFM operation, in our effort to make the HS-AFM a versatile tool for dynamic structural biochemistry.
Materials and Methods
Sample preparation
1, 2-Dimyristoyl-sn-Glycero-3-Phosphocholine (DMPC, Avanti Polar Lipid, AL USA) was dissolved in chloroform to give a final concentration of 1 mM in a glass vial. The chloroform was dried up by a gentle nitrogen gas blowing. The resulted lipid thin film was then hydrated with Milli-Q water to result in a 1 mM DMPC lipid suspension. The mixture was then frozen at -80°C, thawed and sonicated for 15 minutes in a bath sonicator. This “freeze-thawing and sonication” process was repeated another time. The prepared liposome solution was then added onto a freshly cleaved mica support attached to a glass rod on the HS-AFM scanner. After 10 minutes incubation at room temperature, excess lipid was carefully removed by rinsing with Milli-Q water and used for the imaging with HS-AFM.
Temperature control equipment for HS-AFM
The bottom glass plate of a HS-AFM cantilever holder was coated with tungsten deposit using a high vacuum sputter coater in argon environment (EMSCD500, LEICA). The tungsten coat had a typical thickness of 35nm and resistance value of 200 Ω. Both ends of the glass plate were connected to a DC Power supply (IPS4303, ISOTECH) via cables with conductive glue. The tungsten coated glass plate was then assembled into the cantilever holder of the HS-AFM. For the measurement of temperature during imaging, a thermocouple with 0.075 mm diameter (Thermocouple Type K, RS pro) was placed underneath and in contact with the cantilever chip, 1 mm away from the HS-AFM tip, connected to a thermometer. Contact of the thermocouple to the cantilever chip and proximity to the tip assure rapid and precise assessment of the actual temperature at the point of investigation. The temperature was recorded every second, in accordance with the frame rate.
High-Speed Atomic Force Microscopy (HS-AFM)
solution with a HS-AFM[42] (Research Institute of Biomolecule Metrology Co., Ltd. Tsukuba, Japan). We used EBD-functionalized cantilevers with a nominal spring constant of 150 pN nm−1 (USC-F1.2 k0.15, Nanoworld, Neuchâtel, Switzerland). The imaging was carried out in amplitude modulation mode. The drive resonance frequency was typically set between 600 kHz and 700 kHz. During imaging, the free oscillation amplitude Afree was set 1 nm with minimal setpoint amplitude damping (Aset > 0.9 nm) to avoid causing damage to the sample. Images were captured at a scan rate of about 1 second per frame at 300 x 300 pixels. Data analysis was performed using Image J with custom programmed plugin tool.
FIGURE LEGENDS
Figure 1. Development of temperature-controlled HS-AFM. (A) Schematic illustration of
the heating system for HS-AFM. The glass plate at the bottom of the cantilever holder fluid chamber was coated with tungsten to give a resistance of about 200 Ω, connected to a DC Power supply. The coating was excluded (about 1 mm2) beneath the cantilever to avoid that the tungsten coating interferes with the laser pathway. (B) Assembly of the tungsten coated glass, the cantilever and the thermocouple. The thermocouple was attached underneath the cantilever chip close to the HS-AFM tip to measure the local temperature at the imaging area. (C) Temperature as function of input voltage to the tungsten coated glass. The temperature inside the imaging chamber filled with 100 µl of Milli-Q water was measured by the thermocouple underneath the cantilever. The temperatures measured every 1 second at different values of input voltage (here from 8 V to 14 V) were plotted into against time.
Figure 2. AFM imaging of DMPC lipid bilayer phase transition. (A) Time-lapse
HS-AFM imaging of DMPC lipid bilayer patch on mica in Milli-Q water during a heating/cooling cycle (heating velocity: ~0.03°C/s; cooling velocity: ~0.03°C/s). Initially, the entire area of the lipid patch was covered with the ripple phase (t=0). Heating initiated at 10 seconds. At 26.0°C, ripple to fluid phase begins and is complete 27.5°C (t=126s). After stopping the heating, the transition from fluid to ripple phase started from the edge region of the lipid patch progressing concentrically towards the patch center (t=140s to t=174s). (Temperature and time are indicated in the top left corner of each image). (B) Left: Section analysis of ripple phase periodicity. Right: Section profile along the dashed line. (C) Ripple phase periodicity (16.0 +/- 0.24 nm; mean +/- STD), and (D) ripple phase height variation (1.22 +/- 0.35 nm; mean +/- STD). (E) Relation of temperature versus ripple phase and fluid phase occurrence in A). The percentage of area (the area of whole the lipid patch was defined
as 100%) occupied by ripple phase (□) and fluid phase (○) were plotted against temperature and elapsed time. (F) Analysis of transition temperature. The chart in E was fit to sigmoid fitting to calculate transition temperature in heating and cooling regime. The values of transition temperature (defined as the temperature at 50% ripple phase and 50% fluid phase occurrence) were determined as 26.9°C during heating and 25.7°C during cooling.
Figure 3. HS-AFM imaging of DMPC lipid bilayers phase transitions in presence of 1 mM calcium chloride. (A) In presence of 1 mM CaCl2 at 24.7°C displayed the typical 16nm ripple phase pattern (t=0). At 25.6 °C, a second type of ripple phase with larger periodicity emerged and spread over the entire area of the lipid patch up to 27.2°C. Upon further heating, at 27.6°C, the top area of the large ripple patch started to melt into fluid phase and the fluid phase area spread toward the bottom part of the lipid patch and the entire area of the lipid patch was transited to the fluid phase at 29.2°C (heating velocity: ~0.01°C/s). (B) Section analysis of both types of ripple phases. (C) Ripple phase periodicity (26.1 3.8 nm; mean STD), and (D) ripple phase height variation (3.83 0.73 nm; mean STD). (E) Relation of temperature and occurrence of the two types of ripple phases as imaged in A). The percentage of relative area (the area of whole the lipid patch was defined as 100%) of ripple phase (□), metastable ripple phase (○) and fluid phase (△) were plotted against temperature and elapsed time. The values of transition temperature (estimated as the temperature at 50% area of one phase to another) from ripple phase to metastable ripple phase was 26.8°C and from metastable ripple phase to fluid phase was 28.2°C. (F) Analysis of transition temperature. The chart in E was fit to sigmoid fitting to calculate transition temperature in heating and cooling regime. The values of transition temperature (estimated as the temperature at 50% area of one phase to another) from ripple phase to metastable ripple phase was 26.8°C and from metastable ripple phase to fluid phase was 28.2°C.
Figure 4. Time-lapse analysis of DMPC lipid bilayers in repeated reversible ripple phase to fluid phase transition. (A) HS-AFM imaging of a large area (1µm2) DMPC lipid bilayer during several heating/cooling cycles. Immediate heating steps of 12V to the resistance giving about 32°C were applied repetitively. From 17s to 22s, the ripple phase area was transiting to fluid phase. After stopping heating at 25s, the transition of fluid phase to ripple phase occurred (from 38s to 53s) (heating velocity: ~0.98°C/s; cooling velocity: ~0.17°C/s). (B) Relation of temperature and ripple phase area occurrence in supplementary movie S3. (C) Phase transition from fluid phase to ripple phase and back as a function of
temperature. The transition temperature (estimated as the temperature at 50% area of one phase to another phase) was estimated as 28.9°C during heating and 25.1°C during cooling. (D) Analysis of the angular change of the ripple phase lines in images before and after phase transition to fluid phase.
Figure 5. HS-AFM imaging of DMPC lipid bilayer ripple/fluid phases transitions at the transition temperature (quasi steady-state). (A) Time-lapse HS-AFM imaging of a DMPC
SLB on mica in Milli-Q water while trying to maintain the temperature (~24°C) at the phase transition temperature using feedback control. Fluctuations of the ripple phase area are observed. Coexistence of ripple and fluid phases within the scan area is achieved over more than 5 minutes (between t=1000s and t=1404s). (B) Percentage of ripple phase area of the entire DMPC lipid bilayer area (black line) and temperature (blue line) recorded as a function of imaging time-lapse. Using feedback adjusted temperature control the temperature in the fluid cell could be maintained close to 24°C over extended periods of time (about 20 minutes, t=300s to t=1500s). Specific time points when representative images shown in (A) were recorded are indicated by the dashed grey lines. The transition temperatures (red circles) recorded when the ripple phase area covered 50% of the entire membrane was 24.15 ± 0.15 °C and was constant (within the experimental error) during melting and condensation.
AUTHOR INFORMATION
Corresponding Author
Simon Scheuring Email: simon.scheuring@inserm.fr Tel.: ++33-4-91828777, Fax: ++33-4-91828701
Author Contributions
Hirohide Takahashi and Atsushi Miyagi have equally contributed to the work.
ACKNOWLEDGMENT
This work was funded by the ANR grant financing the A*MIDEX program (ANR-11-IDEX-0001-02) and a European Research Council (ERC) Starting/Consolidator Grant (#310080-MEM-STRUCT-AFM).
REFERENCES
[1] K. Simons, E. Ikonen, Nature 1997, 387, 569.
[2] G. van Meer, D. R. Voelker, G. W. Feigenson, Nat. Rev. Mol. Cell Biol. 2008, 9, 112. [3] E. T. Castellana, P. S. Cremer, Surf. Sci. Rep. 2006, 61, 429.
[4] R. C. MacDonald, R. I. MacDonald, B. P. M. Menco, K. Takeshita, N. K. Subbarao, L. Hu, Biochimica et Biophysica Acta (BBA) - Biomembranes 1991, 1061, 297.
[5] J. Nagle, Annu. Rev. Phys. Chem. 1980, 31, 157. [6] A. Alessandrini, P. Facci, Soft Matter 2014, 10, 7145.
[7] M. J. Janiak, D. M. Small, G. G. Shipley, J. Biol. Chem. 1979, 254, 6068. [8] M. J. Janiak, D. M. Small, G. G. Shipley, Biochemistry 1976, 15, 4575. [9] T. Heimburg, Biophys. J. 2000, 78, 1154.
[10] S. C. Chen, J. M. Sturtevant, B. J. Gaffney, Proc. Natl. Acad. Sci. U.S.A. 1980, 77, 5060.
[11] J. F. Nagle, S. Tristram-Nagle, Biochim. Biophys. Acta 2000, 1469, 159. [12] A. Tardieu, V. Luzzati, F. C. Reman, J. Mol. Biol. 1973, 75, 711.
[13] A. J. Verkleij, P. H. Ververgaert, L. L. van Deenen, P. F. Elbers, Biochim. Biophys. Acta
1972, 288, 326.
[14] B. R. Copeland, H. M. McConnel, Biochim. Biophys. Acta 1980, 599, 95. [15] H. W. Meyer, Biochim. Biophys. Acta 1996, 1302, 138.
[16] J. A. Zasadzinski, Biochim. Biophys. Acta 1988, 946, 235.
[17] W. J. Sun, S. Tristram-Nagle, R. M. Suter, J. F. Nagle, Proc. Natl. Acad. Sci. U.S.A.
1996, 93, 7008.
[18] J. T. Woodward, J. A. Zasadzinski, Biophys. J. 1997, 72, 964.
[19] J. A. Zasadzinski, J. Schneir, J. Gurley, V. Elings, P. K. Hansma, Science 1988, 239, 1013.
[20] S. W. Hui, R. Viswanathan, J. A. Zasadzinski, J. N. Israelachvili, Biophys. J. 1995, 68, 171.
[21] J. M. Zhifeng Shao, Advances in Physics - ADVAN PHYS 1996, 45, 1. [22] A. Charrier, F. Thibaudau, Biophys. J. 2005, 89, 1094.
[23] M.-C. Giocondi, C. Le Grimellec, Biophys. J. 2004, 86, 2218.
[24] T. Kaasgaard, C. Leidy, J. H. Crowe, O. G. Mouritsen, K. Jørgensen, Biophys. J. 2003,
85, 350.
[25] T. Ando, T. Uchihashi, S. Scheuring, Chem. Rev. 2014, 114, 3120.
[26] S. Mabrey, J. M. Sturtevant, Proc. Natl. Acad. Sci. U.S.A. 1976, 73, 3862. [27] H. Egawa, K. Furusawa, Langmuir 1999, 15, 1660.
[28] O. Enders, A. Ngezahayo, M. Wiechmann, F. Leisten, H.-A. Kolb, Biophys. J. 2004, 87, 2522.
[29] D.C. Wack, W. W. Webb, Phys. Rev., A 1989, 40, 2712.
[30] H. Yao, S. Matuoka, B. Tenchov, I. Hatta, Biophys. J. 1991, 59, 252.
[31] C. Scomparin, S. Lecuyer, M. Ferreira, T. Charitat, B. Tinland, Eur Phys J E Soft
Matter 2009, 28, 211.
[32] B. G. Tenchov, H. Yao, I. Hatta, Biophys. J. 1989, 56, 757.
[33] R. Koynova, A. Koumanov, B. Tenchov, Biochim. Biophys. Acta 1996, 1285, 101. [34] P. T. Vernier, M. J. Ziegler, R. Dimova, Langmuir 2009, 25, 1020.
[35] I. Casuso, J. Khao, M. Chami, P. Paul-Gilloteaux, M. Husain, J.-P. Duneau, H. Stahlberg, J. N. Sturgis, S. Scheuring, Nat Nanotechnol 2012, 7, 525.
[36] D. Yamamoto, T. Uchihashi, N. Kodera, T. Ando, Nanotechnology 2008, 19, 384009. [37] A. Miyagi, C. Chipot, M. Rangl, S. Scheuring, Nat Nanotechnol 2016, DOI
10.1038/nnano.2016.89.
[39] N. Yilmaz, T. Yamada, P. Greimel, T. Uchihashi, T. Ando, T. Kobayashi, Biophys. J.
2013, 105, 1397.
[40] I. Munguira, I. Casuso, H. Takahashi, F. Rico, A. Miyagi, M. Chami, S. Scheuring, ACS
Nano 2016, 10, 2584.
[41] N. Chiaruttini, L. Redondo-Morata, A. Colom, F. Humbert, M. Lenz, S. Scheuring, A. Roux, Cell 2015, 163, 866.
[42] T. Ando, N. Kodera, E. Takai, D. Maruyama, K. Saito, A. Toda, Proc. Natl. Acad. Sci.