HAL Id: insu-00670814
https://hal-insu.archives-ouvertes.fr/insu-00670814
Submitted on 29 Jun 2016
HAL is a multi-disciplinary open access
archive for the deposit and dissemination of
sci-entific research documents, whether they are
pub-lished or not. The documents may come from
teaching and research institutions in France or
abroad, or from public or private research centers.
L’archive ouverte pluridisciplinaire HAL, est
destinée au dépôt et à la diffusion de documents
scientifiques de niveau recherche, publiés ou non,
émanant des établissements d’enseignement et de
recherche français ou étrangers, des laboratoires
publics ou privés.
size of Greater India
Douwe J.J. van Hinsbergen, Paul Kapp, Guillaume Dupont-Nivet, Peter
Lippert, Peter Decelles, Trond H. Torsvik
To cite this version:
Douwe J.J. van Hinsbergen, Paul Kapp, Guillaume Dupont-Nivet, Peter Lippert, Peter Decelles, et
al.. Restoration of Cenozoic deformation in Asia and the size of Greater India. Tectonics, American
Geophysical Union (AGU), 2011, 30 (5), pp.TC5003. �10.1029/2011TC002908�. �insu-00670814�
Restoration of Cenozoic deformation in Asia and the size
of Greater India
Douwe J. J. van Hinsbergen,
1,2Paul Kapp,
3Guillaume Dupont
‐Nivet,
4,5,6Peter C. Lippert,
3,7Peter G. DeCelles,
3and Trond H. Torsvik
1,2,8,9Received 9 March 2011; revised 3 June 2011; accepted 11 July 2011; published 15 September 2011.
[1]
A long
‐standing problem in the geological evolution of the India‐Asia collision zone
is how and where convergence between India and Asia was accommodated since
collision. Proposed collision ages vary from 65 to 35 Ma, although most data sets are
consistent with collision being underway by 50 Ma. Plate reconstructions show that
since 50 Ma
∼2400–3200 km (west to east) of India‐Asia convergence occurred, much
more than the 450–900 km of documented Himalayan shortening. Current models
therefore suggest that most post
‐50 Ma convergence was accommodated north of the
Indus
‐Yarlung suture zone. We review kinematic data and construct an updated
restoration of Cenozoic Asian deformation to test this assumption. We show that
geologic studies have documented 600
–750 km of N‐S Cenozoic shortening across, and
north of, the Tibetan Plateau. The Pamir
‐Hindu Kush region accommodated ∼1050 km
of N
‐S convergence. Geological evidence from Tibet is inconsistent with models that
propose 750
–1250 km of eastward extrusion of Indochina. Approximately 250 km of
Indochinese extrusion from 30 to 20 Ma of Indochina suggested by SE Asia reconstructions
can be reconciled by dextral transpression in eastern Tibet. We use our reconstruction to
calculate the required size of Greater India as a function of collision age. Even with a 35 Ma
collision age, the size of Greater India is 2
–3 times larger than Himalayan shortening.
For a 50 Ma collision, the size of Greater India from west to east is
∼1350–2600 km,
consistent with robust paleomagnetic data from upper Cretaceous‐Paleocene Tethyan
Himalayan strata. These estimates for the size of Greater India far exceed documented
shortening in the Himalaya. We conclude that most of Greater India was consumed by
subduction or underthrusting, without leaving a geological record that has been
recognized at the surface.
Citation: van Hinsbergen, D. J. J., P. Kapp, G. Dupont‐Nivet, P. C. Lippert, P. G. DeCelles, and T. H. Torsvik (2011), Restoration of Cenozoic deformation in Asia and the size of Greater India, Tectonics, 30, TC5003, doi:10.1029/2011TC002908.
1.
Introduction
[2] Collision between continental lithosphere of the
Indian and Asian plates has led to the largest deformed continental region in the world in Cenozoic time. The India‐ Asia orogen includes the Himalaya, the Tibetan Plateau, the Pamir‐Hindu Kush, the Tien Shan, Mongolia, and southern Siberia (Figure 1). Effects of the collision range from development of the India‐derived Himalayan fold‐and‐thrust belt in the south [Gansser, 1964; Hodges, 2000], to strike‐ slip‐dominated mountain belts thousands of kilometers to the north in Mongolia and southern Siberia [Molnar and Tapponnier, 1975; Cunningham, 2005; Jolivet et al., 2010; Arzhannikova et al., 2011]. The Indochinese peninsula, to the east of the Himalaya, has been deformed along major strike‐ slip zones that accommodated southeastward translation of lithosphere, away from the collision zone [Tapponnier et al., 1986]. The amount of southeastward displacement of Indo-china is heavily debated in the literature and will be discussed in detail.
1
Physics of Geological Processes, University of Oslo, Oslo, Norway.
2Center for Advanced Study, Norwegian Academy of Science and
Letters, Oslo, Norway.
3
Department of Geosciences, University of Arizona, Tucson, Arizona, USA.
4
Géosciences Rennes, UMR‐CNRS 6118, Université de Rennes 1, Rennes, France.
5
Paleomagnetic Laboratory ‘Fort Hoofddijk’, Department of Earth Sciences, University of Utrecht, Utrecht, Netherlands.
6
Key Laboratory of Orogenic Belts and Crustal Evolution, Ministry of Education, Beijing, China.
7
Department of Earth and Planetary Sciences, University of California, Santa Cruz, California, USA.
8
Center for Geodynamics, Geological Survey of Norway, Trondheim, Norway.
9School of Geosciences, University of the Witwatersrand, Johannesburg,
South Africa.
Copyright 2011 by the American Geophysical Union. 0278‐7407/11/2011TC002908
[3] An accurate reconstruction of the kinematic history of
the collision zone is essential to assess the dynamics of the India‐Asia collision. Boundary conditions for this recon-struction are derived from plate circuits constrained by marine magnetic anomaly and fracture zone‐based recon-structions of the Indian and Atlantic oceans; these constrain the relative positions of the Indian and Asian plates through time. The first India‐Eurasia plate circuits [Molnar and
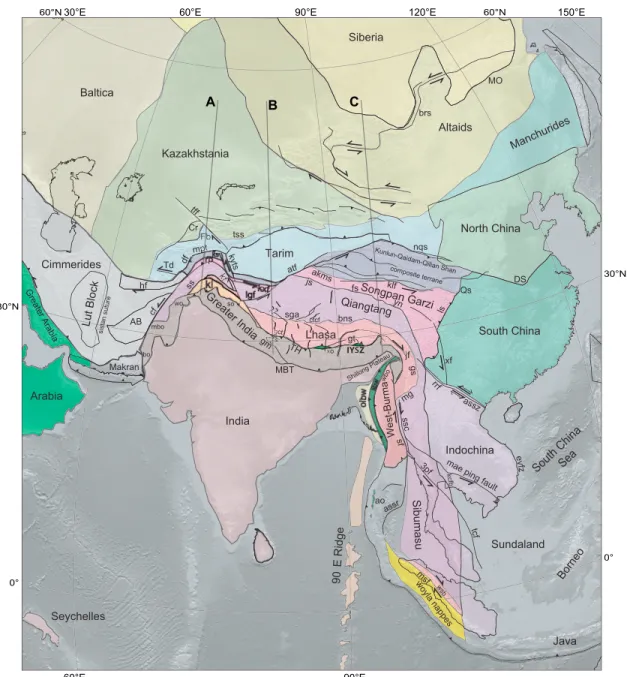
Tapponnier, 1975; Patriat and Achache, 1984] have changed by no more than a few hundreds of kilometers over the following decades, despite the publication of new time scales and more detailed marine geophysical data [Torsvik et al., 2008; Molnar and Stock, 2009; Cande et al., 2010; Copley et al., 2010; van Hinsbergen et al., 2011]. These plate circuit models predict ∼2400 and ∼3200 km of convergence between cratonic India and cratonic Asia Figure 1. Geographic map (3D Globe projection) of central and eastern Asia. Mountain ranges and
major basins. Ai, Andaman Islands; Ar, Alai range; Av, Alai valley; Bd, Bangladesh; Bh, Bhutan; Bf, Bengal fan; Cb, Cambodia; Cr, Chatkal range; eKS, eastern Kunlun Shan; GA, Gobi Altai; Gr, Ghissar range; KB, Khorat basin; LB, Lake Baykal; LS, Longmen Shan; Ml, Malaysia; NK, North Korea; P1, Peter the First range; QB, Qaidam Basin; QS, Qinling Shan; QSNS, Qilian Shan–Nan Shan; S‐Arab, Saudi Arabia; SB, Sichuan Basin; SK, South Korea; SS, Sunda Strait; Tar, Trans Alai range; TD, Tadjik Depression; Tj, Tadjikistan; TMP, Thai‐Malai peninsula; TR, Three Rivers region; tsh, Tianshuihe; Tw, Taiwan; UAE, United Arab Emirates; Vn, Vietnam; WA, Western Altai; wKS, western Kunlun Shan.
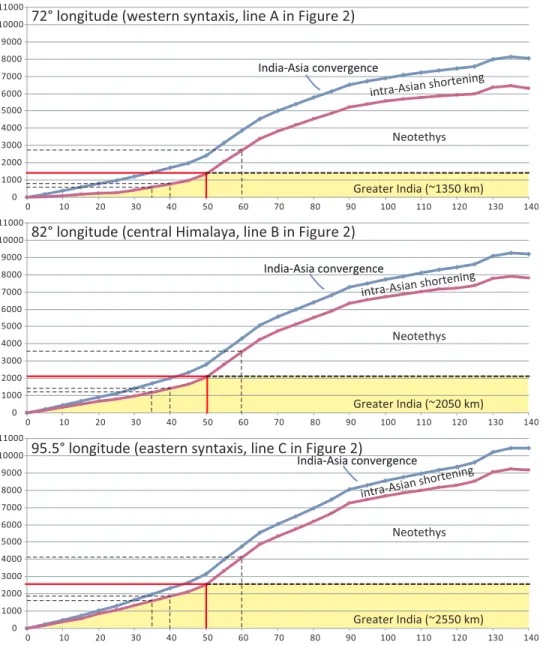
since 50 Ma at the longitudes of the western and eastern Himalayan syntaxes, respectively [van Hinsbergen et al., 2011]. Although these plate circuit estimates are robust, where this convergence was accommodated (south or north of the India‐Asia suture), and the type of deformation that accommodated this convergence (thrusting/subduction or strike‐slip faulting (extrusion)) remain disputed.
[4] In principle, if all convergence following the initial
India‐Asia collision was accommodated by crustal short-ening (together with delamination and subduction of sub‐ continental mantle lithosphere [Willett and Beaumont, 1994; Tapponnier et al., 2001; Capitanio et al., 2010]), then we merely need to sum shortening via thrust and strike‐slip faulting in Indian and Asian crust. In practice, however, both the age of the India‐Asia collision and the magnitude of shortening of Asian and Indian crust are disputed. The map‐view area of Asia that was removed by shortening and lateral extrusion after Tethyan Himalaya‐Asia collision is defined here as ‘Greater Asia’, whereas the map‐view area of Indian‐affinity lithosphere north of the Main Frontal Thrust just prior to the Tethyan Himalaya‐Asia collision is referred to as ‘Greater India.’ Estimates for the age of the collision between the Tethyan Himalaya and southern Tibet range from∼65 Ma [Ding et al., 2005; Cai et al., 2011] to as young as 34 Ma [Aitchison et al., 2007], with most authors preferring an age of 52–50 Ma [e.g., Zhu et al., 2005; Green et al., 2008; Dupont‐Nivet et al., 2010a; Najman et al., 2010; Wang et al., 2011].
[5] Regardless which of the proposed collision ages is
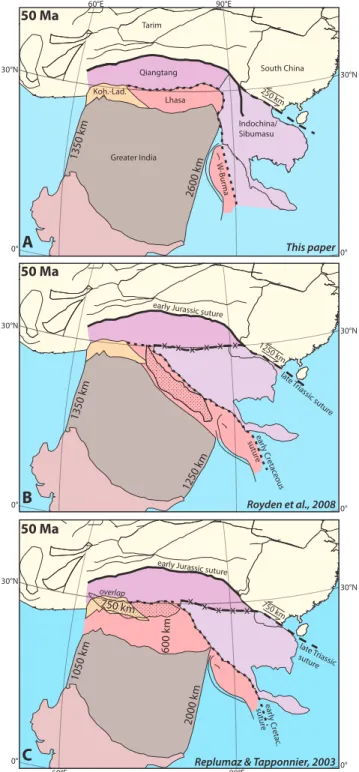
preferred, the amount of shortening in Indian‐affinity rocks in the Himalayan thrust belt (450–900 km [DeCelles et al., 2002; Long et al., 2011]) is much less than the amount of post‐collisional plate convergence. Because of this reason, and because restorations of early Mesozoic Gond-wana configurations suggest a size of Greater India smaller than ∼1000 km [Ali and Aitchison, 2005], most tectonic models of the India‐Asia collision zone partition as much as two‐thirds of India‐Asia convergence into Asian litho-sphere [e.g., Lee and Lawver, 1995; Tapponnier et al., 2001; Replumaz and Tapponnier, 2003; Royden et al., 2008]. However, geological records of the post‐50 Ma shortening distributed within Tibet yield much smaller estimates of only ∼600 km [Dewey et al., 1988; Yin and Harrison, 2000; Johnson, 2002; Guillot et al., 2003]. Until recently, we have lacked structural studies from the remote interior regions of the Tibetan Plateau to accu-rately test these predictions. In the last decade, however, many new kinematic constraints from Tibet, the Tien Shan, the Pamir and Mongolia have been published. Here, we provide an updated restoration of shortening and extrusion in Asia for the Cenozoic. To test the various scenarios for intra‐Asian deformation, we restore the deformation from Tajikistan to Vietnam and from Siberia to the Himalaya.
[6] Finally, we use the new reconstruction of intra‐Asian
shortening, which is independent from the age of collision, to evaluate the size of Greater India as a function of collision age. Our results show that even the youngest proposed collision age of 34 Ma yields a significant mismatch between shortening recorded in Himalaya and contempora-neous Indian‐plate subduction. We conclude with a
dis-cussion of the implications of this mismatch for the composition of Greater Indian lithosphere.
2.
Approach
[7] Classic plate reconstructions use rigid plates, and
localize deformation at plate boundaries [Cox and Hart, 1986]. Alternatively, Tibetan lithosphere may be modeled as a thin‐viscous sheet, in which lithosphere deforms homogeneously such that there are no horizontal strain gra-dients within a vertical column of lithosphere [England and Houseman, 1986; England and Molnar, 1997]. We use a combination of these approaches, subdividing the Himalaya‐ Tibetan orogen into rigid blocks, such as the Tarim basin, where no significant Cenozoic deformation is apparent, as well as deforming blocks, such as fold‐thrust belts and extending basins. Because the latter typically exhibit defor-mation that is partitioned across many small‐scale folds or faults, we chose to treat those areas as blocks that gradually deform between known boundaries, such as strike‐slip faults or boundaries of extensional basins or fold‐thrust belts.
[8] We use the freely available software package GPlates
to make our reconstruction (http://www.gplates.org) [Boyden et al., 2010]. The rotation and shape files of our recon-struction are given in the auxiliary material.1 GPlates sub-divides the surface into undeformable polygons (e.g., the Tarim basin, or the South China Block) and deformable topologies (e.g., the Tien Shan). For example, lines repre-senting the boundaries of a deforming region move with respect to each other during the time span of deformation, changing the area in between according to geological con-straints. GPlates interpolates plate or line motions with constant rates between known situations, leading to a con-tinuously deforming plate reconstruction.
[9] The reconstruction presented here uses the India‐Asia
plate circuit of van Hinsbergen et al. [2011], which is based on the most recent plate kinematic constraints [e.g., Gaina et al., 2002; Merkouriev and DeMets, 2006; Cande et al., 2010]. We reconstruct Asian deformation with respect to stable Siberia. To allow comparison of our reconstructions to paleomagnetic data or mantle reference frames, Data Sets S1–S4 (rotation files) in the auxiliary material are available in a Siberia‐fixed frame as shown in this paper, as well as in the paleomagnetic reference frame of Torsvik et al. [2008], the hybrid mantle reference frame of Torsvik et al. [2008] (which consists of the Indo‐Atlantic hot spot frame of O’Neill et al. [2005] back to 100 Ma and a true polar wander‐ corrected paleomagnetic reference frame of Steinberger and Torsvik [2008] before 100 Ma), and finally in the slab‐ fitted mantle reference frame of van der Meer et al. [2010].
3.
Review
[10] Reconstructions require a deformed pattern that is
restored into an undeformed configuration. Here, crustal fragments, and their intervening sutures that built the Asian crust prior to the Cretaceous define this pattern. Available kinematic constraints from the India‐Asia collision zone are summarized in Table 1 and Figures 2 and 3.
1
Auxiliary material data sets are available at ftp://ftp.agu.org/apend/tc/ 2011tc002908. Other auxiliary material files are in the HTML.
Table 1. Displacements Used in This Reconstructiona
Structure/Region Sense Amount Age Reference Lake Baykal E‐W extension 7 km 7–0 Ma San’kov et al. [2000]
Mongoliab N‐S shortening 50 km 23–0 Ma Cunningham [2005]
Tien Shanb N‐S shortening 20–200 km 23–0 Ma Avouac et al. [1993] and Yin et al. [1998] Chatkal range (north of Pamir) N‐S shortening 60 km Cenozoic Burtman et al. [1996]
Peter the First range (north of Pamir)
N‐S shortening 60 km Cenozoic Hamburger et al. [1992] Alai Valley (north of Pamir) N‐S shortening 20 km 25–0 Ma Coutand et al. [2002]
region north of Pamir NE‐SW shortening 260 km 23–0 Ma Bourgeois et al. [1997]; see text Tadjik Depression NE‐SW shortening 150 km 23–0 Ma Bourgeois et al. [1997] Tadjik Depression rotations counterclockwise 0–50° 23–0 Ma Thomas et al. [1994] Talas‐Ferghana fault rl strike‐slip 60 km Cenozoic Burtman et al. [1996]
Altyn Tagh faultb ll strike‐slip 400 km 30–0 Ma Cowgill et al. [2003] and Yue et al. [2004] Western Kunlun/Tianshuihaib N‐S shortening 140 km 30–0 Ma Cowgill et al. [2003]
Longmu‐Goza fault ll strike‐slip 30 km 10–0 Ma Raterman et al. [2007] Qilian Shan‐Nan Shan‐Qaidamb N‐S shortening 140 km 30–0 Ma see text
Kongur Shan E‐W extension 20 km 9–0 Ma Robinson et al. [2004, 2007]
Karakoram fault, scenario 1c rl strike‐slip 150 km 13–0 Ma Searle and Phillips [2007], Robinson [2009], and Bhutani et al. [2009]
Karakoram fault, scenario 2 rl strike‐slip 200–600 km 25–0 Ma Lacassin et al. [2004], Valli et al. [2007, 2008], and Rolland et al. [2009]; Leloup et al. [2011] Gurla Mandhata core complex E‐W extension 65 km 10–0 Ma Murphy et al. [2000]
Kashgar‐Yecheng transfer system rl strike‐slip 270 km 30–0 Ma Cowgill [2010]
western Himalaya rotation clockwise 20° post‐Eocene Klootwijk et al. [1985, 1986, 1994] and Schill et al. [2001]
Songpan Garzi beltb N‐S shortening 200 km 50–30 Ma Coward et al. [1988] and Spurlin et al. [2005] Qiangtang terrane N‐S shortening 120 km 50–20 Ma P. Kapp et al. [2005]
Qiangtang terrane N‐S shortening 400 km 140–100 Ma P. Kapp et al. [2005; 2007a] and DeCelles et al. [2007] Lhasa terrane N‐S shortening 40 km 50–20 Ma Kapp et al. [2007b]
Lhasa terrane N‐S shortening 250 km 100–50 Ma Murphy et al. [1997], Leier et al. [2007], and Volkmer et al. [2007]
Lhasa terrane, rotation Linzizong 0° 50–0 Ma Dupont‐Nivet et al. [2010a]
Eastern Qiangtang rotation clockwise 50° Cenozoic Otofuji et al. [1990] and Huang et al. [1992] Sichuan basin rotation 0° Cenozoic Huang and Opdyke [1992]
Gangdese thrust N‐S shortening 50 km 30–24 Ma Yin et al. [1999a] and Murphy and Yin [2003] Great Counter thrustd N‐S shortening 16 km 18–11 Ma Yin et al. [1999a] and Murphy et al. [2009]
Combined Gangdese and Great Counter thrusts
N‐S shortening 66 km 30–11 Ma
Kunlun fault ll strike‐slip 100 km 10 Ma Van der Woerd et al. [2000], Fu et al. [2005], and Kirby et al. [2007]
Longmenshan E‐W shortening 25 km 10 Ma Burchfiel et al. [2008] and Hubbard and Shaw [2009] Xianshuihe fault ll strike‐slip 70 km 13 Ma Allen et al. [1991], Roger et al. [1995],
and Wang and Burchfiel [2000]
Nyaingtentanghla detachment E‐W extension 25 km 10 Ma Harrison et al. [1995] and J. L. D. Kapp et al. [2005] South China Block E‐ward motion 80 km 10 Ma Replumaz and Tapponnier [2003]
E‐W extension across Tibetb E‐W extension 100 km 10 Ma He and Chery [2008]
Red River Faultb rl strike‐slip 40 km 8 Ma Replumaz et al. [2001] and Schoenbohm et al. [2006b] Red River Fault, scenario 1c ll strike‐slip 250 km 30–20 Ma Searle [2006], Hall et al. [2008], and Fyhn et al. [2009]
Red River Fault, scenario 2 ll strike‐slip 700 km 30–15 Ma Tapponnier et al. [1986] and Leloup et al. [1995] Andaman Seab N‐S extension 460 km 11–0 Ma Curray et al. [1979, 1982] and Diament et al. [1992]
Sagaing fault rl strike‐slip 530 km 11–0 Ma Curray et al. [1979, 1982] and Khan and Chakraborty [2005]
Shan Scarp rl strike‐slip unknown 40/30 Ma–11 Ma Bertrand et al. [2001], Bertrand and Rangin [2003], and Searle et al. [2007]
Mentawai and Sumatra fault rl strike‐slip 70 km ?Pliocene Diament et al. [1992] and Schlüter et al. [2002] Sunda Strait E‐W extension 70 km 5–0 Ma Diament et al. [1992] and Schlüter et al. [2002] Rotation Indochina clockwise 10–20° Cenozoic Huang and Opdyke [1993], Charusiri et al. [2006],
and Aihara et al. [2007], Takemoto et al. [2009] Indo‐Burman wedge E‐W shortening 11 km 2 Ma Maurin and Rangin [2009]
Mae Ping fault ll strike‐slip 100–160 km 40–23 Ma Tapponnier et al. [1986] and Fyhn et al. [2010a, 2010b] Three Pagodas–Tho Chu fault ll strike‐slip 100–160 km 40–23 Ma Tapponnier et al. [1986] and Fyhn et al. [2010a] Three Pagodas–Tho Chu fault rl strike‐slip minimal 23–0 Ma Morley [2007] and Fyhn et al. [2010a, 2010b]
a
The scenario number refers to the location of this estimate, as indicated in Figure 3; rl (ll) strike‐slip, right‐ (left‐) lateral strike‐slip.
bSee text for more details and references for this estimate. c
Preferred scenario; see text for discussion.
dA larger amount of shortening along the Great Counter thrust was used in our reconstruction to balance displacement along the Karakoram Fault;
Figure 2. Simplified tectonic map of Asia, showing the main faults and boundaries of deforming regions discussed in this paper. Terranes and sutures of central and East Asia are modified after Yin and Harrison [2000], Cocks and Torsvik [2007], Pubellier [2008] and Torsvik and Cocks [2009] in a 3D Globe pro-jection. Abbreviations are 3pf, Three Pagodas fault; AB, Afghan block; ao, Andaman ophiolite; akms, Ayimaqin–Kunlun–Mutztag suture; assr, Andaman Sea spreading ridge; assz, Ailao Shan shear zone; atf, Altyn Tagh fault; bns, Bangong‐Nujiang suture; bo, Bela ophiolite; brs, Baykal rift system; cf, Chaman fault; Cr, Chatkal range; ctcf, Central Tibetan Conjugate fault system; df, Darvaz fault; DS, Dabie Shan; evfz, East Vietnam fault zone; Fb, Ferghana basin; gm, Gurla Mandhata metamorphic complex; fs, Fenguo Shan fold‐and‐thrust belt; gct, Great Counter Thrust; gs, Gaoligong shear zone; gt, Gangdese thrust; hf, Helmand fault; iibw, inner Indo‐Burman wedge; IYSZ, Indus‐Yarlung Suture Zone; jf, Jiali fault; js, Jinsha suture; kcfb, Khmer‐Chanthaburi fault belt; kf, Karakoram fault; kl, Kohistan‐Ladakh arc; klf, Kunlun fault; ks, Kongur Shan; kxf, Karakax fault; kyts, Kashgar‐Yecheng transfer system; lgf, Longmu‐Goza fault; ls, Longmen Shan; mbo, Muslim Bagh ophiolite; nqs, North Qilian suture; MBT, Main Boundary Thrust; mg, Mogok metamorphic belt; MO, Mongol‐Okhotsk suture; mpt, Main Pamir thrust; msf, Mentawai and Sumatra faults; oibw, outer Indo‐Burmese wedge; Qs, Qinling Shan; rp, Rushan Pshart; rrf, Red River fault; sf, Sagaing fault; sga, Shiquanhe‐Gaize‐Amdo thrust system; so, Spontang ophiolite; ss, Shyok suture; ssc, Shan Scarp; tcf, Tho Chu fault; Td, Tadjik Depression; tff, Talas‐Ferghana fault; TH, Tethyan Himalaya; tss, Tien Shan suture; wbo, west Burma ophiolite; wo, Waziristan ophiolite; wsb, West Sumatra block; xf, Xianshuihe fault; xo, Xigaze ophiolite; yn, Yushu‐Nangqian fold‐and‐thrust belt.
3.1. Continental Fragments of Asia
[11] We study the region of Asia that underwent intense
Cenozoic deformation. This area is surrounded by and (partly) includes the Kazakhstan block to the northwest, the Altaid collage and the Siberian craton to the north, the Manchuride collage and the North and South China blocks to the east, and cratonic India south of the Main Frontal Thrust to the south [Şengör et al., 1993; Şengör and Natal’in, 1996; Cocks and Torsvik, 2007; Pubellier, 2008; Torsvik and Cocks, 2009] (Figure 2).
[12] The youngest collisions in central and east Asia are
the Triassic collision between the North and South China blocks, forming the Dabie Shan and the Qinling ranges [Zhao and Coe, 1987; Ratschbacher et al., 2003; Hacker et al., 2006], the late Triassic collisions between Sibumasu and Indochina, and Indochina and South China [Metcalfe, 1996; Zhou et al., 2008; Ferrari et al., 2008; Barber and Crow, 2009; Cai and Zhang, 2009; Roger et al., 2010] and
the latest Jurassic closure of the Mongol‐Okhotsk Ocean and collision of the Mongolian Altaids (also called Amuria) with Siberia [Enkin et al., 1992; Van der Voo et al., 1999b; Cogné et al., 2005; Metelkin et al., 2010]. Early Cretaceous (∼125 Ma) paleomagnetic poles from Mongolia coincide with Eurasian reference poles [Hankard et al., 2007; van Hinsbergen et al., 2008]. These collision zones have been tectonically reactivated due to Cretaceous far‐field tectonic stresses or internal body forces [Graham et al., 2001; Meng et al., 2003; Ratschbacher et al., 2003], but they can be considered as stable Eurasian continent, while major tectonic activity was dominated by collisions along the Eurasian margins. Below we review the crustal structure and available kinematic constraints for each area.
3.2. Mongolia
[13] Mongolia and southern Siberia contain strike‐slip
dominated regions including the Western Altai and the Gobi Figure 3. Summary of the kinematic constraints used as input in this reconstruction. Numbers in
Altai, and the E‐W extensional Lake Baykal basin, which can be viewed as an extensional step‐over in a left‐lateral strike‐slip system (Figure 2). Total strike‐slip displacements here are within tens of kilometers. The Lake Baykal rift system, which may have a pre‐Cenozoic history unrelated to the India‐Asia collision [Jolivet et al., 2009], accommodated ∼7 km of extension since 11–7 Ma [San’kov et al., 2000; ten Brink and Taylor, 2002]. The Western Altai accommodated ∼20–30 km of right lateral displacement since the Oligocene [Howard et al., 2003; Cunningham, 2005]. The Gobi Altai accommodated at least 15 km of sinistral strike‐slip along the northern Bogd fault system since 5 ± 3 Ma [Vassallo et al., 2007; Cunningham, 2010]. Because many of the mountain ranges have not been studied in detail (W. D. Cunningham, personal communication, 2010), we assume a total intra‐ Mongolian shortening of 50 km, twice as much as docu-mented by Cunningham [2005], and assume a constant shortening rate since the onset of deformation around 23 Ma [Howard et al., 2003]. Pre‐Oligocene deformation of Mon-golia and northwestern China dates back to the Mesozoic [Graham et al., 2001; Davis et al., 2002; Meng et al., 2003; Yuan et al., 2006; Darby and Ritts, 2007; Vassallo et al., 2007; Jolivet et al., 2007], and does not fall within the scope of our restoration.
3.3. Tien Shan
[14] The Tien Shan is developed on the upper Paleozoic
to lower Mesozoic suture between the Tarim block and Kazakhstan [Allen et al., 1993; Şengör et al., 1993] (Figures 1 and 2). The Tarim basin has behaved as a stable sedimentary basin, with deformation localized along its margins [Graham et al., 1993; Yang and Liu, 2002]. The Tien Shan is bounded in the north and south by Neogene to Recent thrust faults [Avouac et al., 1993; Molnar, 1994; Yin et al., 1998; Burbank et al., 1999]. The range becomes narrower to the east, where it structurally connects to the Gobi Altai sinistral transpressional system [Cunningham et al., 1996] and accommodated 20–40 km of Cenozoic shortening [Yin et al., 1998]. Avouac et al. [1993] assumed that the Tien Shan is in isostatic equilibrium (but see Kosarev et al. [1993]) and estimated that Cenozoic N‐S shortening increased from near‐ zero in the east to∼200 km in the west. This lateral variation in shortening predicts a vertical axis rotation of the Tarim block with respect to Kazakhstan of∼7° around a pole at the eastern end of the Tien Shan [Avouac et al., 1993]. Low‐ temperature thermochronology demonstrates a phase of rock uplift around 65–60 Ma in the Tien Shan [Jolivet et al., 2010]. This age predates most estimates for the India‐Asia collision and kinematic data associated with this phase remain undocumented, so this deformation is not specifi-cally included in our reconstruction. Sedimentological, stratigraphic and low‐temperature thermochronological data indicate a significant increase of exhumation in the southern Tien Shan at∼23 Ma [Hendrix et al., 1994; Yin et al., 1998; Yang and Liu, 2002; Sobel et al., 2006; Heermance et al., 2007; Jolivet et al., 2010]. Rock (and probably surface) uplift in the northern and eastern Tien Shan may have fol-lowed later, may have occurred in pulses, and the shortening rate may have increased through time [Bullen et al., 2003; Charreau et al., 2009; Sun and Zhang, 2009; Li et al., 2011]. Rock uplift and shortening rates are not necessarily propor-tionally linked, however, and no kinematic data are available
to quantify shortening rate changes in the Tien Shan in the Miocene. For simplicity, we assume that shortening of the Tien Shan since 23 Ma has been continuous between the modern range‐front thrusts.
[15] The gradual westward increase in Tien Shan elevation
stops abruptly at the trans‐crustal, dextral Talas‐Ferghana strike‐slip fault [Burtman, 1975; Trifonov et al., 1992; Burtman et al., 1996; Li and Chen, 2006; Korjenkov et al., 2010], which continues northward to faults that have not been active in the Cenozoic [Allen et al., 2001; Alexeiev et al., 2009]. The Talas‐Ferghana fault has a post‐late Cretaceous, dextral displacement of 60 km [Burtman et al., 1996]. West of the Talas‐Ferghana fault, the Chatkal range in the north and the Alai range (or Southern Tien Shan) in the south are sep-arated by the intervening Ferghana Basin, which is over-thrusted by both ranges (Figure 1) [Cobbold et al., 1993; Burtman et al., 1996]. The Alai valley separates the Alai Range in the north from the Trans‐Alai Range and the Main Pamir Thrust further to the south. The Main Pamir Thrust forms the boundary with the Pamir fold‐and‐thrust belt [Skobolev, 1977; Leith and Alvarez, 1985; Bourgeois et al., 1997; Burtman, 2000; Coutand et al., 2002] (Figures 1 and 2). Neogene thin‐skinned folding and thrusting deformed sediments in the Tadjik Depression west of the Pamir salient (Figure 2). We adopted the map‐view restora-tion of the Tadjik depression of Bourgeois et al. [1997] in our reconstruction. This restoration used structural geological data in combination with paleomagnetic constraints that demonstrate counterclockwise rotations that increase from 0° in the western part of the Tadjik Depression to∼50° in the eastern part near the Darvaz fault at the boundary with the Pamir salient [Bazhenov et al., 1994; Thomas et al., 1994]. Bourgeois et al. [1997] showed that∼150 km of WNW‐ESE shortening in the Tadjik depression can be reconciled with the vertical axis rotation pattern assuming 240 km of NNW‐ward indentation of the Pamir salient. Approximately 60 km of this shortening was accommodated in the Peter the First range (Figure 1), a south‐verging fold‐and‐thrust belt to the northwest of the Pamir [Hamburger et al., 1992]. Thomas et al. [1993] used paleomagnetic results from Eocene to lower Miocene sediments to demonstrate a 20 ± 11° coun-terclockwise rotation of the Ferghana Basin, and inferred 110 ± 60 km of shortening in the Chatkal range. Sediments in the Alai Valley have been shortened by∼20 km in the Neo-gene [Coutand et al., 2002]. We assume that the remaining 50 ± 60 km of shortening of the 240 km inferred by Bourgeois et al. [1997] is partitioned in the Alai Range. 3.4. Tibet and the Pamir‐Hindu Kush
3.4.1. Terranes and Subdivisions
[16] Most intra‐Asian Cenozoic deformation was
accom-modated south of the Tarim block in the Tibetan Plateau to the southeast, and the Pamir‐Hindu Kush region to the west and southwest (Figure 1). The Tarim block is separated from the Tibetan Plateau by the sinistral Altyn Tagh strike‐slip fault and the western Kunlun Shan fold‐thrust belt [e.g., Molnar and Tapponnier, 1975] (Figure 2). The western Tarim basin is separated from terranes of the Pamir region by the Kashgar‐Yecheng dextral strike‐slip system [Cowgill, 2010]. The dextral Karakoram strike‐slip fault separates Tibet and the Tarim basin in the east, from the Pamir‐Hindu Kush region in the west [Molnar and Tapponnier, 1975].
[17] The Tibetan Plateau and Pamir‐Hindu Kush regions
exhibit a series of suture zones and intervening crustal fragments that collided in Paleozoic to Mesozoic time [Şengör, 1987; Dewey et al., 1988; Hsü et al., 1995; Yin and Harrison, 2000; Roger et al., 2010]. To the northeast of the Tibetan Plateau, the Qilian Shan–Nan Shan ranges, the Qaidam Basin and the eastern Kunlun Shan contain several Paleozoic sutures. We refer the reader to Gehrels et al. [2003] for details. Here, we only show the northernmost, North Qilian suture, and the southernmost, Ayimaqin‐ Kunlun‐Mutztagh suture [Yin and Harrison, 2000] and treat this region as a composite Kunlun‐Qaidam‐Qilian Shan terrane. The latter suture forms the northern boundary of the Songpan‐Ganzi terrane (Figure 2)). The Songpan‐Ganzi terrane is comprised largely of Triassic turbidites that were deposited in Paleo‐Tethyan oceanic basins [Yin and Nie, 1993; Zhou and Graham, 1996; Roger et al., 2010], and is separated from the Qiangtang terrane by the upper Tri-assic–lower Jurassic Jinsha suture [Yin and Harrison, 2000; Pullen et al., 2008]. The Qiangtang terrane is juxtaposed with the Lhasa block to the south along the uppermost Jurassic‐lower Cretaceous Bangong‐Nujiang suture [Dewey et al., 1988; Yin and Harrison, 2000; J. L. D. Kapp et al., 2005; L.‐L. Wang et al., 2008; Zhang, 2010]. The Eocene Indus‐Yarlung suture zone (IYSZ) in the south separates the Lhasa terrane from the Himalaya.
[18] The Pamir‐Hindu Kush region west of the Tibetan
Plateau has been subdivided into continental fragments equivalent to the Tibetan terranes, in addition to the Kohistan intraoceanic‐arc and Kohistan‐Ladakh batholith [Schwab et al., 2004; Cowgill, 2010]. The Kohistan arc is boun-ded in the north by the∼70 Ma old Shyok suture [Burtman and Molnar, 1993; Searle et al., 1997; Schwab et al., 2004]. In our reconstruction, we follow Searle and Treloar [2010] and restore late Cretaceous ophiolite emplacement over Greater India (and Arabia [Gnos et al., 1997]), followed by collision of Greater India with the Kohistan arc in the Eocene.
[19] We do not reconstruct the western margin of the
collision zone in Afghanistan and Pakistan because there is a general absence of kinematic data. We note, however, that there is evidence for Cenozoic extrusion of the Afghan Block westward along the conjugate Helmand and Chaman strike‐slip faults [Tapponnier et al., 1981], and E‐W closure of the Sistan ocean between the Afghan Block and the Lut Block in eastern Iran, which perhaps continued until Oligocene‐Miocene times [Rezaei‐Kahkhaei et al., 2010] (Figure 2). Given the kinematics of the known major faults and the E‐W compression in eastern Iran, restoring this region would probably indicate some westward lateral escape of the Afghan Block. The amount of westward motion, the timing, and the relationship between the Afghan Block and the blocks in Iran, however, remain subject for future work.
3.4.2. The Altyn Tagh Fault and Its Terminations [20] The 1600 km long, lithosphere‐scale [Wittlinger
et al., 1998] sinistral Altyn Tagh fault (ATF) bounds the Tibetan Plateau in the north [Molnar and Tapponnier, 1975] (Figure 2). Displacement along the ATF is transferred into transpressional fold‐and‐thrust belts of the Western Kunlun Shan–Tianshuihe region in the west, and the Eastern Kunlun Shan–Qaidam–Qilian Shan–Nan Shan region in the east [Cowgill et al., 2003]. The central segment of the ATF is
predominantly strike‐slip [Cowgill et al., 2003; Dupont‐ Nivet et al., 2004b]. Piercing point studies suggest dis-placements along the ATF ranging from 300 to 500 km [Ritts and Biffi, 2000; Cowgill et al., 2003; Gehrels et al., 2003; Yue et al., 2004, 2005; Ding et al., 2004].
[21] To the west, the ATF connects to the transpressional
system of the western Kunlun Shan. The western Kunlun Shan overthrusts the Tarim basin to the north, is bounded in the west by the Kashgar‐Yecheng transfer system, and is bounded in the south by the sinistral Karakax strike‐slip fault. The Karakax fault coincides spatially with the Ayi-maqin‐Kunlun‐Mutztagh suture [Matte et al., 1996; Mattern et al., 1996; Yang and Liu, 2002; Cowgill, 2010]. A balanced cross‐section in the central‐eastern part of the Western Kunlun Shan shows ∼100 km of Cenozoic upper crustal shortening [Cowgill, 2001], consistent with >80 km of shortening estimated from isostatic equilibrium calculations [Lyon‐Caen and Molnar, 1984]. South of the Karakax fault, the Tianshuihai range underwent post‐late Cretaceous shortening along south‐dipping thrusts [Yin and Harrison, 2000; Cowgill et al., 2003; Cao et al., 2009]. Cowgill et al. [2003] proposed that shortening in the Western Kunlun Shan decreases eastward, whereas in the Tianshuihai range, shortening increased eastward. Four hundred km of dis-placement along the N70°E striking ATF corresponds to ∼150 km of N‐S shortening, and ∼350 km of eastward motion. The ∼150 km of N‐S shortening may have been partitioned in the Western Kunlun Shan and Tianshuihai range, but it should be considered a maximum because it assumes rigid block translation of Tibet along the ATF. The amount of ATF displacement may increase eastward, accommodated by late Miocene and younger E‐W extension and strike‐slip faulting within Tibet (see section 4.3). The Karakax Fault does not crosscut and displace the Karakoram fault. Its displacement must hence be accommodated east of the Karakoram fault by E‐W compression to its north, or E‐W extension to its south, and its displacement after the initiation of the Karakoram fault was probably within tens of kilo-meters. Prior to Karakoram fault activity, the Karakax fault may have continued along the Ayimaqin‐Kunlun‐Mutztagh suture in the northern Pamir, although this remains untested by field studies. Splaying off of the southwestern termina-tion of the ATF is the NE‐SW striking Longmu‐Goza sinistral strike‐slip system south of the Tianshuihai range. Post‐10 Ma displacement of 25–32 km along the Longmu‐ Goza fault led to the formation of a restraining bend along the Karakoram Fault [Raterman et al., 2007].
[22] To the northeast, ATF displacement is
accommo-dated in the Eastern Kunlun Shan‐Qaidam‐Qilian Shan‐Nan Shan region. The Eastern Kunlun Shan transpressional system is separated from the Qilian Shan–Nan Shan fold‐ and‐thrust belt to the north by the Qaidam Basin (Figures 1 and 2). These thrust systems absorbed at least some of the motion along the ATF in the northeast. Shortening estimates in this region vary. Yin et al. [2008a] suggested that short-ening along the northern margin of the Qaidam Basin varies along‐strike between 20 and 60%, and Yin et al. [2007] suggested that Cenozoic upper crustal shortening within the Qaidam basin decreases eastward from >48%, (∼150 km), to <1%. Zhou et al. [2006], on the other hand, suggested only ∼10% shortening for the Qaidam Basin. The Qilian Shan–Nan Shan belt is a thick‐skinned fold‐and‐thrust belt
with an estimated 150 km of NE‐SW shortening since the Miocene [Tapponnier et al., 1990; Meyer et al., 1998]. The main trend of the fold‐and‐thrust belts in this region is ∼N70°W, along which a total of ∼260 km of shortening would accommodate all ATF displacement. Several authors have suggested that as much as 320 km of displacement of the ATF penetrated farther into the North China block prior to middle Miocene time [Yue and Liou, 1999; Yue et al., 2004; Darby et al., 2005]. Because the exact location and distri-bution of shortening in the eastern Kunlun–Qaidam–Qilian Shan–Nan Shan region remains enigmatic, we assume for simplicity that all motion along the ATF was accommodated south of the northern Qilian Shan front, and apply bulk shortening, evenly distributed over the area from the Eastern Kunlun Shan to the Qilian Shan.
[23] Yue et al. [2001, 2005] suggested that 360 ± 40 km of
ATF displacement occurred after 23 Ma. Cenozoic denu-dation of the Western [Sobel and Dumitru, 1997] and Eastern Kunlun Shan [Mock et al., 1999; Jolivet et al., 2001; Yin et al., 2008b; Clark et al., 2010] began since∼30 Ma, coinciding with increased subsidence in the Tarim Basin [Graham et al., 1993; Yang and Liu, 2002] and the age of gouge developed along major thrusts within the range [Duvall et al., 2011]. Correlating uplift and erosion in NE Tibet to activity of the ATF, Jolivet et al. [2001] associated rock uplift and erosion in NE Tibet to slip along the ATF to argue ATF activity may have began as early as 40 ± 10 Ma, and Yin et al. [2008b] argued that ATF‐related deformation around the Qaidam basin may even have started 65 Ma ago. However, early Cenozoic deformation in the eastern part of NE Tibet was associated with clockwise rotations and Dupont‐Nivet et al. [2002] argued that Eocene vertical axis rotations in this region were caused by right‐lateral trans-pression between Qaidam and the South China block. We assume that 400 km of displacement along the ATF, and the accommodating transpression in the northeastern and south-western terminations, occurred at a constant rate since 30 Ma. 3.4.3. Karakoram Fault and Kashgar‐Yecheng Transfer System
[24] The Karakoram fault and the Kashgar‐Yecheng
transfer system (KYTS) to the west of the Tarim basin are separated by the Kunlun terrane, which there trends NNW‐ SSE in the eastern Pamir [Cowgill, 2010]. The Karakoram fault and KYTS form a transform system that accommodates northwestward motion of the Pamir‐Hindu Kush region with respect to both Tibet and the Tarim basin. The KYTS trans-ferred convergence along the North Pamir Thrust to short-ening in the Western Kunlun Shan [Cowgill, 2010]. The Karakoram fault has transferred shortening in the Rushan‐ Pshart fold‐and‐thrust belt to shortening in the Himalaya and along the IYSZ [e.g., Strecker et al., 1995; Murphy et al., 2000; Robinson, 2009]. Between the Rushan‐Pshart fold‐ and‐thrust belt and the Main Pamir Thrust the N‐S trending Kongur Shan extensional detachment system has accommo-dated up to 34 km of E‐W extension since ∼7–8 Ma, and the Karakoram Fault does not connect with the Main Pamir Thrust [Robinson et al., 2004, 2007].
[25] The KYTS was noted by Burtman and Molnar [1993]
and Sobel and Dumitru [1997] and described in detail by Cowgill [2010] as a ∼50 km wide transpressional zone of anastomosing strike‐slip faults with a total dextral dis-placement of∼270–280 km. Age constraints for the onset of
activity of the Kashgar‐Yecheng system are inferred to coincide with the 37–23 Ma onset of shortening in the Western Kunlun Shan [Sobel and Dumitru, 1997; Cowgill et al., 2003]. We assume a 30 Ma onset age for the KYTS. Assuming a 37 or 23 Ma onset of deformation would decrease or increase the rate of shortening in the northern Pamir by 1–2 cm/yr, respectively.
[26] The age of, and displacement along the Karakoram
Fault are strongly debated. One school of thought argues for a maximum displacement of the fault of 150 km [Searle, 1996; Phillips et al., 2004; Schwab et al., 2004; Searle and Phillips, 2007; Robinson, 2009], with slip initiating as recently as 14–12 Ma [Bhutani et al., 2009; Streule et al., 2009; Wang et al., 2009]. Murphy et al. [2000] concluded that the Karakoram Fault propagated southward around 10 Ma, crosscutting the IYSZ and linking with the Gurla‐ Mandhata metamorphic complex (Figure 2). About 65 km of displacement accumulated after this linkage. In this scenario, the Karakoram fault has transferred shortening in the Rushan‐Pshart to the Main Boundary Thrust of the southern Himalaya since the late Miocene [Murphy and Copeland, 2005].
[27] A second school of thought argues that slip on the
Karakorum Fault initiated at or before 25 Ma, with much higher total displacements, mainly based on alternative correlations of terranes and sutures from Tibet to the Pamir‐ Hindu Kush (see overview by Cowgill [2010]). Slip esti-mates provided by this school have systematically decreased from initially as high as 1000 km [Peltzer and Tapponnier, 1988], to 600 km [Lacassin et al., 2004], >280 to 400 km [Valli et al., 2007, 2008],∼300 km [Rolland et al., 2009], and most recently to∼200 km [Leloup et al., 2011]. Besides the timing of fault initiation, another difference is the inter-pretation that the Karakoram fault does not link with the Gurla‐Mandhata core complex [Lacassin et al., 2004]. Instead, it was suggested to transfer slip to dextral strike‐slip faults along the Bangong‐Nujiang suture zone (i.e., Karakorum‐ Jiali fault zone [Armijo et al., 1989]) and IYSZ [e.g., Replumaz and Tapponnier, 2003]. We discuss the geometric and kine-matic consequences of both views later.
3.4.4. Pamir‐Hindu Kush
[28] The Pamir‐Hindu Kush region, from the Pakistan
Himalaya in the south to the Main Pamir Thrust in the north, is a northward convex orogenic belt. A Benioff zone is imaged beneath the Main Pamir Thrust to ∼250 km depth [Hamburger et al., 1992; Burtman and Molnar, 1993; Pavlis and Das, 2000], consistent with seismic tomographic images showing >300 km of nearly vertical subducted lithosphere [Nikolaev et al., 1985; Van der Voo et al., 1999a; Negredo et al., 2007; Zhao et al., 2010]. Cowgill [2010] interpreted the northern part of the Pamir salient as a half‐orocline, with only the western part of the region having undergone counterclockwise vertical‐axis rotations and thrusting [Thomas et al., 1994]; the eastern part was bounded by the KYTS.
[29] Paleomagnetic data from the western Himalayas and
the Hindu Kush support northward convex oroclinal bend-ing, with locally varying counterclockwise rotations of up to 100° in the western limb, and up to 20° clockwise rotation in the eastern limb since the Eocene [Klootwijk et al., 1985, 1986, 1994; Zaman and Torii, 1999; Schill et al., 2001]. We reconstruct a northward decrease of clockwise rotation of
the eastern limb of the Pamir‐Hindu Kush orocline, with full accommodation by rotation in the south, and full accom-modation by strike‐slip motion in the north.
[30] Shortening estimates in the Pamir‐Hindu Kush region
between the Main Pamir Thrust and the IYSZ are scarce. Burtman and Molnar [1993] provided a crude estimate of 300 km of Cenozoic shortening. Contractional deformation, metamorphism, and magmatism started in the Central and Southern Pamir zones in late Cretaceous‐Paleocene time [Searle et al., 2010]. We reconstruct the Pamir‐Hindu Kush based on kinematic constraints from the bounding faults, the Tadjik Depression, paleomagnetic constraints, and the notion that the total amount of Cenozoic shortening in the Pamir must exceed the shortening in Tibet to form the northward convex orocline.
3.4.5. N‐S Shortening in Tibet
[31] The Lhasa, Qiangtang and Songpan‐Ganzi terranes of
the Tibetan Plateau were significantly shortened through folding and thrusting during the Cretaceous and Paleogene. The bulk of shortening of the Qiangtang and Lhasa terranes predates ∼50 Ma: the Qiangtang terrane underwent ∼50% shortening (∼300 km) between 140 and 100 Ma during the Lhasa‐Qiangtang collision [P. Kapp et al., 2005, 2007a; DeCelles et al., 2007]. Subsequently, the Lhasa terrane underwent ∼50% (∼250 km) shortening between 100 and 50 Ma [Murphy et al., 1997; Ding and Lai, 2003; Kapp et al., 2003, 2007a, 2007b; Guynn et al., 2006; Volkmer et al., 2007]. These largely Cretaceous thrust systems straddle the Bangong‐Nujiang suture, and have not been displaced more than∼15 km by younger strike‐slip faults along the Central Tibet Conjugate Fault Zone (CTCFZ, Figure 2) [Taylor et al., 2003; P. Kapp et al., 2005; Ratschbacher et al., 2011]. The Bangong‐Nujiang suture plays a fundamental role in the model of major extrusion of Indochina away from central Tibet [Replumaz and Tapponnier, 2003; Royden et al., 2008]. The extrusion model follows the suggestion of, e.g., Armijo et al. [1989] that >700 km of sinistral displacement accu-mulated between the Qiangtang and Lhasa terranes during the Oligocene and early Miocene. Field evidence from the Bangong‐Nujiang suture in western and central Tibet, however, shows a laterally continuous E‐W belt of Creta-ceous thrust faults and associated basins that underwent only minimal reactivation by thrusting at 30–20 Ma [P. Kapp et al., 2003, 2005]. Thus, field observations from the plateau interior preclude the major strike‐slip faulting that is pos-tulated in the extrusion scenario.
[32] Percentages of Paleogene shortening in Tibet decrease
from north to south, and we subdivide the Tibetan Plateau into three belts accordingly. The northern belt includes the Paleogene Fenghuo Shan–Nanqian fold‐thrust belt, which is bounded in the north by the Anyimaquen‐Kunlun suture and includes the Jinsha suture zone [Coward et al., 1988]. The Fenghuo Shan fold‐and‐thrust belt underwent at least 80 km of Paleogene shortening (43%) [Coward et al., 1988; Zhang and Zheng, 1994] and is unconformably overlain by only gently folded Miocene sediments [Leeder et al., 1988; Smith and Xu, 1988; Liu et al., 2001; C. Wang et al., 2008; Wu et al., 2008]. Apatite fission track analyses show rapid 30–22 Ma cooling in the Fenghuo Shan [C. Wang et al., 2008] and the Fenghuo Shan is intruded by 31 ± 1 Ma undeformed syenite [Harris et al., 1988]. Spurlin et al. [2005] documented >110 km (>43%) of shortening in
the Yushu‐Nangqian region along strike to the east of the Fenghuo Shan, mainly between∼50 Ma and 37 Ma [Horton et al., 2002]. The Tanggula Shan underwent major N‐S shortening recorded by folded lower Paleogene sediments that are unconformably overlain by only weakly deformed Oligocene sediments and lavas [Wang et al., 2002; C. Wang et al., 2008; Lippert et al., 2011]. We assume that the con-sistent intense Paleogene shortening documented from the Yushu‐Nangqian and Fenguo Shan regions is representa-tive for the entire Songpan‐Ganzi belt, and apply ∼50%, or ∼200 km N‐S shortening between 50 and 30 Ma.
[33] Estimates of Cenozoic shortening by thrusting in the
southern Qiangtang terrane (between 50 and 30 Ma) and along the Bangong‐Nujiang suture zone (between 30 and 20 Ma) are∼25% (∼120 km) in total [P. Kapp et al., 2003, 2005, 2007a; Lippert et al., 2011]. Shortening of the Lhasa terrane after deposition of the widespread 69–47 Ma Lin-zizong volcanics [He et al., 2007; Lee et al., 2009] was minimal, was localized along relatively small thrusts and did not exceed∼15% (∼40 km) between 50 Ma and 20 Ma [He et al., 2007; Kapp et al., 2007b].
[34] Contractional deformation shortened the
Indus‐Yar-lung suture zone in Cenozoic time. The top‐to‐the‐south Gangdese thrust [Harrison et al., 1992; Yin et al., 1994, 1999a] placed Gangdese arc and forearc rocks over suture‐ zone and Tethyan Himalayan rocks to the south between 30 and 24 Ma and accommodated a minimum of∼40–50 km shortening [Yin et al., 1994, 1999a; Murphy and Yin, 2003]. In middle Miocene time, the IYSZ was further shortened along the top‐to‐the‐north Great Counter thrust system, backthrusting suture zone and Tethyan Himalayan rocks over the Gangdese arc and forearc by at least 16 km [Yin et al., 1999a; Murphy et al., 2009].
[35] Some paleomagnetic data from the Lhasa and
Qiangtang terrane are available [Chen et al., 1993; Cogné et al., 1999; Liu et al., 2003; Dupont‐Nivet et al., 2010a Liebke et al., 2010; Lippert, 2010; Lippert et al., 2011]. Given the spatial resolution of the currently available data, and the variable clockwise and counterclockwise rotations reported, the most conservative interpretation is that rota-tions are controlled by local structures, without a wholesale rotation of the Tibetan Plateau [Lippert, 2010]. Consis-tently clockwise rotations were reported from the Qiang-tang terrane in eastern Tibet [Dupont‐Nivet et al., 2002, 2004a]. The magnitudes of post‐Cretaceous clockwise rotation increase eastward to∼50° in eastern Tibet [Otofuji et al., 1990; Huang et al., 1992; Huang and Opdyke, 1993; Sato et al., 1999; Yoshioka et al., 2003], and 90° clockwise in the Three Rivers region [Sato et al., 2001] (Figure 1). The Sichuan basin underwent no rotation [Huang and Opdyke, 1992]. The amount of rotation in eastern Tibet is roughly proportional to a change in the trend of the Qiangtang terrane from E‐W to NNW‐SSE. This has been interpreted as a result of Cretaceous to Cenozoic dextral shearing of the Qiangtang terrane along the western boundary of the South China Block as a result of short-ening of the Tibetan Plateau [England and Molnar, 1990; Dupont‐Nivet et al., 2002, 2004a].
3.4.6. E‐W Extension in Tibet and E‐W Shortening in the Longmen Shan
[36] The central and southern Tibetan Plateau, and in
forma-tion of N‐S trending (half‐)grabens in the middle to late Miocene [Armijo et al., 1986; Burchfiel et al., 1991; Coleman and Hodges, 1995; Yin et al., 1999b; Murphy et al., 2002; Garzione et al., 2003; Taylor et al., 2003; Jessup and Cottle, 2010; Leloup et al., 2010; Saylor et al., 2010]. Estimates for the onset of E‐W extension, based on stratigraphic analyses of associated basins and low‐temperature ther-mochronology of uplifted footwall rocks, cluster around ∼14–8 Ma [Burchfiel et al., 1991; Coleman and Hodges, 1995; Harrison et al., 1995; Blisniuk et al., 2001; Garzione et al., 2003; J. L. D. Kapp et al., 2005]. The distributed nature of the N‐S trending grabens leads to an eastward increasing rate of eastward motion of the Tibetan Plateau with respect to the Tarim block. This eastward increase is clearly observed in GPS measurements [Shen et al., 2001; He and Chery, 2008]. Much of the cumula-tive slip is accommodated in the north along the sinistral Kunlun fault, with a displacement of 100 ± 20 km in its central segment since 10 ± 2 Ma [Van der Woerd et al., 2000, 2002; Fu et al., 2005; Fu and Awata, 2007; Kirby et al., 2007]. Toward the east, slip along the Kunlun fault gradu-ally decreases with sinistral slip probably being transferred northward into the eastern Kunlun Shan [Kirby et al., 2007; Duvall and Clark, 2010].
[37] The east directed Longmen Shan thrust system
bounding the western margin of the Sichuan basin in eastern Tibet was predominantly active during the Mesozoic [Wang et al., 1989; Mattauer, 1992; Chen and Wilson, 1996; Li et al., 2003; Wilson et al., 2006; Zheng et al., 2006; Roger et al., 2008, 2010; Robert et al., 2010]. It was reactivated during the late Miocene (11–8 Ma) recorded by
40
Ar/39Ar and (U‐Th)/He cooling ages in its hanging wall [Kirby et al., 2002; Godard et al., 2009], and renewed subsidence in the Sichuan Basin [Wang et al., 1989; Zheng et al., 2006]. The fault system remains active today [Burchfiel et al., 2008]. Approximately∼20–25 km of E‐W Neogene shortening has been documented in the Longmen Shan thrust system [Wallis et al., 2003; Burchfiel et al., 2008; Hubbard and Shaw, 2009]. The South China block moved ∼80 km SE‐ward with respect to Siberia [Replumaz and Tapponnier, 2003]. E‐W compression in the Longmen Shan demonstrates that eastern Tibetan crust moved eastward at a higher rate than South China. The Sichuan basin behaved as a rigid indenter in late Neogene time [Clark and Royden, 2000], with Tibetan crust moving around the northern edge of the Sichuan Basin along dextral strike‐slip faults in the Qinling Shan since 9–4 Ma [Enkelmann et al., 2006]. SE‐directed motion of fragments of Tibet and the South China Block occurred between the sinistral Xianshuihe fault, and the dextral Jiali fault southwest of the Sichuan basin (Figure 2). 60–80 km of post‐8‐10 Ma displacement has been documented for the Xianshuihe fault [Allen et al., 1991; Wang and Burchfiel, 2000], and some additional displace-ment between 13 and 10 Ma may have occurred [Roger et al., 1995]. The Xianshuihe fault terminates in the south against the Red River Fault [Schoenbohm et al., 2006b]. The amount of displacement along the Jiali fault is unknown.
[38] We estimate ∼100 km of post 14–12 Ma extension
from Tibet. This value is determined from the∼20 km E‐W shortening in the Longmen Shan combined with the∼80 km SE ward motion of the south China block with respect to North China (Table 1, Figure 3).
3.5. Mainland SE Asia
3.5.1. SE Asian Terranes and Their Connection to Tibet
[39] The Qiangtang and Lhasa terranes correlate with pre‐
Cenozoic continental terranes in SE Asia (i.e.,‘Sundaland’) through the narrow region between the Eastern Himalayan syntaxis and South China–known as the Three Rivers region (Figures 1 and 2). The simplest and most common subdi-vision of Sundaland distinguishes among the Indochina, Sibumasu and West Burma/west Sumatra blocks, and the Andaman forearc and Burmese ophiolites (Figure 2).
[40] Given the apparent structural continuity of the
Qiangtang and Sibumasu blocks [Pubellier, 2008] and the similar ages of the Jinsha and Sibumasu‐Indochina sutures, it seems likely that Sibumasu and Qiangtang are part of the same microcontinent, that collided with Indochina/South China and the Songpan‐Ganzi terrane, respectively, in the late Triassic [Mattauer, 1992; Kapp et al., 2000; Ferrari et al., 2008; Cai and Zhang, 2009].
[41] Sibumasu is presently bounded in the west by the West
Burma Block, along the Miocene, dextral Sagaing fault [Curray et al., 1979] (Figure 2). In Myanmar, the western margin of the Sibumasu terrane was intruded by a Jurassic to lower Cretaceous arc (∼170–120 Ma) [Barley et al., 2003; Searle et al., 2007], with younger (120–50 Ma) grani-toids found to the west of the Sagaing Fault [Barley et al., 2003]. To the northwest of the Sagaing fault, serpentinite exposures contain zircon populations in jadeite that span an age range of 165–120 Ma [Shi et al., 2009]. These rocks are interpreted to have formed in an oceanic subduction channel that extended beneath the Jurassic‐early Cretaceous arc in Sibumasu. The age range of this subduction‐collision history is time‐equivalent to that of the Bangong‐Nujiang suture and therefore the West Burma Block may be correla-tive with the Lhasa block [Searle et al., 2007; Zhou et al., 2008].
3.5.2. Mainland Sundaland and the Red River, Three Pagodas and Mae Ping Faults
[42] Sundaland is bounded in the north by the >1000 km
long Red River Fault (RRF) [e.g., Peltzer and Tapponnier, 1988]. In the last∼8 Myr, the RRF accumulated 40 km of dextral displacement [Replumaz et al., 2001; Schoenbohm et al., 2006a]. Earlier in the Cenozoic motion along the RRF was sinistral. This sinistral motion forms the basis for models of major SE‐ward extrusion of Sundaland from between the Himalayas and the Qiangtang block [Peltzer and Tapponnier, 1988; Armijo et al., 1989; Leloup et al., 1995, 2001; Replumaz and Tapponnier, 2003; Royden et al., 2008]. Major controversy exists regarding the amount of sinistral displacement along the RRF. An initial estimate of 330 ± 60 km [Lacassin et al., 1993] was revised to 700 ± 200 km by the same group [Leloup et al., 1995]. Chung et al. [1997] proposed 600 km of displacement. Searle [2006], however, argued that the basins, sutures and volcanic belts used as piercing points cannot be demonstrated to be lateral equiva-lents and that the amount of displacement remains elusive. Fyhn et al. [2009] analyzed the offshore eastern continuation of the RRF in the East Vietnam fault zone (Figure 2); they concluded that sinistral displacement of the RRF is only ∼250 km. Hall et al. [2008] made a detailed plate restoration of SE Asia and concluded a similarly modest amount of
displacement along the RRF. In the discussion section we address the implications of both estimates (250 versus 750 km or more).
[43] The age of slip along the RRF is also controversial.
Its displacement was originally suggested to be kinemati-cally linked to the opening of the South China Sea between 32 and 16 Ma [Briais et al., 1993], corresponding to ∼30 and 17 Ma using the timescale of Cande and Kent [1995]. Recently, Searle [2010] suggested a maximum age range of 32–22 Ma, based on deformed and crosscutting granites in the Red River shear zone. Wang et al. [2000] presented cooling ages from rocks in the Ailao Shan to suggest a shorter, 27–22 Ma slip history. Fyhn et al. [2009] chal-lenged the connection of the RRF to the South China Sea spreading center based on analyses of seismic lines offshore western Vietnam. They concluded that the RRF is directly connected to the East Vietnam Fault Zone, and that the bulk of the displacement predated the middle Oligocene, with perhaps several tens of kilometers after that. In the recon-struction by Hall et al. [2008], a large part of the South China Sea opened in response to southward subduction of a proto‐South China Sea. This interpretation is based on a clear record of subduction from Borneo until the early Miocene. For a detailed reconstruction of southern Sunda-land, we refer to Hall [2002] and Hall et al. [2008]: We assume that all sinistral displacement along the RRF occurred between 30 and 20 Ma.
[44] Southern mainland Sundaland is crosscut by the Mae
Ping fault (a.k.a. the Wang Chao fault) and the Three Pagodas fault. The latter may be kinematically linked with the Tho Chu fault zone in the Bay of Thailand [Fyhn et al., 2010a]. Tapponnier et al. [1986] estimated 160 km of dis-placement for both the Three Pagodas and Mae Ping faults, of which Smith et al. [2007] suggested 10–30 km occurred in the Oligocene, and the rest in the Eocene. Lacassin et al. [1993] suggested that Mae Ping displacement was at least 35–45 km. The analyses of Fyhn et al. [2010a, 2010b] of the basins offshore southern Thailand and Vietnam support sinistral shear, and suggest a displacement of ∼50–100 km for the Mae Ping fault and up to 100 km of displacement along the Three Pagodas. Tjia and Liew [1996] suggested a 70 km dextral inversion of the Three Pagodas fault, but Fyhn et al. [2010a] concluded that this phase was of minor importance. Offshore stratigraphic and seismic data restrict sinistral motion along the Three Pagodas and Mae Ping fault zones to the late Eocene and Oligocene [Morley, 2007; Fyhn et al., 2010a, 2010b]. We reconstruct 100 km of dis-placement along the Mae Ping and Three Pagodas faults between ∼40 and 23 Ma (Table 1 and Figure 3). 3.5.3. West Burma Block, Sagaing Fault and Shan Scarp
[45] To the west, Sundaland is separated from the West
Burma Block by a dextral strike‐slip zone, which includes the Oligocene to early Miocene Shan Scarp shear zone and the late Miocene to Recent Sagaing Fault. The Sagaing Fault connects to the north with the Main Boundary Thrust of the Himalaya [G. Wang et al., 2008; Maurin and Rangin, 2009; Yin et al., 2010]. To the south, it connects with the ∼N‐S extensional spreading center of the Andaman Sea, which accommodated separation of the West Burma Block from the West Sumatra Block [Curray et al., 1979, 1982;
Jarrard, 1986; McCaffrey, 1992] (Figure 2). Extension in the Andaman Sea began around 11 Ma, and led to seafloor spreading since 4–5 Ma [Kamesh Raju et al., 2004; Khan and Chakraborty, 2005; Chakraborty and Khan, 2009]. The total Miocene displacement of the Sagaing Fault was estimated at ∼460 km based on a restoration of the Andaman Sea [Curray et al., 1979, 1982; Mitchell, 1981]. Bertrand and Rangin [2003] concluded that a total dis-placement since 4 Ma is 100–150 km. This latter estimate assumes no extension in the Andaman Sea prior to seafloor spreading. Approximately 450 km of displacement is consistent with the amount of India‐Asia convergence since∼10 Ma and supports the interpretation that the West Burma Block has moved with India since this time. Spreading in the Andaman Sea transfers slip along the Sagaing Fault to the slower slipping dextral Mentawai and Sumatra faults that partition the strike‐slip component of oblique subduction below Sumatra. Displacement along these faults is determined by 50–70 km of Pliocene extension in the Sunda Strait [Diament et al., 1992; Malod et al., 1995; Malod and Kemal, 1996; Schlüter et al., 2002]. This 50–70 km should be added to the 450 km of Andaman Sea extension to arrive at a displacement of the Sagaing fault of 510–530 km since ∼11 Ma.
[46] To the east of the Sagaing fault, a N‐S trending, high‐
grade metamorphic belt of several tens of kilometers wide is exposed in the Shan Scarp [Socquet and Pubellier, 2005]. The Shan Scarp is a steeply dipping, NNW striking dextral strike‐slip shear zone [Bertrand and Rangin, 2003]. To the north, it branches into the E‐W trending Mogok belt, which exposes N and S‐dipping foliations with NNW trending lineations and bivergent shear‐sense indicators [Bertrand and Rangin, 2003; Searle et al., 2007]. Cooling ages of metamorphic rocks range from ∼30 Ma in the south to ∼18 Ma in the north of the Shan Scarp, and ∼15 Ma in the Mogok belt [Bertrand et al., 2001]. The Mogok belt con-tinues northward to the Gaoligong shear‐zone along the Bangong‐Nujiang suture, southeast of the Himalayan syn-taxis [G. Wang et al., 2008]. Similar to the Shan Scarp, the Gaoligong is a dextral strike‐slip shear zone that yielded cooling ages of∼28 Ma [Wang et al., 2006]. It experienced a younger, late Miocene to Recent brittle transtensional episode [G. Wang et al., 2008]. There is no estimate for the total amount of dextral strike‐slip accommodated along the Shan Scarp, but the metamorphic record is interpreted to reflect significant dextral motion between the West Burma Block and Sibumasu since the late Eocene or early Oligocene. This is consistent with the presence of late Eocene to Miocene transtensional basins in central Myanmar, located between the Sagaing fault in the east and the Indo‐Burma wedge to the west. These basins have been inverted by dextral transpression since ∼10 Ma [Maurin and Rangin, 2009].
[47] The Indo‐Burman wedge is a 1200 km long, west‐
verging fold‐and‐thrust belt [Brunnschweiler, 1966; Gansser, 1980; Johnson and Alam, 1991]. It consists of Cretaceous to Oligocene turbidite sequences in the inner wedge that underlie ophiolites, and Paleozoic and older metasediments [Acharya and Mitra, 1986], and Miocene to Quaternary sediments of the Bengal fan in the outer wedge [Maurin and Rangin, 2009] (Figures 1 and 2). At least 11 km of shortening have accumulated in the outer wedge since 2 Ma [Maurin and
Rangin, 2009]. The inner wedge, which is bounded by∼N‐S trending dextral strike‐slip faults and thrusts, is intensely deformed due to E‐W shortening. The total amount of E‐W shortening in the inner wedge is unknown, however, in part because it includes a strong dextral transpressional component [Maurin and Rangin, 2009]. At present, ∼30% of the dextral shear between India and Sundaland is parti-tioned along the strike‐slip zones in the inner Indo‐Burma wedge [Vigny et al., 2003; Maurin and Rangin, 2009]. 3.5.4. Three Rivers Region and Gaoligong Fault
[48] Late Miocene and younger deformation northwest of
Sundaland accommodated the southward transfer of material from the Tibetan Plateau through the Three Rivers region between the eastern Himalayan syntaxis and the South China Block. GPS measurements [Allmendinger et al., 2007; Sol et al., 2007] show that along the eastern margin of the Tibetan Plateau, SSE‐directed motion is partitioned into N‐S sinistral strike‐slip along the Xianshuihe Fault and a minor component of E‐W shortening. To the south, GPS velocity vectors curve around the eastern Himalayan syn-taxis and become W‐directed with respect to Eurasia. These velocities follow the main structural trend, e.g., along the Gaoligong fault which curves from N‐S in the north to E‐W into the Mogok belt to the south [G. Wang et al., 2008]. The region of westward‐directed GPS velocity vectors south of the Himalayan syntaxis is characterized by N‐S trending active normal faults that originated in the late Miocene (∼8.5 Ma), and were especially active in the Pliocene [G. Wang et al., 2008]. These GPS velocity patterns suggest that most southward east Tibetan motion today, and probably at least since at the Pliocene, is transferred to the Indo‐Burma wedge.
3.5.5. Paleomagnetism of Sundaland
[49] Many paleomagnetic studies have been conducted in
Sundaland to constrain vertical axis rotations and paleolati-tudinal changes associated with the motion along the RRF. These studies, all based on Mesozoic to Eocene red beds from Thailand, Vietnam, the Three Rivers region in southern China, and Myanmar, generally conclude that mainland Sundaland had a significant southward motion component with respect to South China, with attendant Cenozoic clockwise rotation. The amount of clockwise rotation varies strongly from 0° in southern Vietnam [Chi and Dorobek, 2004] to 70°, or even larger rotations in the Shan Thai deformed belt south of the RRF [Yang et al., 1995; Aihara et al., 2007; Sato et al., 2007; Tanaka et al., 2008]. Most authors argue for ∼10–20° regional clockwise rotation of mainland Sundaland and strong rotations associated with distributed, dextral strike‐slip deformation in the Shan Thai region close to the RRF [Huang and Opdyke, 1993; Charusiri et al., 2006; Aihara et al., 2007; Takemoto et al., 2009]. Southern Sundaland, on the other hand, is characterized by counterclockwise rotations of ∼20–40° (Thai‐Malai penin-sula and Borneo) since late Cretaceous time [Richter et al., 1999; Yamashita et al., 2011], and 50° on Borneo in the Neogene [Fuller et al., 1999]. It remains uncertain whether these data indicate regional block rotations or local defor-mation associated with sinistral strike‐slip tectonism [e.g., Hall et al., 2008; Fyhn et al., 2010a].
[50] Many paleomagnetic studies have argued for major
Cenozoic southeastward displacement of Sundaland along the RRF. This conclusion is based on the findings of steeper
inclinations in rocks from mainland Sundaland than predicted by the Eurasian APWP. Estimates typically have errors of 5–10° and report southward latitudinal displacements of 7– 14° [Yang and Besse, 1993; Yang et al., 1995, 2001; Sato et al., 1999, 2001, 2007; Chi and Dorobek, 2004; Takemoto et al., 2005]. We discuss the tectonic implications of these reports in section 4.
4.
Interpretation: Retrodeforming Intra
‐Asian
Shortening and Extrusion
4.1. Reconstruction of Greater Asia
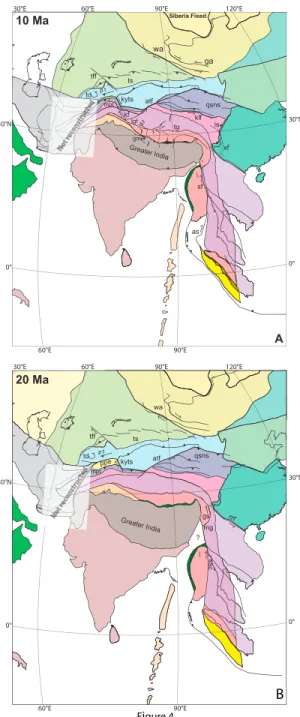
[51] Reconciling the kinematic constraints of intra‐Asian
deformation (Table 1 and Figure 3) leads to the evolution of Greater Asian deformation as shown in Figures 4a–4f. Figure 5 illustrates the amount of intra‐Asian shortening and Sundaland extrusion since 50 Ma. Figure 6 illustrates the portion of India‐Asia convergence that is accommodated in the overriding plate (i.e., Greater Asia) for three modern longitudes corresponding to the western, central and eastern regions of the collision zone. In this section, we summarize the main findings of this reconstruction. In following sec-tions, we discuss subregions in more detail. Our intra‐Asian shortening reconstruction uses the low end‐member esti-mates for displacements of the Karakoram fault and RRF, rather than larger estimates that would lead to 700 km or more of SE‐ward extrusion of Sundaland [Lee and Lawver, 1995; Replumaz and Tapponnier, 2003; Royden et al., 2008] (Figure 7). We discuss the differences between our reconstruction and models that predict major extrusion in section 4.6.
[52] We estimate a total of∼600 km of post‐50 Ma
short-ening at the longitude of eastern Tibet (∼95.5°E) (Figure 6). This deformation is partitioned between ∼450 km of N‐S Paleogene shortening in the Tibetan Plateau, and up to ∼150 km of N‐S shortening associated with slip along the ATF, which is accommodated in NE Tibet. At the longitude of central Tibet (∼82°E), ∼450 km of Tibetan shortening, a ∼150 km N‐S shortening component asso-ciated with the ATF, and ∼150 km of shortening in the Tien Shan and Mongolia result in ∼750 km of shortening since 50 Ma. In the western segment (∼72°E), south of the Pamir Hindu‐Kush region, the total amount of intra‐ Asian shortening is ∼1050 km since 50 Ma. This esti-mate is based on ∼350 km N‐S shortening associated with ∼400 km of cumulative right‐lateral displacement along the N30°W trending Karakoram fault and KYTS relative to Tibet (which underwent ∼450 km of short-ening since 50 Ma), and ∼250 km of shortening north of the Main Pamir Thrust.
[53] Additional post‐collisional N‐S shortening in southern
Tibet can be inferred from the observation that Cretaceous to Eocene Gangdese arc‐related granites are exposed immediately north of the IYSZ [e.g., Chiu et al., 2009]. The Xigaze forearc that must have developed above the Neo-tethyan subduction zone and south of the magmatic arc has thus been entirely consumed by shortening (e.g., under-thrusting or subduction erosion). Our restoration of the Gangdese and Great Counter thrusts assumes a pre‐Oligocene size of the Xigaze forearc of ∼100 km. Forearc basins are typically 166 ± 60 km wide [Gill, 1981]; shallow dipping slabs may increase this width to >400 km [Gutscher et al.,