HAL Id: insu-01830063
https://hal-insu.archives-ouvertes.fr/insu-01830063
Submitted on 4 Jul 2018
HAL is a multi-disciplinary open access
archive for the deposit and dissemination of
sci-entific research documents, whether they are
pub-lished or not. The documents may come from
teaching and research institutions in France or
abroad, or from public or private research centers.
L’archive ouverte pluridisciplinaire HAL, est
destinée au dépôt et à la diffusion de documents
scientifiques de niveau recherche, publiés ou non,
émanant des établissements d’enseignement et de
recherche français ou étrangers, des laboratoires
publics ou privés.
Seismic layer 2A variations in the Lucky Strike segment
at the Mid-Atlantic Ridge from reflection measurements
Tim Seher, Wayne Crawford, Satish Singh, Mathilde Cannat
To cite this version:
Tim Seher, Wayne Crawford, Satish Singh, Mathilde Cannat. Seismic layer 2A variations in the
Lucky Strike segment at the Mid-Atlantic Ridge from reflection measurements. Journal of Geophysical
Research, American Geophysical Union, 2010, 115 (B7), pp.B07107. �10.1029/2009JB006783�.
�insu-01830063�
for
Full Article
Seismic layer 2A variations in the Lucky Strike segment
at the Mid
‐Atlantic Ridge from reflection measurements
Tim Seher,
1,2Wayne C. Crawford,
1Satish C. Singh,
1and Mathilde Cannat
1Received 13 July 2009; revised 23 February 2010; accepted 3 March 2010; published 24 July 2010.
[1]
The SISMOMAR experiment carried out seismic measurements of the slow spreading
Lucky Strike segment of the Mid
‐Atlantic Ridge, located approximately 300 km south of
the Azores platform. We present results from a segment scale reflection study of seismic
layer 2A that is centered on the Lucky Strike volcano and covers the central 54 km of
the 70 km long segment and extends 30 km on both sides of the ridge axis. Our study
allows new conclusions about the role of tectonic, magmatic and hydrothermal processes
in shaping the upper crustal structure of the Lucky Strike segment. The seismic reflection
measurements show an almost constant layer 2A two
‐way time within the median valley
and an abrupt layer 2A two
‐way time decrease off‐axis. This two‐way time decrease is
caused by a layer 2A velocity increase on the order of 1 km/s. The uniform two
‐way time
in the median valley results from a constant thickness layer 2A, which could be caused by
the existence of a porosity threshold linked to the lithologic lava/dike boundary. The
regularity of the layer 2A/2B interface within the median valley indicates that layer 2A is
built entirely inside the median valley. The off
‐axis velocity increase is consistent with
hydrothermal alteration and the aging of the crust.
Citation: Seher, T., W. C. Crawford, S. C. Singh, and M. Cannat (2010), Seismic layer 2A variations in the Lucky Strike segment at the Mid‐Atlantic Ridge from reflection measurements, J. Geophys. Res., 115, B07107, doi:10.1029/2009JB006783.
1.
Introduction
[2] Upper oceanic crust at mid‐ocean ridges consists
mainly of basaltic pillow lava and sheeted dykes. The upper oceanic crust, named collectively layer 2, is characterized seismically by a steep velocity gradient (∼1–2 s−1), while
the lower crust, named layer 3, has a low velocity gradient (∼0.1 s−1) [Spudich and Orcutt, 1980]. Seismic layer 2 is
characterized by two, sometimes three sub‐layers [Houtz and Ewing, 1976; Houtz, 1976]. For consistency we apply a subdivision in two sub‐layers (2A and 2B) with velocities of ∼2–4 km/s and 5–6 km/s, respectively, with a transition zone having a steep velocity gradient region at the lower part of layer 2A [Harding et al., 1989; Christeson et al., 1996; Collier and Singh, 1998; Hussenoeder et al., 2002a, 2002b]. The sudden velocity change between layers 2A and 2B is caused by a change in porosities [Becker et al., 1982; Carlson and Herrick, 1990; Jacobson, 1992]. This change in porosities has been associated with different causes: (1) the pillow lava to sheeted dike transition, (2) an alter-ation front (below a certain depth pores have been sealed by alteration products), or (3) by a porosity threshold linked to increasing overburden pressures (below a certain depth
pores have been closed by the pressure of the overburden). A lithologic transition from pillow lava to sheeted dikes would create a porosity contrast due to the different emplacement processes and cooling history [Herron, 1982; Harding et al., 1993; Schouten et al., 1999; Becker et al., 2004]. This hypothesis is consistent with studies of exposed oceanic crust on land, for example the Oman ophiolite [Nicolas et al., 1988; Nicolas and Boudier, 1995; Boudier et al., 1997], and with seafloor outcrops, for example at the Hess Deep Rift part of the East Pacific Rise [Karson et al., 2002]. Hydrothermal circulation can alter the basaltic rocks through mineralization and pore clogging [Rohr et al., 1988; Jacobson, 1992]. Hydrothermal alter-ation decreases the velocity on a small scale, while the hydrothermal filling of voids decreases the porosity and hence increases the velocity on a larger scale [Carlson, 1998; Grevemeyer and Bartetzko, 2004]. As the study of Wilkens et al. [1991] indicates, the hydrothermal infilling of voids could give rise to a large velocity increase with only a small change in porosity (e.g., 5%). The filling of voids causes a transition from high to low porosity extrusives, which is imaged seismically as a transition from a high velocity gradient to a low velocity gradient [Christeson et al., 1996]. Finally, both active extension (faults, fractures and fissures) and accretion may create porosity in the upper oceanic crust. Crack closure with depth due to increasing confining pressure decreases the porosity and creates a velocity increase [Bratt and Purdy, 1984; Christeson et al., 2007], which may explain the change in seismic velocities necessary for the layer 2A/2B transition. The key assumption
1
Géosciences Marines, Institut de Physique du Globe de Paris, Paris, France.
2
Now at Earth Resources Laboratory, Department of Earth, Atmospheric and Planetary Sciences, Massachusetts Institute of Technology, Cambridge, Massachusetts, USA.
Copyright 2010 by the American Geophysical Union. 0148‐0227/10/2009JB006783
is that a specific pore size collapses under a certain pressure. If the rock matrix is dominated by pores of a specific volume or the seismic measurements are sensitive to porosity of a certain size, the pressure increase with depth may produce a porosity threshold.
[3] The layer 2A/2B transition has been observed for
zero‐age crust in most spreading environments and its depth generally correlates with spreading rate: slow spreading oceanic ridges have a slightly thicker layer 2A than fast spreading ridges [Carbotte and Scheirer, 2004]. On the fast spreading East Pacific Rise the average layer 2A thickness is 200 m [Harding et al., 1993], while, for the slow spreading Mid‐Atlantic Ridge, layer 2A thicknesses between 350 and 800 m are common [Hussenoeder et al., 2002b; Minshull et al., 2003]. Layer 2A thickness on intermediate spreading ridges appears to be more variable; it commonly lies between 200 m and 600 m for the Galápagos Ridge [Blacic et al., 2004] and Juan de Fuca Ridge [Cudrak and Clowes, 1993; McDonald et al., 1994; Canales et al., 2005; Van Ark et al., 2007; Nedimović et al., 2008] and between 400 m and 1 km for the Valu Fa Ridge [Day et al., 2001; Jacobs et al., 2007].
[4] Fast and intermediate spreading ridges, especially the
East Pacific Rise and Juan de Fuca Ridge and to a lesser degree the Galápagos Ridge, have been studied in suffi-ciently great detail to allow generalizing observations of lateral and temporal variations in layer 2A. In segments with an axial high, the layer 2A thickness of zero‐age crust increases with the depth of the axial melt lens along the ridge axis [Buck et al., 1997]. Furthermore, layer 2A thickness on fast‐ and intermediate spreading ridges increases with distance from the ridge axis [Harding et al., 1993; Hooft et al., 2000; Canales et al., 2005]. This is believed to be because younger lava bury the initially shallow top of the sheeted dike complex as the layer passes through the neovolcanic zone [Harding et al., 1993]. Finally, at fast‐ and intermediate spreading ridges seismic velocities in seismic layer 2A increase with distance from the ridge axis as a result of the aging of the oceanic crust, in particular the filling of open void spaces by hydrothermal alteration, and the related porosity decrease [Chapman and Hannay, 1994; Grevemeyer and Weigel, 1997; Sohn et al., 1997; Nedimović et al., 2008]. This age‐ dependent porosity/permeability trend is in agreement with borehole observations [Becker and Fisher, 2000]. It has been suggested that layer 2A velocities double over a period of 40 Ma, while the upper part of layer 2A gradually thins [Houtz and Ewing, 1976; Jacobson, 1992]. However, recent studies indicate that upper crustal velocities rise rapidly in less than 10 Ma [Carlson, 1998], while layer 2A thinning is marginal [Carlson and Jacobsen, 1994]. For the Juan de Fuca Ridge layer 2A can be thinner on the sedimented ridge flanks than on the ridge axis, but no systematic layer 2A thinning with age exists. The increase in layer 2A velocities with crustal age depends critically on the local setting and the age of sediment burial of the crust appears to be a more important factor than crustal age [Nedimović et al., 2008].
[5] Most studies of layer 2A along the Mid‐Atlantic
Ridge have focused either on the OH‐1 segment [Barclay et al., 1998; Hussenoeder et al., 2002b], which does not have a well developed median valley, or on the hot spot dominated Reykjanes Ridge [Navin et al., 1998; Peirce et al., 2007]. For the magma‐rich Reykjanes Ridge, layer 2A
thick-ness is observed to stay constant or decrease off‐axis [Navin et al., 1998; Peirce et al., 2007]. At slow spreading ridges the neovolcanic zones is limited to the rift valley, where most extrusives are built. This process is disrupted during tecton-ically active periods [Hussenoeder et al., 2002b].
[6] Here, we analyze the lateral variability of seismic layer
2A of the slow spreading Lucky Strike segment on the Mid‐ Atlantic Ridge. This ridge segment is particularly interest-ing, because a well‐developed median valley and central volcano with a high temperature hydrothermal vents field create an ideal setting for the study of the interaction between tectonic, magmatic and hydrothermal processes in upper crustal formation. Here, we present a study of seismic layer 2A using seismic reflection data. We shot 24 multi-channel seismic profiles covering the median valley and bounding walls of the Lucky Strike segment. We treated the near‐offset part of layer 2A turning waves like reflections from the bottom of layer 2A permitting us to seismically image the layer 2A/2B boundary. Our seismic reflection measurements cover the central 75% of the ridge segment and reach crust as old as 3 Ma, which allows us to image both spatial and temporal variations in the upper crust. The observations of seismic layer 2A constrain processes defining the seismic structure of young oceanic crust.
2.
The Study Area
[7] The Lucky Strike segment is located on the Mid‐
Atlantic Ridge south of the Azores hot spot and the Azores Triple Junction. The ridge segment is∼70 km long and is delimited by non‐transform offsets [Detrick et al., 1995; Parson et al., 2000]. The Lucky Strike segment has a 15 km to 20 km wide median valley, large ∼0.5 km high median valley bounding faults and a central volcano, which hosts high temperature hydrothermal vents [Langmuir et al., 1997]. An axial magma chamber is imaged seismically underneath the Lucky Strike volcano by an axial melt lens reflector [Singh et al., 2006; Combier, 2007] and underlying lower crustal low velocity zone [Seher et al., 2010a].
[8] As we explained above, magmatic, tectonic and
hydrothermal processes all can potentially influence the properties of seismic layer 2A. There is significant evidence for recent magmatism at the Lucky Strike segment. The central volcano and the western volcanic ridge, a volcanic edifice extending north‐west from the volcano show evi-dence for recent magmatic eruptions (see Figure 1a). The volcano holds a recent lava lake and the western volcanic ridge has fresh pillow lava [Fouquet et al., 1995; Humphris et al., 2002; Ondréas et al., 2009]. A teleseismic earthquake swarm registered on a regional hydrophone array is likely to be linked to a recent dike injection event [Dziak et al., 2004]. Tectonic processes also play an important role in the Lucky Strike segment. Photographic images reveal wide‐spread axis‐parallel faulting [Escartín et al., 2008]. There is evidence for a nascent fault system on top of the Lucky Strike volcano; a new seamount is constructed and is immediately rifted apart. Off‐axis rifted volcanos prove the interplay between periods dominated by magmatism and tectonics (J. Escartín, personal communication, 2005). Fur-ther evidence for the complex tectonic processes at segment ends are the inside corner highs, elevated detachment sur-faces linked to normal faulting [Karson and Dick, 1983;
SEHER ET AL.: LAYER 2A IN THE LUCKY STRIKE SEGMENT B07107 B07107
Severinghaus and MacDonald, 1988; Ranero and Reston, 1999]. Hydrothermal circulation is observed both on the Lucky Strike volcano and the Menez Hom massif (see Figure 1a). While the Lucky Strike hydrothermal field is hosted in a basaltic environment, the Menez Hom hydro-thermal system, close to the southern segment end, is hosted in an ultramafic setting [Marques et al., 2007].
3.
SISMOMAR Segment
‐Scale Reflection
Experiment
[9] We analyze seismic reflection data from a two‐
dimensional grid of 24 shot lines spaced ∼2.5 km apart collected along and across the Lucky Strike segment during the 2005 SISMOMAR cruise (see Figure 1b). These shot lines provide reflection data out to the segment ends and up to 30 km off‐axis. The observations of layer 2A cover a rectangular area of 54 km along the ridge axis and 60 km across. The air guns were tuned to generate a single bubble pulse [Avedik et al., 1993, 1996] and had an array volume of 8410 cubic inches. The shot spacing was 150 m, which corresponds to 1 shot every minute. The large volume seismic source and large delay between two successive shots were chosen to optimize the data for a coincident seismic refraction survey [Seher et al., 2010a]. The data were recorded on a 360 channel, 4.5 km long digital streamer. The receiver group spacing of the seismic streamer was 12.5 m and the near hydrophone offset was 185 m. The data were
sampled every 4 ms. The shot positions were determined from a differential GPS system and were corrected for the offset between the ship and the air gun array. For the seismic reflection survey the large shot point spacing meant a low fold of 15 in each common midpoint (CMP) gather.
4.
Data Processing
[10] Our seismic shot gathers show prominent sub‐seafloor
arrivals at medium and large offsets (>2.5 km) (Figure 2). Those arrivals correspond to seismic waves turning in the lower part of layer 2A and the upper part of layer 2B [Vera et al., 1990; Harding et al., 1993]. In order to get a first impression of the velocity variation in the Lucky Strike segment, we analyze shot gathers recorded close to the Lucky Strike volcano on the ridge axis and shot gathers recorded on the median valley wall.
[11] Here, we apply two‐way time (TWT) forward modeling
to identify the different seismic events in a single shot gather and estimate a subsurface velocity‐depth profile. We man-ually change a simple velocity‐depth profile and calculate synthetic TWT using the tomography code by Hobro et al. [2003] to reproduce the seismic arrivals observed in a shot gather. The subsurface is represented using a one‐dimensional velocity‐depth profile draped underneath the seafloor taking into account the three‐dimensional variation of the seafloor.
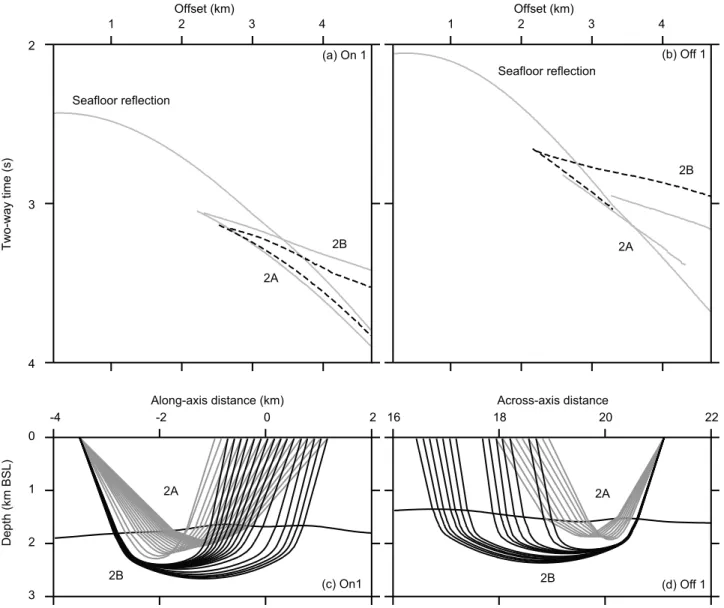
[12] The first prominent event is a retrograde event from
rays turning in the transition zone (2A) and the second Figure 1. (a) Bathymetric map of the Lucky Strike segment with important features of the seafloor. V:
Lucky Strike volcano. M: Menez Hom massif. I: Inside corner high. R: Volcanic ridge. WBF/EBF: West-ern/Eastern bounding fault. The solid black lines mark the eastern and western bounding fault and a nascent fault system. (b) Seismic reflection lines shot during the SISMOMAR cruise. The profiles marked in grey are used to constrain the lateral variability of seismic layer 2A and the profiles marked with black lines are discussed in more detail. The grey triangles and diamonds mark the positions of reference shot and CMP gathers shown in Figures 2 and 5, respectively. The bathymetric contours marking the Menez Hom massif, Lucky Strike volcano and inside corner high as well as the bounding faults are shown for orientation. The inset globe shows the Lucky Strike segment (LS) on the Mid‐Atlantic Ridge. The major plate boundaries are marked as solid black lines [Müller et al., 1997].
arrival is prograde, from rays turning in layer 2B (Figure 2). The velocity models and raypaths are shown in Figures 3 and 4. Prograde arrivals from rays turning in the upper part of layer 2A have not been identified. Without a detectable prograde 2A event, the data provide no con-straints on velocity structure of shallowmost layer 2A. Synthetic modeling the prograde arrivals indicates that this event interferes with the seafloor reflection making it diffi-cult to recognize in the shot gathers. We arbitrarily chose the velocity in the upper part of layer 2A to closely match the
velocity observed in the OH‐1 segment [Hussenoeder et al., 2002b].
[13] The velocity‐depth profiles used to fit the seismic
data are shown in Figure 3 after correction for the seafloor depth. The velocity structure shows a low‐velocity and low‐ gradient layer 2A, a transition zone with a steep velocity gradient and a higher‐velocity but low‐gradient layer 2B. The transition zone is considered to be part of layer 2A [Hussenoeder et al., 2002b]. Due to the absence of clear prograde layer 2A arrivals, near‐surface velocities are poorly constrained in our velocity models. The better con-Figure 2. Shot gathers recorded during the SISMOMAR experiment. (a and c) Shot gathers recorded on
the ridge axis near the central Lucky Strike volcano. (b and d) Shot gathers recorded off‐axis (see Figure 1 for location of the shot gathers). The modeled TWT for the retrograde 2A arrival (2A) and the prograde 2B arrival are shown superimposed on the shot gathers. The velocity models used for calculating the TWT are shown in Figure 3.
SEHER ET AL.: LAYER 2A IN THE LUCKY STRIKE SEGMENT B07107 B07107
strained velocities at the bottom of layer 2A are ∼1 km/s faster off‐axis than on‐axis. The average velocity to the layer 2A/2B boundary is ∼2.6 km/s at the segment center and ∼2.8 km/s off‐axis. The bottom of seismic layer 2A is located∼0.55–0.65 km below seafloor on all four velocity‐ depth profiles.
[14] For comparison with our velocity models we show
velocity models for the OH‐1 segment [Hussenoeder et al., 2002b] (Figure 3). Models G1 and G2 were located in the rift valley and models H1 and H2 on the eastern terrace. This comparison shows that the models by Hussenoeder et al. [2002b] are slightly thinner and faster for both on‐ and off‐axis locations than the Lucky Strike models. This dif-ference is to be expected due to the velocity‐depth trade‐off in our analysis. More importantly, off‐axis velocities are significantly faster (∼1 km/s) than on‐axis velocities in both the Lucky Strike and OH‐1 segments.
[15] To verify whether the off‐axis velocity increase of
∼1 km/s is significant, we compare the TWT predicted using the off‐axis and on‐axis velocity models (Figures 4a and 4b). Overall, we observe that the on‐axis velocity‐model does not fit the off‐axis data and vice versa. In particular, the on‐axis velocity model fails to reproduce the whole offset range of observed off‐axis layer 2B arrivals. This compar-ison demonstrates that most constraints in our velocity models are based on the TWT of the caustic and the slope of layer 2B arrivals. The constraints we were able to derive from retrograde layer 2A arrivals are minor due to inter-ference with the seafloor reflection.
[16] To further analyze the seismic data, we apply stack
based seismic imaging using a standard processing sequence: geometry definition, trace interpolation, normal moveout correction, dip moveout correction, stack and time migration [Yilmaz, 1987]. Since the layer 2A/2B transition does not create observable reflections, we use turning wave energy to image this boundary. For small offsets the TWT of the ret-rograde transition zone turning wave (2A) and of the pro-grade layer 2B turning wave (2B) are asymptotic to a hypothetical reflection from the bottom of the transition zone. Since the TWT in the caustic is asymptotic to the TWT of an reflector, we stack turning waves to obtain a seismic reflector image [Harding et al., 1993].
[17] The first step in processing seismic reflection data is
to set up the data processing geometry. Since the profile spacing is too large for a full three‐dimensional treatment, we chose to treat the data in two dimensions and assume the seismic streamer follows the course of the ship (i.e. there is no streamer feathering). Two static time corrections were applied to the seismic traces to account for the streamer and air gun depths as well as the time lag between the trigger and the air gun release. For this experiment the time lag varied between 22.1 ms and 44.1 ms.
[18] The next step is to determine the usable seismic
bandwidth and band‐pass filter the data to enhance the signal‐to‐noise ratio. Examining the spectral amplitude of the measured seismic data shows that most of the energy is contained between 5 and 35 Hz. Seismic deconvolution was not applied in this study because of problems related to the treatment of an unknown mixed‐phase source wavelet. Applying a Wiener spiking deconvolution did not improve the seismic image significantly.
[19] The shot spacing was 150 m and the receiver spacing
12.5 m, which yields a CMP trace spacing of 300 m and a fold of 15. A large trace spacing in a CMP gather can cause spatial aliasing, which we avoid by trace interpolation. In order to decrease the trace spacing, the seismic data were sorted into receiver domain and interpolated to 37.5 m trace spacing. Reordering the data in CMPs increases the trace spacing to 75 m and the fold to 60. The interpolation applied here is based on estimating the semblance via a local slant stack [Schultz and Claerbout, 1978] for all the traces within a spatial window [Spitz, 1991; Porsani, 1999].
[20] Next, we applied a dip moveout (DMO) and a normal
moveout (NMO) correction [Yilmaz, 1987], before stacking the data. The NMO and DMO correction correct the layer 2A/2B event to its normal incidence TWT. Furthermore, the DMO correction reduces scattered waves from shallow diffractors and causes some CMP smearing [Klinkby and Pedersen, 1998], which enhances the continuity of the layer 2A/2B event. The NMO correction is combined with a stretch mute to avoid frequency distortion. To apply the DMO correction, the seismic traces are resampled to equal offsets, then transformed into the frequency‐wave number domain, where the DMO operator [Notfors and Godfrey, 1987; Liner, 1990; Black et al., 1993] is applied. The data are then transformed back into time‐offset domain.
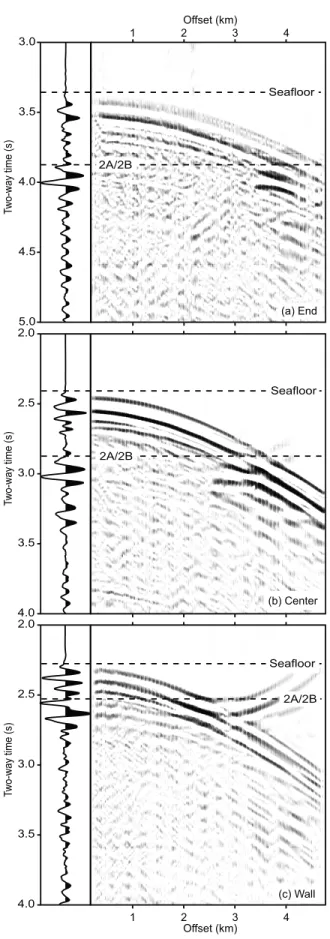
[21] To demonstrate the presence of layer 2A/2B energy
in the data, we show three representative super‐CMP gathers located close to the segment end, at the segment center and at the eastern median valley wall (Figure 5). After band‐pass Figure 3. Comparison of on‐axis and off‐axis velocity
structure (see Figure 1 for location of the shot gathers). The black points mark the approximate location of the layer 2A/2B boundary. The velocities shown here were used in modeling the shot gathers shown in Figure 2. For compar-ison we show velocity models for the OH‐1 segment in grey [Hussenoeder et al., 2002b]. G1 and G2 were located in the segment center and H1 and H2 off‐axis. Depth given in km below seafloor (BSF).
filtering, trace interpolation and normal moveout correction, we combined 11 CMP gathers into one super‐CMP gather. All three super‐CMP gathers show the caustic marking the layer 2A/2B transition, which we stack to image the vari-ability of seismic layer 2A. Two choices influence the stacked image: the choice of the NMO velocity and the choice of the stacked offset range.
[22] The image quality depends on the selection of
appropriate NMO velocities. To choose the NMO velocities, constant velocity stacks were calculated for a variety of velocities (Figure 6). The seafloor and the layer 2A/2B transition are recognizable at NMO velocities of 1.8, 1.9 and 2.0 km/s. In the median valley the layer 2A/2B event is best imaged using a NMO velocity of 1.9 km/s. Choosing a lower or higher velocity deteriorates the image quality. Off‐ axis a higher NMO velocity of 2.0 km/s gives a slightly better layer 2A/2B image. If we compare the images obtained using
a constant velocity to those obtained using a manually selected NMO velocity that carefully aligns the layer 2A/2B event, the image quality is comparable whether we choose a constant velocity model or manually pick the stacking velocity.
[23] The second choice influencing the image quality is
the choice of the stacked offset range. While the seafloor contributes mostly at small offsets, the layer 2A/2B transi-tion can be observed only at offsets larger than 1.5 km. Therefore, we carefully picked a mute to remove layer 2B turning wave energy and only stack energy close to the caustic. Compared to a constant velocity stacks without mute the image of the layer 2A/2B event does not improve after application of a top‐mute (Figure 6). This is caused by the application of a NMO correction prior to stack. Layer 2B energy at far offsets is removed by the stack.
Figure 4. Synthetic TWT and associated raypaths for one location on the ridge axis and one location on the ridge flank. (a and b) The synthetic TWT for the velocity models, which best fit the TWT observations in Figures 2a and 2b, are marked with a dashed black line and (c and d) the associated raypaths. The number of rays shown here has been reduced by a factor 10. To illustrate the difference between the ridge axis and ridge flank velocity models, we show synthetic TWT that were estimated assuming the off‐axis velocity model for the ridge axis and vice versa (grey line in Figures 4a and 4b).
SEHER ET AL.: LAYER 2A IN THE LUCKY STRIKE SEGMENT B07107 B07107
[24] We conclude that we can stack the seismic data using
a constant velocity without muting layer 2B energy. After analyzing constant velocity stacks for all seismic profiles, we chose a one‐dimensional (1D) sub‐seafloor velocity profile to stack all seismic profiles. We used an NMO velocity of 1.9 km/s from the sea surface down to 0.75 s below the seafloor, to obtain an optimum image of layer 2A, and 3.1 km/s from 1 s down, to image later events [compare Singh et al., 2006]. Those two constant velocity regions are connected by a linear velocity gradient. The seafloor reflection can be observed at small offsets, which are only mildly affected by the choice of the stacking velocity. Therefore, the seafloor event stacks well at velocities slightly larger than the water velocity. Our approach of using the same model everywhere assures line‐to‐line comparability: no variations are introduced into the image by variations of the velocity model.
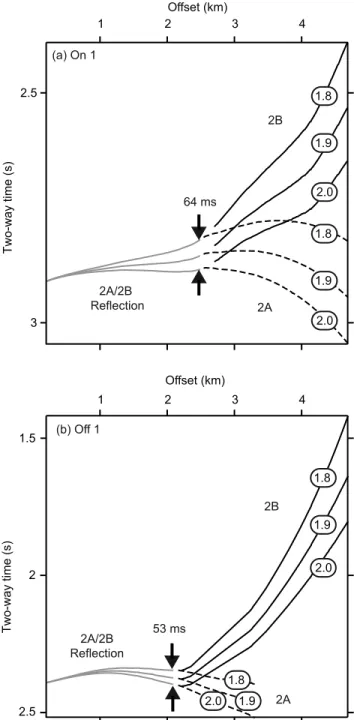
[25] To estimate the uncertainty introduced by the choice
of a NMO velocity, we compare the TWT for refracted arrivals at different NMO velocities with those of theoretical reflected arrivals. Here, we estimated the TWT for reflec-tions by assuming a sharp interface at the top and the bottom of the transition zone. Figures 7a and 7b show a comparison of turning wave TWT and TWT for a reflector after applying a NMO correction of 1.8 km/s, 1.9 km/s and 2.0 km/s, respectively. The velocity models used in modeling are shown in Figure 3. When stacking the seismic data, the near‐offset part of the seismic events behaves like a reflection delineating the bottom of the transition zone. The far‐offset part of the seismic events shown here cancels in the summation. In conclusion, if the NMO velocity is carefully chosen, turning wave arrivals originating inside the transition zone can be used to map the layer 2A/2B transi-tion [Harding et al., 1993]. With an appropriate normal moveout, velocity arrivals from both the upper part of layer 2A and 2B are unlikely to contribute significantly to the image when stacking the data. Choosing a different NMO velocity shifts the TWT of the caustic, the time at which the turning wave energy contributes to the seismic image. This choice contributes ∼60 ms to the TWT uncertainty in our seismic image.
[26] The last step in our seismic processing sequence is
post‐stack frequency‐wave number constant velocity time migration [Stolt, 1978; Stolt and Benson, 1986] with a migration velocity of 1.5 km/s. This significantly reduces the effect of scattering from the rough seafloor. Depth migration cannot be applied because the velocity structure inside layer 2A is poorly known. Since we use turning waves and not true reflections, the stacking velocity does not constrain the upper crustal velocity. Velocity models Figure 5. Normal moveout corrected super‐CMP gathers and resulting stacked trace. The pre‐stack processing involved band‐pass filtering (5–35 Hz), trace interpolation, normal moveout correction with a velocity of 1.9 km/s and construction of super gathers from 11 CMP gathers. The approximate position of the seafloor reflection and the layer 2A/2B transition is marked on all gathers. The CMP gathers are located at (a) the southern segment end, (b) the segment center and (c) the eastern median valley wall (CMP locations shown in Figure 1).
Figure 6
SEHER ET AL.: LAYER 2A IN THE LUCKY STRIKE SEGMENT B07107 B07107
from the coincident seismic refraction experiment have a large uncertainty in layer 2A [Seher, 2008; Seher et al., 2010a, 2010b].
[27] Having processed the seismic data into a seismic
image, the next step is to interpret this image. The horizons are picked manually by digitizing the seafloor and the layer 2A event. Adjacent picks were automatically interpolated by following either a minimum/maximum amplitude or a zero crossing. Because a bubble tuned source was used to enhance the low frequency content of the signal, picking the first break proved difficult. The first break is weak com-pared to other parts of the seismic wavelet. Picking on maximum amplitude and then shifting the picks to first break is more practical.
[28] The TWT inside layer 2A (DTWTSF−2A) was
calcu-lated by subtracting the TWT to the seafloor (TWTSF) and to
the layer 2A event (TWT2A). To carry out the
differentia-tion, we need to address two problems: the non‐continuous sampling of the interfaces and the short wavelength noise created by the numerical differentiation. We addressed the non‐continuous sampling by interpolating the picks to a regular spacing, while keeping track of unsampled regions. The problem of short wavelength noise was resolved by low‐pass filtering the input data sets prior to the differentiation using a Gaussian filter with a total full‐width at half maximum of 709 m (113 CMP). Low‐pass filtering removes short wavelength variations caused by changes in bathymetry.
5.
Results
[29] Generally, the seafloor and layer 2A appear more
continuous on profiles running along the ridge axis. This is due to the fact that the strike of the major faults is ridge parallel and the seafloor varies less in this direction, which improves the quality of the seismic images. The dominant strike of the major faults causes the seafloor and layer 2A to vary more abruptly on profiles across the ridge axis than on profiles along the ridge axis (Figures 8, 9, 10, and 11). While large changes in TWT are observed across the ridge axis, the TWT varies rather smoothly along the ridge axis.
[30] On along‐axis profile 101 (Figure 8), which runs
directly across the Lucky Strike volcano, TWT2A follows
TWTSFand DTWTSF−2Ais uniform over most of the ridge
segment. A slight DTWTSF−2Aincrease is observed at the
southern end of the profile for along‐axis distances between 20 km and 30 km (Figure 8). Comparing the variations of layer 2A with the bathymetry along the central part of the median valley (Figure 8c) shows the abundance of volcanic features and faults. While the central volcano is character-ized by flat lava, numerous volcanic ridges can be observed farther south.
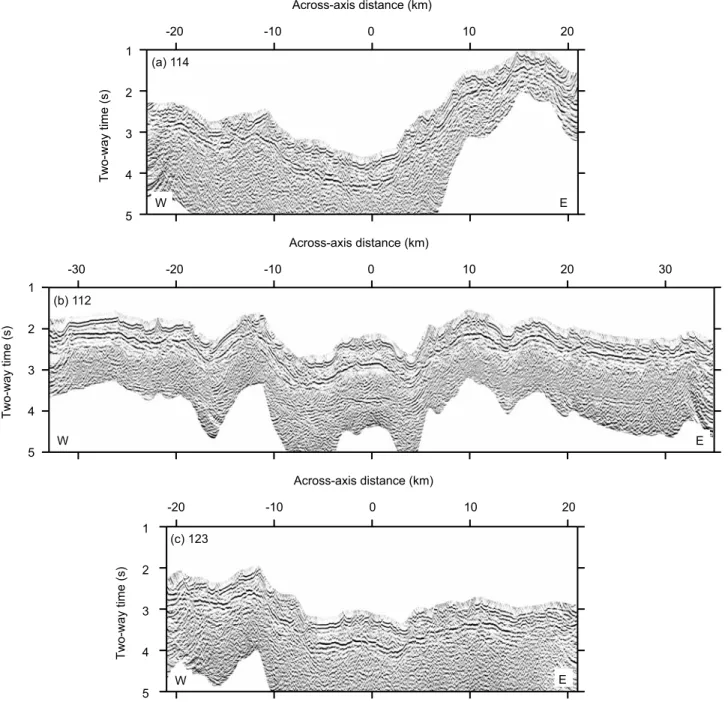
[31] Across the ridge axis, layer 2A is imaged almost
continuously. Figures 9 and 10 show the variability of seismic layer 2A in this direction ∼13 km north of the Figure 6. Influence of the choice of the stacking velocity on the image quality at (a–e) the southern segment end, (f–j) the segment center and (k–o) the eastern valley wall. The first three panels in each row show 400 traces stacked using a constant moveout velocity of 1.8, 1.9 and 2.0 km/s respectively and a 65% stretch mute. The fourth column shows 400 traces stacked using a variable moveout velocity that was picked manually to enhance the image of the layer 2A/2B transition. Special care was taken to choose faster stacking velocities off‐axis than in the median valley. The fifth column shows 400 traces stacked using a constant moveout velocity of 1.9 km/s after application of top mute to remove energy turning in layer 2B. The wiggle traces (b,g,l) correspond to the stacked traces shown in Figure 5.
Figure 7. A comparison of TWT for a reflection from the bottom of seismic layer 2A, the retrograde layer 2A event (2A) and the prograde layer 2B event (2B) shows that in the caustic the turning rays are asymptotic to a reflection. The TWT were estimated using the (a) on‐axis and (b) off‐ axis velocity models shown in Figure 3. The numbers on each TWT curve denote the normal moveout velocity and the arrows denote the TWT variability caused by the choice of one stacking velocity.
segment center, at the segment center and 12 km south of the segment center. DTWTSF−2Adecreases abruptly in the
vicinity of the median valley bounding faults and decreases more gradually underneath the flanks of the median val-ley. Most importantly,DTWTSF−2Ais larger on‐axis than
off‐axis.
[32] The variation of layer 2A underneath the Lucky
Strike seamount is of particular interest, because it contains information about the construction of the volcano and the porosity and permeability structure allowing the existence of the Lucky Strike hydrothermal vent field. Across‐axis,
DTWTSF−2Ais largest underneath the Lucky Strike volcano
(Figures 9 and 10). The weak sub‐layer 2A reflectors underneath Lucky Strike volcano (Figures 8 and 11) are likely caused by sideswipe, since those events cannot be observed on our across‐axis profiles.
[33] The interpretation of faults shown here is not based
on subsurface fault reflections, because the large shot point spacing (150 m) and profile spacing (∼2 km) in this study make it difficult to image the faults directly. For comparison during the high‐resolution study of the Lucky Strike vol-cano, a smaller shot point spacing (37.5 m) and profile spacing (0.1 km) allowed the direct imaging of fault reflections [Combier, 2007]. However, displacements of the seafloor and layer 2A events can be used to identify fault positions. All three across‐axis seismic profiles (Figures 9, 10, and 11) show large vertical displacements of the seafloor and layer 2A events caused by the eastern and western median valley bounding faults. Furthermore, multiple deep incisions into the seafloor are observable parallel to the ridge axis outside the median valley.
[34] To image the lateral variation of the layer 2A/2B
boundary, we assigned each TWTSF, TWT2AandDTWTSF−2A
Figure 8. Along‐axis variation of the seismic layer 2A/2B boundary. The origin of the coordinate sys-tem corresponds to the location of the Lucky Strike volcano (V). The sub‐layer 2A events (S) are possibly linked to sideswipe. (a) Time migrated image. (b) Interpretation of the image showing the seafloor reflec-tion, the layer 2A/2B boundary and several sub‐layer 2A events. The black lines mark the location of crossing profiles (see Figure 1 for the profile location) and the grey dots mark the corresponding sea-floor and layer 2A/2B picks. (c) Bathymetry along the median valley to highlight volcanic features and faults (black lines). The profile runs from south to north.
SEHER ET AL.: LAYER 2A IN THE LUCKY STRIKE SEGMENT B07107 B07107
value to a position in space based on its common midpoint position. Since the average line spacing (1–2 km) is much larger than the common midpoint spacing (6.25 m), the interfaces are much better sampled along profiles than between profiles. We, therefore, interpolated the data onto a 0.5 km by 0.5 km regular grid (Figure 12). This interpolation reduces the along‐profile data by a factor of 80 and signifi-cantly increases the signal quality.
[35] The seismic seafloor (Figure 12a) agrees well with
the seafloor estimated from multibeam bathymetry. Layer 2A (Figure 12b) follows the variation of the seafloor to first order. The averageDTWTSF−2Ais∼550 ms in the segment
center and decreases to∼350 ms off‐axis. This variation is
symmetric about the ridge axis. This change inDTWTSF−2A
occurs at or near the median valley bounding faults. The largest DTWTSF−2Aof 600 ms is observed underneath the
volcanic ridge north‐west of the volcano. Interestingly,
DTWTSF−2A shows ridge parallel anomalies, suggesting a
link with extensional fault systems.
[36] To study long wavelength variations of layer 2A, we
low‐pass filtered DTWTSF−2Ausing a Gaussian filter with a
width of 10 km (Figure 12d). As with the unfiltered data,
DTWTSF−2A is smallest outside the median valley. The
difference is on the order of 200 ms. The local TWTSFand
TWT2Aanomaly observed below the volcano is absent from
DTWTSF−2A.
Figure 9. Time‐migrated seismic section showing the across‐axis variation of the seismic layer 2A/2B boundary along profiles (a) 114, (b) 112 and (c) 123. Profile 114 runs approximately 12.7 km north of the Lucky Strike volcano, profile 112 crosses directly over the volcano and profile 123 is located 12.1 km south of the volcano. The profiles run west to east (see Figure 1 for the profile location).
[37] To establish a more reliable image of DTWTSF−2A,
we examined the variations ofDTWTSF−2Aas a function of
distance from the ridge axis (Figure 13a) and of distance along the ridge axis (Figure 13b). This procedure averages out small changes in DTWTSF−2A and highlights areas
where significant changes occur.
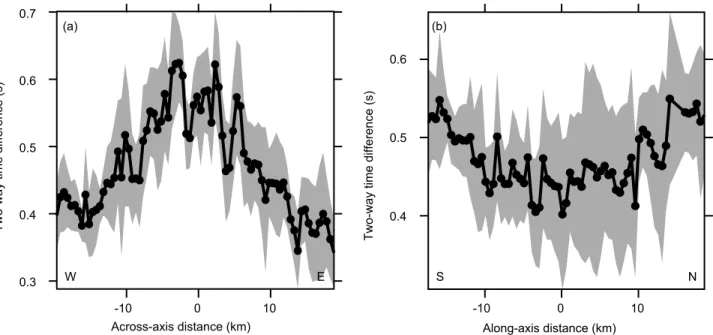
[38] Across‐axis, DTWTSF−2A is largest in the median
valley and smallest outside the median valley (Figure 13a). The variations are symmetric across the ridge axis with a slight offset to the west of the valley center. TheDTWTSF−2A
variations along the ridge axis are small, leading to a small standard deviation within every bin (the grey area). This shows a symmetry of the Lucky Strike segment with respect to the ridge axis. Figure 13b shows the along axis variations for comparison. DTWTSF−2Aincreases toward the segment
ends, but this increase of 100 ms is small compared to the across axis variation. Furthermore, the standard deviation is large due to the averaging of across‐axis variations. Com-paring with the lateral variation of the layer 2A/2B boundary (Figure 12d) shows aDTWTSF−2Aincrease toward the
seg-Figure 10. Interpretation of the seismic sections shown in seg-Figure 9. The variability of the seafloor and the layer 2A/2B boundary as well as the location of major fault systems is shown. The fault interpretation is based on offsets seen for the seafloor and the layer 2A/2B boundary. V: Lucky Strike volcano. AMC: Axial melt lens reflection. WBF/EBF: Western/Eastern bounding fault. I: Inside corner high. M: Possible multiple reflections. The black lines mark the location of crossing profiles and the grey dots the corresponding seafloor and layer 2A/2B picks. The profiles run west to east (see Figure 1 for the profile location).
SEHER ET AL.: LAYER 2A IN THE LUCKY STRIKE SEGMENT B07107 B07107
ment ends outside the median valley, while DTWTSF−2A
inside the median valley is approximately constant. Last, averagingDTWTSF−2Aas a function of radial distance from
the volcano has shown no systematic increase inDTWTSF−2A
at the volcanic segment center.
6.
Uncertainties
[39] In this study the lateral sampling along‐profile is
6.25 m and the temporal sampling 4 ms. However, the measurement uncertainty is significantly larger than the pixel size. To interpret the image of layer 2A, one needs to understand the quality of the picked TWT. Different error sources can influence the data differently and it is important to understand the nature and the origin of measurement errors. The biggest errors are related to: the data processing applied (especially the choice of a stacking velocity), errors in the location of streamer and source and the uncertainty in the manual picking of seismic events. The choice of the stacking velocity profile introduces an uncertainty of∼60 ms. Here, we will analyze errors associated with the use of a two‐dimensional processing geometry and the manual picking by comparing TWT on crossing profiles.
[40] The data were acquired along a grid of lines with
lines running approximately from north to south and from west to east. At the crossing points of those lines the same position is thus remeasured (Figure 14a). Subtracting the TWT picked at these points yields a residual. Treating the residuals as one ensemble, we estimate the mean and the standard deviation. The mean is non‐zero for both the sea-floor and layer 2A events (Figures 14b and 14c), but the mean residuals are smaller than one standard deviation. The stan-dard deviation can be used to estimate the pick uncertainty (the cross‐over error), which is ∼50 ms for the seafloor event and∼75 ms for the layer 2A event.
[41] Taking into account the approximations made during
processing and the choice of the stacking velocity, we estimate the total uncertainty for a single DTWTSF−2A
measurement to be∼110 ms.
7.
Thickness or Velocity Variations
[42] We want to convert the observed TWT to depth.
Depth migrating the TWT image is not possible, since it requires the knowledge of the subsurface velocity structure. A TWT variation of a seismic interface can be caused by Figure 11. Comparison of along‐axis and across‐axis variability of the layer 2A/2B boundary. (a and c)
Profile 106 runs parallel to the ridge axis approximately 1.6 km west of the volcano and (b and d) profile 118 orthogonal to the ridge axis approximately 2.8 km north of the volcano. V: Lucky Strike volcano. S: Sub‐layer 2A events. WBF: Western bounding fault. The black lines mark the location of crossing pro-files (see Figure 1 for the profile location) and the grey dots the corresponding seafloor and layer 2A/2B picks.
both a change in seismic velocity and/or a change in inter-face depth. Since no high‐resolution velocity model of the near‐surface exists, we chose to explore two end‐member models having a constant velocity and variable thickness layer 2A or a constant thickness and variable velocity layer 2A. This allows us to assess whether the two models are consistent with our observations. We use the code of Hobro et al. [2003] to convert the observed normal‐incidence TWT to velocity or depth. Since normal‐incidence data cannot be used to simultaneously constrain interface depth and velocity, we fix one of the parameters and invert for the other. Smoothness regularization inhibits abrupt variations of velocity or depth and respects the uncertainty of the TWT observations. A similar result could be obtained by linking
TWT to velocity or depth for every TWT pick and smoothing the resulting image.
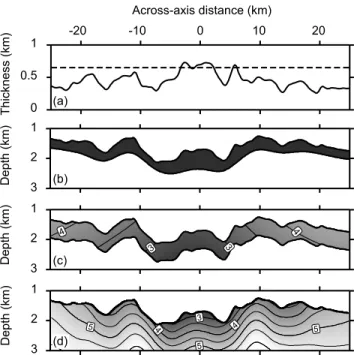
[43] Model I assumes an average layer 2A velocity of
2.5 km/s and a variable layer 2A thickness (Figure 15b). Model II assumes a layer 2A thickness of 650 m and a variable layer 2A velocity (Figure 15c). While model I requires a layer 2A thickness decrease of 350 m over a distance of 20 km from the ridge axis, model II requires a velocity increase on the order of 1–1.5 km/s to explain the same observations. Along the ridge axis, we observe very little variability for the two models. For the constant velocity model I layer 2A thickness varies by less than 0.1 km along the central 40 km of the ridge segment. For the constant layer 2A thickness model II along‐axis layer 2A velocity Figure 12. Lateral TWT variability. The TWT picks for the 24 studied profiles were gridded to construct
a three‐dimensional image of the layer 2A variation. Image of (a) TWTSFand (b) TWT2A(c) Unfiltered
DTWTSF−2A. (d) Low‐pass filtered DTWTSF−2Ausing a Gaussian filter with a filter width of 10 km.
SEHER ET AL.: LAYER 2A IN THE LUCKY STRIKE SEGMENT B07107 B07107
varies by less than 0.5 km/s over the central 40 km of the ridge segment.
[44] Both models I and II can explain the observed normal‐
incidence TWT. Based on the normal‐incidence observations alone it is not possible to differentiate between the two scenarios. For comparison with the two scenarios presented here, we show upper crustal velocities from a coincident seismic refraction survey [Seher et al., 2010a]. We note that the layer 2A velocities in the tomography model are poorly constrained because of the geometry of the raypaths. However, the tomography model (Figure 15d) shows a comparable velocity increase of∼1 km/s with distance from the ridge axis.
8.
Discussion
[45] The key observations made in this study are: an
almost constant DTWTSF−2Aof∼550 ms along the central
40–45 km long portion of the ridge segment and a DTWTSF−2A
decrease of ∼200 ms across the median valley bounding faults. These observations are symmetric with respect to the ridge axis; DTWTSF−2A is almost constant throughout the
median valley and the DTWTSF−2Adecrease occurs at both
the eastern and western bounding faults. Furthermore, recent volcanic edifices cause only minor variations inDTWTSF−2A.
TheDTWTSF−2Adecrease across the median valley bounding
faults is significantly larger than the uncertainty of the unfil-tered DTWTSF−2A. This uncertainty amounts to ∼110 ms.
However, the filtered image is more reliable than the uncer-tainty given above.
[46] Comparing our seismic images with images from
seismic experiments where imaging conditions and acqui-sition parameters were better (e.g., smoother seafloor and smaller shot spacing), the seismic layer 2A boundary in our
images appears more continuous. This continuous appear-ance may be linked to along‐profile “smearing” due to pre‐ stack trace interpolation and DMO correction.
[47] The observed normal incidence TWT2A may be
explained using one of two end‐member models for the structure of layer 2A (Figure 15). In the first scenario a constant velocity layer 2A is created at the ridge axis and is thinned by 350 m as the crust is rifted off‐axis. In the second scenario a constant thickness layer 2A is created at the ridge axis. As the crust is rifted off‐axis, layer 2A velocities increase by 1–1.5 km/s. TWT modeling for a shot gathers on the ridge axis and on the bounding walls indicates a velocity increase of ∼1 km/s (Figure 3). A coincident seismic refraction survey [Seher et al., 2010a] has shown a similar upper crustal velocity increase of∼1 km/s. These two independent observations showing an upper crustal velocity increase imply that most the observedDTWTSF−2Adecrease
is accommodated by an off‐axis velocity increase and only a small part of the DTWTSF−2A decrease may be caused by
layer 2A thinning. Furthermore, Hussenoeder et al. [2002b] observe a similar velocity increase for the OH‐1 segment. Applying the porosity‐velocity relationship by Carlson and Herrick [1990] this velocity increase can be explained by a porosity decrease of∼8%.
[48] There are three possible explanations for the observed
velocity increase and porosity decrease causing the layer 2A/2B transition: (1) A lithologic boundary between extrusive and intrusive basalt, (2) an alteration front below which pores have been filled with alteration products, or (3) a porosity limit below which pores are closed by the overbur-den pressure. It is likely that a single mechanism may not be able to explain the observations and hence one or more pro-cesses might be occurring synchronously or successively. Figure 13. Two‐way time difference DTWTSF−2A(a) as a function of across‐axis distance and (b) as
function of along‐axis distance. The DTWTSF−2Avalues along all profiles were sorted with respect to
along‐ or across‐axis distance. Next, the data were binned and averaged to obtain a mean DTWTSF−2A
Therefore, it is important to address whether a mechanism dominates in different parts of the Lucky Strike segment.
[49] It is particularly interesting to know if there is a link
between the constant thickness layer 2A and a constant thickness extrusive layer inside the median valley. How can the constant layer 2A thickness inside the median valley be explained? Assuming that hypothesis 1 is correct and the boundary between layers 2A and 2B corresponds to the boundary between extrusive and intrusive basalt, dike injection events and a similar thickness of lava flows are required along the length of the segment. The seafloor morphology in the Lucky Strike segment shows that vol-canism is not concentrated at the segment center, but exists throughout the median valley. Dike injection events over large distances have been observed in Iceland [Buck et al., 2006], Ethiopia [Wright et al., 2006; Doubre et al., 2007] and at Axial Volcano on the Juan de Fuca Ridge [Dziak and Fox, 1999]. Furthermore, there is evidence for a recent diking episode in the Lucky Strike segment [Dziak et al., 2004] and for volcanic morphologies along the whole length of the median valley [Parson et al., 2000]. No thickening of layer 2A is observed outside the median valley, which indicates crustal accretion is limited to the median valley. This agrees well with the well documented fact that axial valley walls typically have magnetic anomaly ages of 700 ka or more [Miranda et al., 2005]. Last, if the bottom of layer 2A corresponded to the limit between extrusive and intrusive basalt, this would explain a slightly elevated
DTWTSF−2A underneath the volcano and the western
vol-canic ridge due to the greater abundance of extrusive lava. [50] This hypothesis agrees with observations for the
OH‐1 segment at 35°N. Hussenoeder et al. [2002b] observe a regular layer 2A within the rift valley and conclude that most of the extrusive section is built on the inner valley floor through a pattern of lava deposition, which is inter-rupted during tectonically dominated periods. Hussenoeder et al. [2002b] further observe thickening of layer 2A toward the Oceanographer fracture zone, which they interpret as result of along‐axis magma transport. Here, we observe a small increase in DTWTSF−2A toward the southern nodal
basin, but do not require a significant thickness decrease. [51] For ridges with an axial high Buck et al. [1997]
predict that a deep magma chamber would be linked to a thick extrusive layer. For the Lucky Strike segment both a deep axial magma chamber [Singh et al., 2006; Combier, 2007] and a thick layer 2A have been observed. If one ig-nores the influence of the wide median valley, this implies Figure 14. TWT uncertainty estimate based on crossing profiles. When two seismic lines cross, approximately the same seismic measurement is repeated. Subtracting TWT measurements on different seismic profiles but within half a common midpoint spacing (3.25 m) of each other is used to estimate a TWT residual. (a) The positions of all seafloor TWT picks are shown as black points. The crossings used to estimate the residuals for the seafloor reflection are high-lighted as grey points. By assuming those points to sample the same uncertainty distribution one can estimate mean and standard deviation for (b) TWTSFand (c) TWT2A. The
num-ber of residuals per bin was normalized to unit area to esti-mate the Gaussian probability distribution(black line).
SEHER ET AL.: LAYER 2A IN THE LUCKY STRIKE SEGMENT B07107 B07107
that seismic layer 2A may be closely linked to the extrusive layer.
[52] A slightly thicker layer 2A underneath the Lucky
Strike volcano compared to the median valley may be caused by recent volcanism in the segment center. Explaining the off‐axis velocity increase as a lithologic effect is difficult, since it requires a change from high‐porosity to low‐porosity pillow lava or a lower number of eruptive diking events. The latter effect could be caused by a magma‐rich period, i.e. a shallower magma chamber and a higher spreading rate. However, no evidence for a dramatic change in spreading rate exists in this region. The spreading rate has been∼2.2 cm/a for the last 7 Ma, which corresponds to an off‐axis distance of ∼77 km [Cannat et al., 1999].
[53] Hypothesis 2 links the layer 2A/2B boundary to an
alteration front in the upper crust. Explaining layer 2A thickness as an alteration boundary requires a second pro-cess creating the porosity in zero age crust (e.g., accretion or extension), which is subsequently altered by hydrothermal circulation. For freshly emplaced basalt all the pore spaces defining the porosity are still open. Thin cracks are then quickly sealed with alteration products near the accretion center [Wilkens et al., 1991; Shaw, 1994] possibly creating a constant thickness layer 2A inside the median valley, while thick cracks remain open. With increasing distance from the accretion center, hydrothermal mineralization gradually fills those larger voids [Shaw, 1994; Carlson, 1998]. As the crust
ages, the porosity limit defining the bottom of layer 2A becomes shallower and layer 2A velocities increase, as cracks below the alteration front are filled by hydrothermal metamorphism.
[54] For the OH‐1 segment Hussenoeder et al. [2002b]
find evidence for off‐axis hydrothermal circulation. First, they observe an off‐axis velocity increase, which they interpret as porosity reduction due to hydrothermal cemen-tation. Second, the models indicate a thinning of the layer 2A/2B transition, which may result from enhanced hydro-thermal mineralization in the zone of mixed dikes and extrusives. Again, both these observations are consistent with the off‐axis velocity increase that we suggest for the Lucky Strike segment.
[55] Interestingly, the abrupt change inDTWTSF−2Aoccurs
at the median valley bounding faults, where the valley floor is uplifted to the ridge shoulders. This may suggest that hydrothermal activity is enhanced when faults become active. The bounding faults may serve as recharge zones for hydrothermal circulation, facilitating secondary mineraliza-tion that may cause a layer 2A porosity decrease and velocity increase.
[56] Hypothesis 3 interprets the bottom of layer 2A as a
porosity threshold defined by the closure of pore spaces by the effect of the confining pressure. As for the alteration front the pore space collapse mechanism requires a second process creating the porosity. The collapse of pore spaces under a certain load explains the constant layer 2A thickness within the median valley. However, this hypothesis also suggests that layer 2A thickness should be similar on all different ridge segments, which is not the case.
[57] Tectonic stretching along large normal faults may
cause a small amount of off‐axis layer 2A thinning. It is more difficult to explain the off‐axis layer 2A velocity increase as effect of a porosity threshold. Decreasing porosity and increasing the velocity requires an increase in confining pressure or a decrease in pore pressure; the shal-lower water depth could cause a slight velocity decrease [Christensen, 1984], but a velocity increase is observed here. However, similarly to the idea of crack closure at depth through a pressure increase, one can imagine that an off‐axis increase in confining pressure may lead to further pore space collapse, a lateral velocity decrease and velocity increase. While the extensional stresses inside the median valley are accommodated by a large number of faults, fractures and fissures, off‐axis strain may be localized along large normal faults. One can imagine an associated change of the stress field and associated confining pressure at the median valley bounding faults, which leads to a porosity decrease and velocity increase with off‐axis distance.
9.
Conclusions
[58] Extensive analysis of seismic reflection data recorded
in the Lucky Strike segment allows new observations about the nature of the layer 2A/2B transition. Inside the median valleyDTWTSF−2Ais 550 ms, which corresponds to a layer
2A thickness∼600 m. We observe a significant difference of
DTWTSF−2A on‐ and off‐axis. DTWTSF−2A decreases by
∼150 ms to 200 ms, which is likely caused by a velocity increase of ∼1 km/s over a distance of ∼20 km from the ridge axis.
Figure 15. Constant layer 2A velocity and constant layer 2A thickness scenarios explaining the observedDTWTSF−2A
decrease. (a) Comparison of the layer 2A thickness for the two scenarios. (b) A constant velocity layer 2A thins with distance from the ridge axis. (c) Constant thickness layer 2A. The velocity increases with distance from the ridge axis. (d) The velocity structure from a coincident wide‐angle seis-mic tomography study [Seher et al., 2010a]. The labels in Figures 15c and 15d mark isovelocity contours.
[59] In our opinion the most likely explanation for the
uniform layer 2A thickness on the ridge axis are magmatic processes, i.e. the lithologic lava/dike boundary. On the ridge flanks we observe extensive faulting coincident with an abrupt change in layer 2A properties, which may indicate that hydrothermal activity is enhanced when the large median bounding faults become active. Away from the ridge axis hydrothermal alteration is the most plausible mechan-isms explaining the off‐axis layer 2A velocity increase.
[60] Acknowledgments. This work was made possible by funding from the EU Marie Curie RTN MOMARNET, the Institut de Physique du Globe de Paris, CNRS/INSU, Ifremer, and the state of Portugal. Crew and captain of the French research vessel N/O L’Atalante helped to make this project a success. Last, this manuscript profited greatly from discus-sions with Javier Escartin, Juan‐Pablo Canales, William Wilcock and Ingo Grevemeyer. We thank the reviewers Suzanne Carbotte and Ingo Grevemeyer for their suggestions that helped us to greatly improve our work. The Generic Mapping Tools, Seismic Unix and Pardigm Focus were used for data proces-sing and visualization.
References
Avedik, F., V. Renard, J. Allenou, and B. Morvan (1993),“Single bubble” air‐gun array for deep exploration, Geophysics, 58(3), 366–382, doi:10.1190/1.1443420.
Avedik, F., V. Hirn, A. Renard, R. Nicolich, J. Olivet, and M. Sachapazi (1996),“Single‐bubble” marine source offers new perspectives for litho-spheric exploration, Tectonophysics, 267, 57–71, doi:10.1016/S0040-1951(96)00112-6.
Barclay, A., D. Toomey, and S. Solomon (1998), Seismic structure and crustal magmatism at the Mid‐Atlantic Ridge, 35°N, J. Geophys. Res., 103(B8), 17,827–17,844, doi:10.1029/98JB01275.
Becker, K., and A. Fisher (2000), Permeability of upper oceanic basement on the eastern flank of the Juan de Fuca ridge determined with drill‐string packer experiments, J. Geophys. Res., 105(B1), 897–912, doi:10.1029/ 1999JB900250.
Becker, K., et al. (1982), In situ electrical resistivity and bulk porosity of the oceanic crust Cost Rica Rift, Nature, 300, 594–598, doi:10.1038/ 300594a0.
Becker, K., E. Davis, F. Spiess, and C. deMoustier (2004), Temperature and video logs from the upper oceanic crust, holes 504B and 896(a), Costa Rica Rift flank: Implications for the permeability of upper oceanic crust, Earth Planet. Sci. Lett., 222, 881–896, doi:10.1016/j. epsl.2004.03.033.
Blacic, T. M., G. Ito, J. P. Canales, R. S. Detrick, and J. Sinton (2004), Constructing the crust along the Galapagos Spreading Center 91.3°– 95.5°W: Correlation of seismic layer 2A with axial magma lens and topo-graphic characteristics, J. Geophys. Res., 109, B10310, doi:10.1029/ 2004JB003066.
Black, J., K. Schleicher, and L. Zhang (1993), True‐amplitude imaging and dip moveout, Geophysics, 58(1), 47–66, doi:10.1190/1.1443351. Boudier, F., A. Nicolas, B. Ildefonseand, and D. Jousselin (1997), EPR
microplates, a model for the Oman ophiolite, Terra Nova, 9, 79–82, doi:10.1111/j.1365-3121.1997.tb00007.x.
Bratt, S., and G. Purdy (1984), Structure and variability of oceanic crust on the flanks of the East Pacific Rise between 11° and 13°N, J. Geophys. Res., 89(B7), 6111–6125, doi:10.1029/JB089iB07p06111.
Buck, W. R., S. M. Carbotte, and C. Mutter (1997), Controls on extrusion at mid‐ocean ridges, Geology, 25(10), 935–938, doi:10.1130/0091-7613 (1997)025<0935:COEAMO>2.3.CO;2.
Buck, W. R., P. Einarsson, and B. Brandsdóttir (2006), Tectonic stress and magma chamber size as controls on dike propagation: Constraints from the 1975–1984 Krafla rifting episode, J. Geophys. Res., 111, B12404, doi:10.1029/2005JB003879.
Canales, J. P., R. Detrick, S. Carbotte, G. Kent, J. Diebold, A. Harding, J. Babcok, M. Nedimović, and E. van Ark (2005), Upper crustal structure and axial topography at intermediate‐spreading ridges: Seismic constraints from the southern Juan de Fuca Ridge, J. Geophys. Res., 110, B12104, doi:10.1029/2005JB003630.
Cannat, M., et al. (1999), Mid‐Atlantic Ridge–Azores hotspot interactions: Along‐axis migration of a hotspot‐derived event of enhanced magmatism
10 to 4 Ma ago, Earth Planet. Sci. Lett., 173, 257–269, doi:10.1016/ S0012-821X(99)00234-4.
Carbotte, S., and D. Scheirer (2004), Variability of ocean crustal struc-ture created along the global mid‐ocean ridge, in Hydrogeology of the Oceanic Lithosphere, edited by E. E. Davis and H. Elderfield, pp. 59– 107, Cambridge Univ. Press, Cambridge, U. K.
Carlson, R. (1998), Seismic velocities in the uppermost oceanic crust: Age dependence and the fate of layer 2A, J. Geophys. Res., 103(B4), 7069– 7077, doi:10.1029/97JB03577.
Carlson, R., and C. Herrick (1990), Densities and porosities in the oceanic crust and their variations with depth and age, J. Geophys. Res., 95(B6), 9153–9170, doi:10.1029/JB095iB06p09153.
Carlson, R., and R. Jacobsen (1994), Comment on“Upper crustal structure as a function of plate age” by Robert Houtz and John Ewing, J. Geophys. Res., 99(B2), 3135–3138, doi:10.1029/93JB03013.
Chapman, N., and D. Hannay (1994), Seismic velocities of upper oceanic crust, Geophys. Res. Lett., 21(21), 2315–2318, doi:10.1029/94GL01690. Christensen, N. (1984), Pore pressure and oceanic crustal seismic structure,
Geophys. J. R. Astron. Soc., 79, 411–423.
Christeson, G., G. Kent, G. Purdy, and R. Detrick (1996), Extrusive thick-ness variability at the East Pacific Rise, 9°–10°N: Constraints from seismic techniques, J. Geophys. Res., 101(B2), 2859–2873, doi:10.1029/ 95JB03212.
Christeson, G., K. McIntosh, and J. Karson (2007), Inconsistent correlation of layer 2A and lava layer thickness in oceanic crust, Nature, 445, 418– 421, doi:10.1038/nature05517.
Collier, J., and S. Singh (1998), Poisson’s ratio structure of young oceanic crust, J. Geophys. Res., 103(B9), 20,981–20,996, doi:10.1029/ 98JB01980.
Combier, V. (2007), Mid‐ocean ridge processes: Insights from 3D reflec-tion seismics at the 9°N OSC on the East Pacific Rise, and the Lucky Strike Volcano on the Mid‐Atlantic Ridge, Ph.D. thesis, Inst. de Phys. du Globe de Paris, Paris.
Cudrak, C., and R. Clowes (1993), Crust structure of Endeavour Ridge Segment, Juan de Fuca Ridge, from a detailed seismic refraction survey, J. Geophys. Res., 98(B4), 6329–6349, doi:10.1029/92JB02860. Day, A., C. Peirce, and M. Sinha (2001), Three‐dimensional crustal structure
and magma chamber geometry at the intermediate‐spreading, back‐arc Valu Fa Ridge, Lau Basin—Results of a wide‐angle seismic tomographic inver-sion, Geophys. J. Int., 146, 31–52, doi:10.1046/j.0956-540x.2001.01446.x. Detrick, R., H. Needham, and V. Renard (1995), Gravity anomalies and crustal thickness variations along the Mid‐Atlantic Ridge between 33° N and 40°N, J. Geophys. Res., 100(B3), 3767–3787, doi:10.1029/ 94JB02649.
Doubre, C., I. Manighetti, C. Dorbath, L. Dorbath, E. Jacques, and J. C. Delmond (2007), Crustal structure and magmato‐tectonic processes in an active rift (Asal‐Ghoubbet, Afar, East Africa): 1. Insights from a 5‐month seismological experiment, J. Geophys. Res., 112, B05405, doi:10.1029/2005JB003940.
Dziak, R., and C. Fox (1999), The January 1998 earthquake swarm at Axial Volcano, Juan de Fuca Ridge: Hydroacoustic evidence of seafloor volca-nic activity, Geophys. Res. Lett., 26(23), 3429–3432, doi:10.1029/ 1999GL002332.
Dziak, R., D. Smith, D. Bohnenstiehl, C. Fox, D. Desbruyeres, H. Matsumoto, M. Tolsoty, and D. Fornari (2004), Evidence of a recent magma dike intru-sion at the slow spreading Lucky Strike segment, Mid‐Atlantic Ridge, J. Geophys. Res., 109, B12102, doi:10.1029/2004JB003141.
Escartín, J., R. García, O. Delaunoy, J. Ferrer, N. Gracias, A. Elibol, X. Cufi, L. N. D. Fornari, S. Humphris, and J. Renard (2008), Globally aligned pho-tomosaic of the Lucky Strike hydrothermal vent field (Mid‐Atlantic Ridge, 37°50′N): Release of georeferenced data, mosaic construction, and view-ing software, Geochem. Geophys. Geosyst., 9, Q12009, doi:10.1029/ 2008GC002204.
Fouquet, Y., H. Ondréas, J.‐L. Charlou, J.‐P. Donval, J. Radford‐Knoery, I. Costa, N. Lourenço, and M. Tivey (1995), Atlantic lava lakes and hot vents, Nature, 377, 201, doi:10.1038/377201a0.
Grevemeyer, I., and A. Bartetzko (2004), Hydrothermal aging of oceanic crust: inferences from seismic refraction and borehole studies, in Hydrogeology of the Oceanic Lithosphere, edited by E. E. Davis and H. Elderfield, pp. 128– 150, Cambridge Univ. Press, Cambridge, U. K.
Grevemeyer, I., and W. Weigel (1997), Increase of seismic velocities in upper oceanic crust: The“superfast” spreading East Pacific Rise, Geo-phys. Res. Lett., 24(3), 217–220, doi:10.1029/96GL04005.
Harding, A., J. Orcutt, M. Kappus, E. Vera, J. Mutter, R. Buhl, R. Detrick, and T. Brocher (1989), Structure of young oceanic crust at 13°N on the East Pacific Rise from expanding spread profile, J. Geophys. Res., 94(B9), 12,163–12,196, doi:10.1029/JB094iB09p12163.
SEHER ET AL.: LAYER 2A IN THE LUCKY STRIKE SEGMENT B07107 B07107