Report
Shp-2 Is Dispensable for Establishing T Cell
Exhaustion and for PD-1 Signaling
In Vivo
Graphical Abstract
Highlights
d
Shp-2 modulates selected T cell exhaustion features
dShp-2 is not required for the global dysfunctional state of
exhausted T cells
d
Anticancer
a-PD-1 treatment is beneficial in mice with
Shp-2-deficient T cells
Authors
Giorgia Rota, Charle`ne Niogret,
Anh Thu Dang, ..., Walter Birchmeier,
Eric Vivier, Greta Guarda
Correspondence
greta.guarda@irb.usi.ch
In Brief
In vitro data indicate that Shp-2 is
engaged by PD-1 and contributes to T cell
exhaustion. Rota et al. show that
Shp-2-deficient T cells acquire a dysfunctional
state when exposed to chronic antigen
in vivo and respond to PD-1 blockade,
indicating the existence of additional
signaling factors.
exhaustion
Shp-2 ? inhibitory receptors polyfunctionality cytokines expansion PD-1 TCRexhaustion
Shp-2 ? polyfunctionality expansioncancer / chronic infection
Shp-2
-/-CD8
+T cell
control CD8
+T cell
Rota et al., 2018, Cell Reports23, 39–49 April 3, 2018ª 2018 The Authors.
Cell Reports
Report
Shp-2 Is Dispensable for Establishing
T Cell Exhaustion and for PD-1 Signaling
In Vivo
Giorgia Rota,1Charle`ne Niogret,1Anh Thu Dang,1Cristina Ramon Barros,1Nicolas Pierre Fonta,1,7Francesca Alfei,2
Leonor Morgado,1Dietmar Zehn,2Walter Birchmeier,3Eric Vivier,4,5,6and Greta Guarda1,7,8,*
1Department of Biochemistry, University of Lausanne, 1066 Epalinges, Switzerland
2Division of Animal Physiology and Immunology, School of Life Sciences Weihenstephan, Technical University of Munich, 85354 Freising,
Germany
3Cancer Research Program, Max Delbrueck Center for Molecular Medicine (MDC) in the Helmholtz Society, 13125 Berlin, Germany 4Centre d’Immunologie de Marseille-Luminy, Aix Marseille Universite´, Inserm, CNRS, 13288 Marseille, France
5Service d’Immunologie, H^opital de la Timone, Assistance Publique-H^opitaux de Marseille, 13005 Marseille, France 6Innate Pharma Research Labs, Innate Pharma, Marseille, France
7Institute for Research in Biomedicine, Universita` della Svizzera italiana, 6500 Bellinzona, Switzerland 8Lead Contact
*Correspondence:greta.guarda@irb.usi.ch https://doi.org/10.1016/j.celrep.2018.03.026
SUMMARY
In chronic infection and cancer, T cells acquire a
dysfunctional state characterized by the expression
of inhibitory receptors.
In vitro studies implicated
the phosphatase Shp-2 downstream of these
recep-tors, including PD-1. However, whether Shp-2 is
responsible
in vivo for such dysfunctional responses
remains elusive. To address this, we generated
T cell-specific Shp-2-deficient mice. These mice did
not show differences in controlling chronic viral
in-fections. In this context, Shp-2-deleted CD8
+T
lym-phocytes expanded moderately better but were
less polyfunctional than control cells. Mice with
Shp-2-deficient T cells also showed no significant
improvement in controlling immunogenic tumors
and responded similarly to controls to
a-PD-1
treat-ment. We therefore showed that Shp-2 is
dispens-able in T cells for globally establishing exhaustion
and for PD-1 signaling
in vivo. These results reveal
the existence of redundant mechanisms
down-stream of inhibitory receptors and represent the
foundation for defining these relevant molecular
events.
INTRODUCTION
Chronic antigen exposure drives T cell exhaustion, a condition in which effector T cells progressively lose the capacity to produce multiple cytokines and proliferate (Pauken and Wherry, 2015). This phenomenon represents an adapted response reducing excessive T cell activation and collateral damage, but it also hampers immunity (Speiser et al., 2014). Exhausted T cells are characterized by the expression of inhibitory receptors, including programmed cell death 1 (PD-1). Blocking signaling by PD-1 and other inhibitory receptors restores T cell responses, effectively promoting disease control in cancer patients (Pauken and
Wherry, 2015; Topalian et al., 2015). These findings reveal the potential of interfering with such inhibitory circuits and the need to understand the underlying molecular pathways.
Cytoplasmic tails of inhibitory receptors bear immunoreceptor tyrosine-based inhibition motifs (ITIMs) and immunoreceptor tyrosine-based switch motifs (ITSMs), which are phosphorylated upon engagement and act as docking sites for SH2 domain-con-taining protein tyrosine phosphatase (Shp)-2 (encoded by the
Ptpn11 gene) and the homologous Shp-1 (Siminovitch and
Neel, 1998; Tajan et al., 2015). These phosphatases contain SH2 domains that interact with phosphotyrosines of receptors or signaling molecules, favoring accessibility of the catalytic site (Cunnick et al., 2001; Ekman et al., 2002; Noguchi et al., 1994; Siminovitch and Neel, 1998). Opposite to Shp-1, which dampens various signaling cascades, Shp-2 is mainly known for positively regulating growth factor or hormone receptor signaling, and its activity has been implicated in several malig-nancies (Chan et al., 2008; Prahallad et al., 2015; Tajan et al., 2015; Zhang et al., 2015).
Although several mouse models expressing a dominant-nega-tive form of or lacking Shp-2 in T cells have been reported (Dong et al., 2015; Liu et al., 2017; Miah et al., 2017; Nguyen et al., 2006; Salmond et al., 2005; Zhang et al., 2013), a consensus on its role in these lymphocytes is missing. Some models showed defec-tive T cell development and/or activation, whereas others ex-hibited normal T cells with unaltered or enhanced responses (Dong et al., 2015; Kwon et al., 2005; Liu et al., 2017; Miah et al., 2017; Nguyen et al., 2006; Salmond et al., 2005). In agree-ment with its known contribution to the mitogen-activated protein kinase (MAPK) pathway in cancerous cells and various tissues, multiple studies observed a positive role for Shp-2 in extracellular signal-regulated kinase (ERK) activation upon T cell receptor (TCR) triggering or interleukin (IL)-2 stimulation (Gadina et al., 1998; Kwon et al., 2005; Nguyen et al., 2006; Salmond et al., 2005).
In relation to T cell exhaustion, in vitro studies showed recruit-ment of Shp-2 to the cytoplasmic portion of PD-1 and other inhibitory receptors (Chemnitz et al., 2004; Hui et al., 2017; Latchman et al., 2001; Lee et al., 1998; Okazaki et al., 2001;
Peled et al., 2018; Sheppard et al., 2004; Yamamoto et al., 2008; Yokosuka et al., 2012). Furthermore, a negative effect of Shp-2 on IL-2 production has been observed upon PD-1 engagement (Peled et al., 2018; Yokosuka et al., 2012). Shp-2 is therefore considered a central molecule for T cell exhaustion and one to target for therapeutic purposes. Yet work addressing its role in the context of chronic antigen exposure in vivo is missing. We therefore generated CD4cre Ptpn11fl/flmice and tested the effect of Shp-2 ablation on T cell responses.
Following chronic viral infection, we found increased percent-ages of antiviral Ptpn11-deficient T cells compared to control mice. However, these cells exhibited compromised cytokine production and were unable to better control the infection. In addition, we subcutaneously engrafted mice with an immuno-genic cancer. Tumor growth in CD4cre Ptpn11fl/flmice was com-parable to what was observed in controls, and these mice re-sponded to a-PD-1 treatment. Therefore, Shp-2 deficiency in T cells does not ameliorate disease outcome and—against the
commonly held view—does not impede PD-1 signaling, urging investigation of alternative molecular players.
RESULTS
CD4cre Ptpn11fl/flMice Present a Normal T Cell
Compartment
First, we characterized the T cell compartment of CD4cre Ptpn11fl/ fl
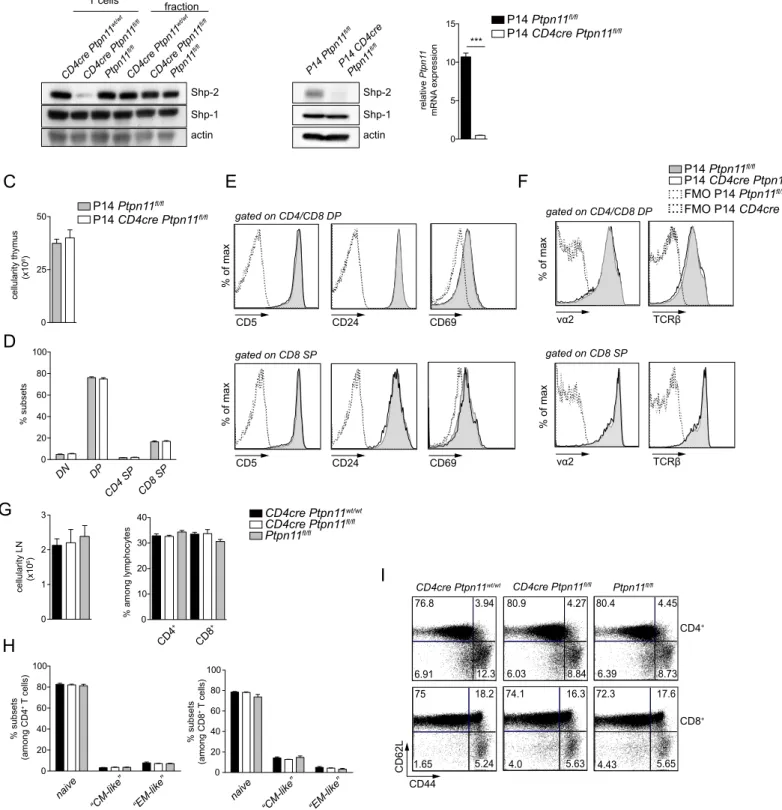
mice as compared to CD4cre Ptpn11wt/wtand Ptpn11fl/flcontrols. As expected, Ptpn11 transcript and protein expression were lack-ing in T cell fractions from CD4cre Ptpn11fl/flmice ex vivo and following in vitro activation (Figures S1A and S1B). Furthermore, expression of Shp-1 was unaltered, underlying the specificity of Shp-2 deletion (Figures S1A and S1B).
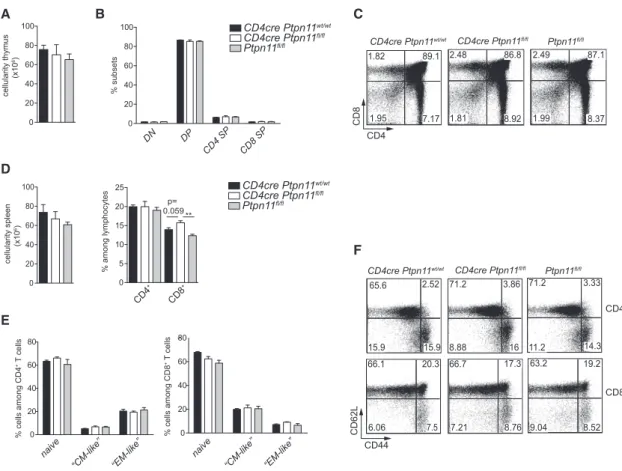
With regard to thymic development, CD4cre Ptpn11fl/flmice did not exhibit differences in thymus cellularity, frequency of CD8 and CD4 double-positive populations, or frequency of single-positive subpopulations (Figures 1A–1C). To exclude that differences in
DN DP CD4 SP CD8 SP A cellularity thymus (x10 6) 0 20 40 60 80 100 0 20 40 60 80 100 7.17 86.8 89.1 87.1 1.82 2.48 2.49 8.92 8.37 1.95 1.81 1.99 CD8 CD4 Ptpn11fl/fl CD4cre Ptpn11fl/fl CD4cre Ptpn11wt/wt C B % subsets CD4cre Ptpn11wt/wt CD4cre Ptpn11fl/fl Ptpn11fl/fl D naive “CM-like” “EM-like” naive “CM-like” “EM-like” cellularity spleen (x10 6) % cells among CD4 + T cells CD4cre Ptpn11wt/wt CD4cre Ptpn11fl/fl Ptpn11fl/fl 0 20 40 60 80 0 20 40 60 80 % cells among CD8 + T cells 0 20 40 60 80 100 CD4 + CD8 + % among lymphocytes 0 5 10 15 20 25 Ptpn11fl/fl CD4cre Ptpn11fl/fl CD4cre Ptpn11wt/wt CD62L CD44 CD4+ CD8+ 65.6 2.52 15.9 15.9 71.2 3.86 71.2 8.88 16 14.3 66.1 20.3 6.06 7.5 66.7 7.21 8.76 17.3 63.2 19.2 9.04 8.52 11.2 F 3.33 E ** p= 0.059
Figure 1. CD4cre Ptpn11fl/flMice Exhibit Normal T Cells
(A–C) Thymus cellularity (A) and percentage of double-negative (DN) thymocytes (CD4 CD8 ), double-positive (DP) thymocytes (CD4+
CD8+
), and CD4 or CD8 single-positive (SP) thymocytes (CD4+
CD8 or CD4 CD8+
, respectively) among lineage-negative lymphocytes (B) are depicted in CD4cre Ptpn11wt/wt , CD4cre
Ptpn11fl/fl
, and Ptpn11fl/fl
mice. (C) Representative flow cytometry plots of CD4 and CD8 expression among lineage-negative thymocytes are illustrated. (A–C) Data are comparable in mice of 6 to 12 weeks.
(D) Spleen cellularity and percentages of CD4+(CD4+CD3+) and CD8+(CD8+CD3+) T cells (gated on lymphocytes) are illustrated. (E and F) Percentages of naive (CD44low-int
CD62Lhigh
), CM-like (CD44high
CD62Lhigh
), and EM-like (CD44high
CD62Llow
) CD4+
and CD8+
T lymphocytes in the spleen (E) and a representative flow cytometry plot of CD62L and CD44 expression (F) are depicted.
Results represent mean± SEM of n = 3–5 mice/group (A, B, D, and E) and are representative of at least two independent experiments (A–F). Only statistically significant differences are shown. **p% 0.01; Student’s t test. See alsoFigure S1.
0 25 50 % CD8 + T cells * * d8 d20 0 20 40 % CD62L lo CD44 hi CD8 + cells * p= 0.062 0 20 40 % PD-1 + CD8 + cells ** p=0.074 0 2 4 6 % gp33 + CD8 + cells % gp276 + CD8 + cells * * ** p=0.058 0 15 30 *** *** 0 2.5 5.0 % CD8 + T cells n° CD8 + cells (x10 6) 0 8 16 0 8 16 0 1.5 3.0 0 1.25 0 2.5 5.0 2.50 0 1 2 0 1 2 0 0.2 0.4 0 0.2 0.4 % PD-1 + CD8 + cells % gp33 + CD8 + cells % gp276 + CD8 + cells CD8 gp33 Ptpn11fl/fl CD4cre Ptpn11fl/fl CD4cre Ptpn11wt/wt d8 d20 d34 7.6 6.84 6.46 8.02 14.8 9.07 5.43 13.9 4.61 4.46 7.9 6.08 5.98 8.4 5.72 2.28 2.64 2.56 d8 d20 d34 Ptpn11fl/fl CD4cre Ptpn11fl/fl CD4cre Ptpn11wt/wt CD8 gp276 A n° CD62L lo CD44 hi CD8 + cells (x10 6) n° gp33 + cells (x10 6) n° gp276 + cells (x10 6 1-D P ° n ) + CD8 + cells (x10 6) B d34 spleen blood D F G *** ** *** *** *** ********* *** *** *** ** * C E % CD62L lo CD44 hi CD8 + cells CD4cre Ptpn11wt/wt CD4cre Ptpn11fl/fl Ptpn11fl/fl **
Figure 2. Percentages ofPtpn11-Deleted CD8+T Cells Are Increased upon Chronic Infection
(A) Graphs illustrate percentages of CD8+
T cells at days 8 and 20 p.i. in the blood and percentages and numbers at day 34 p.i. in the spleen of CD4cre Ptpn11wt/wt ,
CD4cre Ptpn11fl/fl
, or Ptpn11fl/fl mice.
(B and C) Graphs illustrate percentages (among lymphocytes) and numbers of CD44high
CD62Llow
effector (B) or PD-1+
(C) CD8+
T cells. (D and E) Graphs illustrate percentages (among lymphocytes) and numbers of gp33-specific (gp33+
) (D) and gp276-specific (gp276+
) (E) CD8+
T cells.
signaling were compensated for by an altered TCR repertoire, we analyzed thymic development in P14 transgenic mice, which bear a TCR specific for the lymphocytic choriomeningitis virus (LCMV) glycoprotein (gp) 33, and found normal thymic cellularity and fre-quency of thymocyte subsets (Figures S1C and S1D). In addition, we observed unaltered expression of CD5, CD24, and CD69 and of TCR Va2 and b chains on double-positive and CD8 single-pos-itive thymocytes (Figures S1E and S1F). Altogether, these results indicate that T cells from CD4cre Ptpn11fl/flmice undergo normal thymic selection.
We next analyzed the peripheral T cell compartment in both spleen and inguinal lymph node. In the spleen, we observed no major differences in the percentages of CD4+ and CD8+ T cells, besides a mild tendency toward increased CD8+ T cells (Figure 1D). Furthermore, the activation state of T lympho-cytes, as measured by CD44 and CD62L expression, was unaf-fected (Figures 1E and 1F). Similar results were obtained for inguinal lymph nodes (Figures S1G–S1I). Altogether, these data indicate that Shp-2 is dispensable for T cell homeostasis in CD4cre Ptpn11fl/flmice.
Ablation of Shp-2 Increases the Frequency of T Cells Specific for Chronic LCMV
With this premise, we challenged mice with LCMV clone 13, which establishes a chronic infection and is therefore widely used as model to study T cell exhaustion. Percentages of Ptpn11-deficient CD8+T cells were similar to controls early after infection (day 8 post-infection [p.i.]) but increased in the chronic phase of the disease (days 20 and 34 p.i.) (Figure 2A). No consis-tent alterations were observed among CD4+T cells (Figures S2A and S2B).
We next asked whether the increase of CD8+T cell percent-ages in the chronic phase of LCMV infection affected these lym-phocytes globally or a particular subset. As shown inFigure 2B, the CD44high CD62Lloweffector subpopulation, which roughly corresponded to PD-1+ T cells, was augmented in CD4cre Ptpn11fl/fl mice (Figure 2C; Figure S2C). In agreement, CD8+ T cells specific for gp33 and gp276 showed normal expansion early after infection and were more abundant in CD4cre Ptpn11fl/fl mice at later time points, albeit to different extents (Figures 2D–2G). However, CD4cre Ptpn11fl/flmice had spleens of tendentially reduced cellularity following infection (Figure S2D), rendering the numbers of antiviral CD8+ T cells in CD4cre Ptpn11fl/fl mice not increased compared to controls (Figures
2A–2E). T cells bearing only one functional Ptpn11 allele, from CD4cre Ptpn11wt/flmice, behaved comparably to control cells (Figure S2E). Altogether, these data indicate that Ptpn11 deletion favored increased frequencies of antiviral T cells.
Shp-2 Limits the Expansion of Exhausted CD8+T Cells
To gain further insight into the mechanisms leading to increased percentages of Ptpn11-deleted effector CD8+T cells, we took
advantage of P14 transgenic T cells. After adoptive cotransfer of Ptpn11-deficient and control P14 CD8+T cells (Figure 3A), we infected recipient mice with LCMV clone 13. Although per-centages of Ptpn11-deficient and control P14 CD8+ T cells were comparable at day 8 p.i., the former became on average 2.9 times more abundant than the latter during the chronic phase of infection (Figures 3A and 3B). These results proved that accumulation of Ptpn11-deficient CD8+T cells is a cell-intrinsic phenomenon, independent of viral load and thymic output.
The subpopulations of T cells expressing high T-bet and low Eomesodermin levels or the transcription factor Tcf-1 have been shown to renew and sustain the persistent antiviral response (Im et al., 2016; Paley et al., 2012; Utzschneider et al., 2016). However, their frequencies among Ptpn11-deficient P14 CD8+T cells were either unaltered or decreased following chronic infection, while they were high upon acute LCMV infec-tion, irrespectively of the genotype (Figures 3C–3F). These results suggest that the above mechanisms are not responsible for the observed phenotype. We recurrently observed an increased proportion of Ki67+ proliferating cells among Ptpn11-deficient P14 T cells (Figures 3G and 3H), indicating that Shp-2 hampered the proliferative capacity of exhausted T cells.
However, expansion of antiviral Pdcd1-deficient T cells has been reported to be greater and occur with faster kinetics ( Odor-izzi et al., 2015). Underlining the divergence in the roles of PD-1 and Shp-2 in exhausted CD8+T cells, we observed that Pdcd1-deficient P14 CD8+T cells expanded significantly more than their Ptpn11-deficient counterparts 11 days after chronic LCMV infec-tion (Figure S3A).
Shp-2 Sustains Polyfunctional CD8+T Cells in Chronic LCMV Infection
We next asked whether Ptpn11-deficient P14 CD8+T cells from LCMV clone 13-infected mice presented classical exhaustion features. Compared to CD8+T cells exposed to acute infection, they displayed high levels of inhibitory receptors (Figure 4A). However, while the levels PD-1, lymphocyte-activation gene 3 (Lag3), and T cell immunoreceptor with immunoglobulin (Ig) and ITIM domains (Tigit) were comparable to those of control cells, expression of 2B4 was lower (Figure 4A).
Furthermore, we investigated cytokine production. Because Shp-2 has been implicated in TCR and costimulation or coinhibi-tion signaling (Lee et al., 1998), we restimulated Ptpn11-deficient P14 CD8+T cells with a-CD3 or a-CD3/CD28, enabling control of the engagement of these pathways at the synapse. Although we observed normal degranulation (Figures 4B and 4C) and inter-feron gamma (IFN-g) production, IFN-g/tumor necrosis factor alpha (TNF-a) double-producer cells were underrepresented (Figures 4D and 4E). Similar results were observed upon restim-ulation with gp33 peptide (Figures S4A–S4D). Concomitant re-stimulation of P14 T cells from mice infected with acute LCMV
(F and G) Representative flow cytometry plots (gated on CD8+
T cells), as measured in the blood at days 8 and 20 p.i. or in the spleen at day 34 p.i. of gp33-specific (F) or gp276-specific (G) CD8+T cells.
Results represent mean± SEM of n = 6–15 mice/group (A–D) or n = 5–8 mice/group (E) are a pool of two independent experiments and are representative of at least three experiments (A–D and F) or two experiments (E and G). Only differences statistically significant in comparison to both controls are shown. *p% 0.05, **p% 0.01, ***p % 0.001; Student’s t test. See alsoFigure S2.
A C E G H F D B
Figure 3. Ptpn11-Deficient T Cells Are Increased upon Chronic Infection
Wild-type recipient mice were cotransferred with a 1:1 mix of congenically marked control (which, depending on the experiment, is on a CD4cre Ptpn11wt/wt ,
CD4cre Ptpn11wt/fl
, or Ptpn11fl/fl
background) and Ptpn11-deficient (knockout [KO]) (CD4cre Ptpn11fl/fl
background) P14 CD8+
T cells and infected with LCMV clone 13.
(A) Percentages of KO (CD45.1/2) and control (CD45.1) P14 T cells in the initial mix, in the blood at the indicated days, and in the spleen at day 31 p.i. are shown as representative flow cytometry plots (gated on CD8+CD45.1+T cells).
(B) Graph depicts the ratio, normalized to the initial mix, of KO over control P14 T cells at days 7–10 and 31–35 and represents mean± SEM of the average value of five independent experiments.
(C–F) Representative flow cytometry plots and graphs depict the percentage of T-bet-high and Eomesodermin-low (T-bethi
Eomeslow
) (C and D) and of Tcf-1 positive (Tcf-1+
) (E and F) KO and control P14 T cells 29 days after infection with LCMV clone 13 or Armstrong.
further evidenced the dysfunctional state of cells from LCMV clone 13-infected animals (Figures S4C and S4D).
Because IL-2 production severely declines upon chronic infection, we tested it following gp33 restimulation at 9 and 29 days p.i. Both control and Ptpn11-deficient CD8+T cells from chronically infected mice produced little IL-2, with the latter synthetizing tendentially lower amounts (Figures 4F and 4G). Altogether, Shp-2-deficient T cells exhibited severe dysfunc-tional features.
To outline the overall effect of Shp-2 deletion in T cells, we measured viral titers longitudinally in serum and at day 34 p.i. in the kidney of CD4cre Ptpn11fl/fland control mice. At all tested time points, we observed comparable virus levels in mice of the different genotypes (Figures S4E and S4F), indicating that the ef-fects of Ptpn11 deficiency in T cells are not sufficient to substan-tially alter viral control.
CD4cre Ptpn11fl/flMice Show Normal Anticancer Responses and Therapeutic Effects by PD-1 Blockade
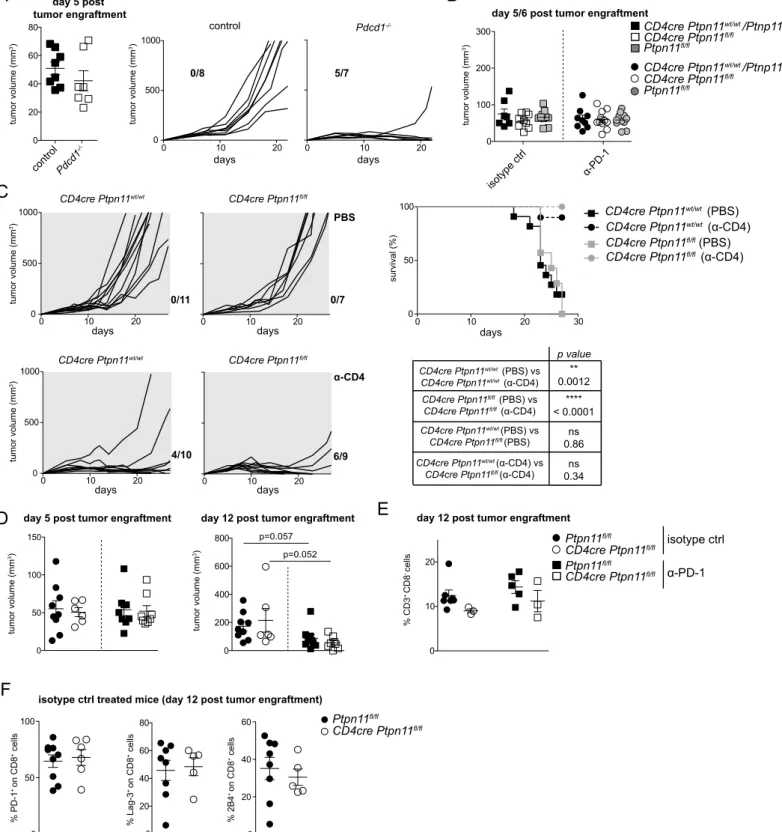
Because the antitumoral T cell response is characterized by exhaustion and its modulation is highly relevant for immuno-therapy, we investigated the role of Shp-2 in T cells and the combination with a-PD-1 treatment in this context. We chose the immunogenic MC38 adenocarcinoma, which is robustly controlled in Pdcd1-deficient mice (Figure S5A) (Juneja et al., 2017). We subcutaneously engrafted CD4cre Ptpn11fl/fl and control mice with tumor cells. When the tumor was palpable, mice were divided into two groups; one was then injected three times with a-PD-1 antibody, and the other received three injec-tions of isotype control. CD4cre Ptpn11fl/fl and control mice presented comparable tumor volumes at this stage ( Fig-ure S5B). After 30 days, all isotype-treated mice developed large lesions (Figure 5A). To further assess whether alterations in CD4+T cells indirectly modulated CD8+T cell anticancer ac-tivity in CD4cre Ptpn11fl/fl mice, we depleted them. This hin-dered tumor growth in both control and CD4cre Ptpn11fl/fl mice (Figure S5C) (Yu et al., 2005), indicating that antitumoral CD8+T cell responses were not inherently different. We thus tested the effects of a-PD-1 treatment. This improved tumor control and mouse survival irrespective of the genotype analyzed, in some cases leading to complete remission (Figures 5B and 5C).
To evaluate whether a-PD-1 treatment exerted the expected effects on intratumoral CD8+ T cells, we examined mice 12 days after engraftment, when therapy started to show effi-cacy but before numerous tumors were eradicated (Figure S5D). With respect to isotype-treated mice, we detected no substantial differences linked to Ptpn11 deletion in the frequency of tumor-infiltrating T lymphocytes (Figures 5D;Figure S5E). Furthermore, the proportions of IFN-g+, PD-1+, 2B4+, and Lag3+among infil-trating CD8+T cells were comparable in CD4cre Ptpn11fl/fland control mice (Figure 5E;Figure S5F).
a-PD-1 treatment increased the percentages of total and IFN-g-expressing intratumoral CD8+
T cells in both CD4cre Ptpn11fl/fl and control mice but reached significance only in the former (Figures 5D and 5E). The efficacy of PD-1 blockade in CD4cre Ptpn11fl/fl mice revealed that Shp-2 is dispensable for PD-1 signaling in exhausted T cells, indicating that additional players are engaged.
DISCUSSION
Here we addressed the relevance of Shp-2 in exhausted T cells by studying CD4cre Ptpn11fl/flmice. In agreement with published studies, we observed that T cells are normal in the absence of Shp-2 (Dong et al., 2015; Liu et al., 2017), rendering these mice suitable for further analyses.
Cotransfer experiments of control and Ptpn11-deficient T cells into wild-type mice uncovered enhanced expansion of the latter following chronic viral infection. In agreement, CD4cre Ptpn11fl/fl mice exhibited increased percentages of virus-specific cytotoxic T cells compared to their control counterparts but no reduction in viral titers. This could be explained by the observation that antiviral T cells were not numerically augmented and exhibited an altered clonal representation, as indicated by the exaggerate proportion of gp33-specific T cells late in the infection. More-over, we measured decreased frequency of polyfunctional Ptpn11-deficient T cells, which are important for viral control.
Along these lines, our results suggested no or a rather positive role for Shp-2 on IL-2 production in the late phase of the infec-tion. However, in vitro experiments showed that secretion of this cytokine was suppressed by Shp-2 upon concomitant TCR and PD-1 engagement (Peled et al., 2018; Yokosuka et al., 2012). One limitation of in vivo approaches is that these do not enable dissecting the effects of Shp-2 and the pathways in which it operates with the same temporal and molecular accu-racy as in in vitro settings. However, they answer the central question on the role of this phosphatase in exhausted T cells. In clinically relevant contexts, we thus showed that Shp-2 does not substantially control T cell exhaustion.
The characteristics of Ptpn11-deficient T cells differ from those of PD-1 deletion. T cells lacking PD-1 present massive proliferation early after LCMV clone 13 infection, causing exces-sive immunopathology and mortality of infected mice (Barber et al., 2006; Frebel et al., 2012; Odorizzi et al., 2015); this was not the case for Ptpn11-deficient T cells. Furthermore, whereas Pdcd1-deficient mice effectively control the immunogenic tu-mors MC38 and B16, CD4cre Ptpn11fl/flmice succumbed with the same kinetics as wild-type controls (Juneja et al., 2017; Woo et al., 2012; Zhang et al., 2013).
Because the role of Shp-2 in regulating PD-1 signaling might have been confounded by additional pathways involving this phosphatase, we tested the response of CD4cre Ptpn11fl/fl mice to PD-1 blockade. The effects of a-PD-1 treatment were
(G and H) A histogram illustrates Ki67 staining of splenic KO and control P14 T cells at day 31 p.i. (G) and a quantification thereof (H).
Data illustrate mean± SEM of n = 3 mice/group (Armstrong) (D), and n = 6 mice/group (clone 13) (F), and n = 7 mice/group (H). Results are representative of at least three (A), two (C–F), and three out of five (G and H) independent experiments. Only statistically significant differences are shown. *p% 0.05, **p % 0.01; paired Student’s t test (B) and Student’s t test (D, F, and H). See alsoFigure S3.
A B D F G E C
Figure 4. Ptpn11-Deficient T Cells Are Dysfunctional upon Chronic Infection
Wild-type recipient mice were cotransferred with a 1:1 mix of congenically marked control and Ptpn11-deficient P14 CD8+
T cells and infected with LCMV clone 13.
(A) Graphs depict the geometric mean fluorescence intensity (MFI) of PD-1, Lag3, 2B4, and Tigit on control and Ptpn11-deficient P14 CD8+
T cells 29 days following infection with LCMV clone 13 or Armstrong.
(B–E) Splenocytes isolated from infected mice at day 31 p.i. were restimulated with a-CD3 or a-CD3/CD28 and stained for CD107a (B and C), IFN-g, and TNF-a (D and E). Graphs illustrate frequencies of CD107a+
(B), IFN-g+
, and TNFa+
among IFN-g+
(D) Ptpn11-deficient and control P14 T cells, and representative flow cytometry pictures are shown (C and E).
(F and G) Splenocytes from mice infected with LCMV clone 13 or Armstrong at day 9 or 29 p.i. were restimulated with gp33 peptide and stained for IL-2. Graphs illustrate frequencies of IL-2+Ptpn11-deficient and control P14 T cells (F), and representative flow cytometry pictures are shown (G).
Results depict mean± SEM of n = 3 (Armstrong) and n = 6 (clone 13) mice/group (A and F), n = 6 or 7 mice/group (B and D) and are representative of at least two independent experiments (A–G). Only statistically significant differences are shown. **p% 0.01; Student’s t test (A, B, D, and F). See alsoFigure S4.
CD4cre Ptpn11wt/wt or Ptpn11wt/fl CD4cre Ptpn11fl/fl Ptpn11fl/fl A B isotype ctrl -PD-1 survival (%) C 1 0 0 0 . 0 < = p 2 0 0 0 . 0 = p p=0.0016 0 10 20 30 0 500 1000 0 10 20 30 0 0 10 20 30 0 500 1000 0 10 20 30 0 isotype ctrl -PD-1 0 10 20 30 0 0 10 20 30 0 tumor volume (mm 3 m m( e m ul o v r o m ut ) 3) 0 1 / 0 9 / 0 0/9 1 1 / 2 1 1 / 4 9 / 3 s y a d s y a d s y a d s y a d s y a d s y a d s y a d s y a d 0 10 20 30 0 50 100 0 10 20 30 0 50 100 days 0 10 20 30 0 50 100 CD4cre Ptpn11wt/wt or Ptpn11wt/fl CD4cre Ptpn11fl/fl Ptpn11fl/fl CD4cre Ptpn11wt/wt or Ptpn11wt/fl CD4cre Ptpn11fl/fl Ptpn11fl/fl 0 25 50 isotype ctrl % CD8 + cells * day 12 0 20 40 60 isotype ctrl * % IFN-+ CD8 + cells p= 0.072 E D day 12 Ptpn11fl/fl CD4cre Ptpn11fl/fl Ptpn11fl/fl CD4cre Ptpn11fl/fl
Figure 5. CD4cre Ptpn11fl/flMice Respond toa-PD-1 Treatment
(A–C) Mice of the indicated genotypes were s.c. inoculated with MC38 cells. (A and B) Tumor growth in individual mice is shown; (A) depicts mice receiving isotype control injections, while (B) shows mice treated with a-PD-1 antibody. The number of mice eradicating the tumor is indicated within the graphs. (C) Survival curves from mice treated as in (A) and (B).
appreciable, demonstrating that Shp-2 in T cells is dispensable for PD-1-mediated signaling. Our results are in agreement with previous in vitro work showing that T cells expressing a domi-nant-negative form of Shp-2 responded to PD-1 engagement (Salmond et al., 2005). Given the compelling evidence for Shp-2 recruitment to PD-1 (Chemnitz et al., 2004; Hui et al., 2017; Latchman et al., 2001; Lee et al., 1998; Okazaki et al., 2001; Peled et al., 2018; Sheppard et al., 2004; Yamamoto et al., 2008; Yokosuka et al., 2012), we propose that redundant mechanisms mediate this inhibitory signaling. The cytoplasmic tail of PD-1 is dephosphorylated by Shp-2 as part of a feedback loop (Hui et al., 2017; Yokosuka et al., 2012). This suggests accumulation of phosphorylated PD-1 and recruitment of other phosphatases to be enhanced in the absence of Shp-2.
The development of Shp-2 inhibitors is key to improve the clinical management of several malignancies (Chen et al., 2016; Lan et al., 2015). Together with the expanding use of immunotherapeutic approaches, we felt that a deeper under-standing of the role of Shp-2 in T cell exhaustion was essential. While we showed that Shp-2 deletion in T cells failed to provide an advantage in controlling growth of immunogenic tumors, this did not hinder the therapeutic effects of PD-1 blockade, support-ing the prospect of combination therapies.
Despite the increasing use of inhibitory receptor blocking antibodies in patients, our findings highlight how the engaged signaling pathways remain poorly understood. We demonstrate that Shp-2 is dispensable for imprinting the global dysfunctional state of T cells in vivo. Our results are relevant for translational research and encourage further investigations that will uncover novel targets for anticancer therapies.
EXPERIMENTAL PROCEDURES
Additional information on the experimental procedures used is included in the
Supplemental Information.
Mice
Ptpn11fl/fl
mice (Grossmann et al., 2009) were on a mixed C57BL/6 background and crossed at least six additional times on C57BL/6 in the animal facility of the University of Lausanne. CD4cre deleter strain was from Jackson Laboratory. Ptpn11fl/fl
control mice were littermates of CD4cre
Ptpn11fl/fl
mice. CD45.1+
P14ab mice (Pircher et al., 1990) on a C57BL/6 background were crossed onto CD4cre Ptpn11fl/fl
and onto a Pdcd1-deficient background (Nishimura et al., 1998) in the animal facility of the University of Lausanne. Unless otherwise specified, male and female 6- to 12-week-old mice were used in different experiments with appropriate sex-and age-matched controls.
LCMV Infection
LCMV clone 13 and Armstrong strain were propagated as previously described (Ludigs et al., 2016). Frozen stocks were diluted in PBS; 23 106
pla-que-forming units of LCMV (clone 13) were injected intravenously or 23 105
plaque-forming units (Armstrong) were injected intraperitoneally. Transgenic P14 CD8+
T cells were isolated with a-CD8a magnetic beads (Miltenyi Biotec). Unless otherwise specified, 23 103
–43 103
control and an equal number of
CD4cre Ptpn11fl/fl
P14 CD8+
T cells were intravenously cotransferred into naive C57BL/6 mice, which were infected on the same day. Viral titer analysis was performed as previously described (Ludigs et al., 2016).
Engrafted Tumors
The colon adenocarcinoma cell line MC38 was grown in monolayer in DMEM supplemented with 10% fetal calf serum (FCS), 100 U/mL of penicillin, and 100 mg/mL of streptomycin. Tumor cells were harvested with 0.05% trypsin, washed, and resuspended in PBS for injection. 53 105
tumor cells were injected subcutaneously (s.c.) in the flank. Tumor volume was calculated using the for-mula V = (L3 l2
)/2, where L is the widest diameter and l is the smallest diameter. Animals were sacrificed when tumor volume reached 1,000 mm3
. Depending on the experiment, starting 5–7 days post-tumor engraftment, when tumors were palpable, mice were treated intraperitoneally with a-PD-1 (RMP1–RMP14, BioXcell) or isotype control (2A3, BioXcell). The treatment was repeated two times at an interval of 3–4 days for a total of three injections of 200 mg/mouse.
Statistical Analysis
Statistical analyses were performed using Prism software (GraphPad v.5.0). Student’s t test (unpaired, two-tailed) was used to compare differences between experimental groups. Differences were considered significant when *p < 0.05, very significant when **p < 0.01, and highly significant when ***p < 0.001. For survival, comparisons are by log-rank (Mantel-Cox) test.
Study Approval
Mouse studies were approved by the Veterinary Office regulations of the State of Vaud, Switzerland.
SUPPLEMENTAL INFORMATION
Supplemental Information includes Supplemental Experimental Procedures and five figures and can be found with this article online athttps://doi.org/
10.1016/j.celrep.2018.03.026.
ACKNOWLEDGMENTS
We thank T. Honjo, Kyoto University, Kyoto; O. Demaria, Innate Pharma, Marseille; O. Donze´, Adipogen, Lausanne; P.C. Ho, W. Held, M. Charmoy, and A. Wilson, Ludwig Center for Cancer Research, Lausanne; and K. Scha¨u-ble and S. Luther, University of Lausanne, for reagents and advice. Studies in the group of G.G. are funded by the Swiss National Science Foundation (PP00P3_139094 and PP00P3_165833) and the European Research Council (ERC) (StG310890). The D.Z. lab is supported by the ERC (337043-ProtecTC). The E.V. lab is supported by the ERC (694502) under the European Union’s Ho-rizon 2020 research and innovation program, Agence Nationale de la Re-cherche, Innate Pharma, MSDAvenir, Ligue Nationale contre le Cancer (Equipe labelise´e ‘‘La Ligue’’), and Marseille-Immunopole.
AUTHOR CONTRIBUTIONS
G.R., C.N., A.T.D., C.R.B., N.P.F., and L.M. performed the experiments; F.A., D.Z., W.B., and E.V. shared protocols, reagents, and advice; and G.R. and G.G. designed the research, analyzed the data, and wrote the manuscript.
(D and E) 12 days following MC38 tumor inoculation and the day after the third injection of a-PD-1 antibody or isotype control, mice were sacrificed and tumor-infiltrating T cells were analyzed. Graphs depict percentages of CD8+
(CD8+
CD3+
) (D) and CD8+
IFN-g-producing (E) infiltrating T cells among hematopoietic cells.
Results depict n = 9–11 mice/group (A and B), n = 16–19 mice/group (C), and are a pool of two (A and B) or four experiments (C). For survival, comparisons are by log-rank (Mantel-Cox) test; isotype-treated CD4cre Ptpn11fl/fland CD4cre Ptpn11wt/wtorwt/flmice, p = 0.2511; isotype-treated CD4cre Ptpn11fl/fland Ptpn11fl/fl mice, p = 0.0205; a-PD-1-treated CD4cre Ptpn11fl/fl
and CD4cre Ptpn11wt/wt orwt/fl
mice, p = 0.7975; a-PD-1-treated CD4cre Ptpn11fl/fl
and Ptpn11fl/fl mice, p = 0.2975. (D and E) Results depict mean± SEM of n = 6-9 mice/group and are a pool of two experiments. Only statistically significant differences are shown. *p % 0.05; Student’s t test. See alsoFigure S5.
DECLARATION OF INTERESTS
E.V. is a cofounder, shareholder, and employee of Innate Pharma. The other authors declare no competing interests.
Received: July 20, 2017 Revised: January 15, 2018 Accepted: March 7, 2018 Published: April 3, 2018
REFERENCES
Barber, D.L., Wherry, E.J., Masopust, D., Zhu, B., Allison, J.P., Sharpe, A.H., Freeman, G.J., and Ahmed, R. (2006). Restoring function in exhausted CD8
T cells during chronic viral infection. Nature 439, 682–687.
Chan, G., Kalaitzidis, D., and Neel, B.G. (2008). The tyrosine phosphatase
Shp2 (PTPN11) in cancer. Cancer Metastasis Rev. 27, 179–192.
Chemnitz, J.M., Parry, R.V., Nichols, K.E., June, C.H., and Riley, J.L. (2004). SHP-1 and SHP-2 associate with immunoreceptor tyrosine-based switch motif of programmed death 1 upon primary human T cell stimulation, but
only receptor ligation prevents T cell activation. J. Immunol. 173, 945–954.
Chen, Y.P., LaMarche, M.J., Chan, H.M., Fekkes, P., Garcia-Fortanet, J., Acker, M.G., Antonakos, B., Chen, C.H., Chen, Z., Cooke, V.G., et al. (2016). Allosteric inhibition of SHP2 phosphatase inhibits cancers driven by receptor
tyrosine kinases. Nature 535, 148–152.
Cunnick, J.M., Mei, L., Doupnik, C.A., and Wu, J. (2001). Phosphotyrosines 627 and 659 of Gab1 constitute a bisphosphoryl tyrosine-based activation motif (BTAM) conferring binding and activation of SHP2. J. Biol. Chem. 276,
24380–24387.
Dong, B., Gao, Y., Zheng, X., Gao, G., Gu, H., Chen, X., and Zhang, J. (2015). T cell activation is reduced by the catalytically inactive form of protein tyrosine
phosphatase SHP-2. Int. J. Clin. Exp. Med. 8, 6568–6577.
Ekman, S., Kallin, A., Engstrom, U., Heldin, C.H., and Ronnstrand, L. (2002). SHP-2 is involved in heterodimer specific loss of phosphorylation of Tyr771
in the PDGF beta-receptor. Oncogene 21, 1870–1875.
Frebel, H., Nindl, V., Schuepbach, R.A., Braunschweiler, T., Richter, K., Vogel, J., Wagner, C.A., Loffing-Cueni, D., Kurrer, M., Ludewig, B., et al. (2012). Programmed death 1 protects from fatal circulatory failure during systemic
virus infection of mice. J. Exp. Med. 209, 2485–2499.
Gadina, M., Stancato, L.M., Bacon, C.M., Larner, A.C., and O’Shea, J.J. (1998). Involvement of SHP-2 in multiple aspects of IL-2 signaling: evidence
for a positive regulatory role. J. Immunol. 160, 4657–4661.
Grossmann, K.S., Wende, H., Paul, F.E., Cheret, C., Garratt, A.N., Zurborg, S., Feinberg, K., Besser, D., Schulz, H., Peles, E., et al. (2009). The tyrosine phosphatase Shp2 (PTPN11) directs Neuregulin-1/ErbB signaling throughout
Schwann cell development. Proc. Natl. Acad. Sci. USA 106, 16704–16709.
Hui, E., Cheung, J., Zhu, J., Su, X., Taylor, M.J., Wallweber, H.A., Sasmal, D.K., Huang, J., Kim, J.M., Mellman, I., et al. (2017). T cell costimulatory receptor CD28 is a primary target for PD-1-mediated inhibition. Science 355, 1428–
1433.
Im, S.J., Hashimoto, M., Gerner, M.Y., Lee, J., Kissick, H.T., Burger, M.C., Shan, Q., Hale, J.S., Lee, J., Nasti, T.H., et al. (2016). Defining CD8+ T cells
that provide the proliferative burst after PD-1 therapy. Nature 537, 417–421.
Juneja, V.R., McGuire, K.A., Manguso, R.T., LaFleur, M.W., Collins, N., Haining, W.N., Freeman, G.J., and Sharpe, A.H. (2017). PD-L1 on tumor cells is sufficient for immune evasion in immunogenic tumors and inhibits CD8 T cell
cytotoxicity. J. Exp. Med. 214, 895–904.
Kwon, J., Qu, C.K., Maeng, J.S., Falahati, R., Lee, C., and Williams, M.S. (2005). Receptor-stimulated oxidation of SHP-2 promotes T-cell adhesion
through SLP-76-ADAP. EMBO J. 24, 2331–2341.
Lan, L., Holland, J.D., Qi, J., Grosskopf, S., Rademann, J., Vogel, R., Gyorffy, B., Wulf-Goldenberg, A., and Birchmeier, W. (2015). Shp2 signaling sup-presses senescence in PyMT-induced mammary gland cancer in mice.
EMBO J. 34, 1493–1508.
Latchman, Y., Wood, C.R., Chernova, T., Chaudhary, D., Borde, M., Chernova, I., Iwai, Y., Long, A.J., Brown, J.A., Nunes, R., et al. (2001). PD-L2 is a second
ligand for PD-1 and inhibits T cell activation. Nat. Immunol. 2, 261–268.
Lee, K.M., Chuang, E., Griffin, M., Khattri, R., Hong, D.K., Zhang, W., Straus, D., Samelson, L.E., Thompson, C.B., and Bluestone, J.A. (1998). Molecular
basis of T cell inactivation by CTLA-4. Science 282, 2263–2266.
Liu, W., Guo, W., Shen, L., Chen, Z., Luo, Q., Luo, X., Feng, G., Shu, Y., Gu, Y., Xu, Q., et al. (2017). T lymphocyte SHP2-deficiency triggers anti-tumor
immu-nity to inhibit colitis-associated cancer in mice. Oncotarget 8, 7586–7597.
Ludigs, K., Jandus, C., Utzschneider, D.T., Staehli, F., Bessoles, S., Dang, A.T., Rota, G., Castro, W., Zehn, D., Vivier, E., et al. (2016). NLRC5 shields T lymphocytes from NK-cell-mediated elimination under inflammatory
condi-tions. Nat. Commun. 7, 10554.
Miah, S.M.S., Jayasuriya, C.T., Salter, A.I., Reilly, E.C., Fugere, C., Yang, W., Chen, Q., and Brossay, L. (2017). Ptpn11 deletion in CD4+ cells does not affect T cell development and functions but causes cartilage tumors in a T
cell-inde-pendent manner. Front. Immunol. 8, 1326.
Nguyen, T.V., Ke, Y., Zhang, E.E., and Feng, G.S. (2006). Conditional deletion of Shp2 tyrosine phosphatase in thymocytes suppresses both pre-TCR and
TCR signals. J. Immunol. 177, 5990–5996.
Nishimura, H., Minato, N., Nakano, T., and Honjo, T. (1998). Immunological studies on PD-1 deficient mice: implications of PD-1 as a negative regulator
for B cell responses. Int. Immunol. 10, 1563–1572.
Noguchi, T., Matozaki, T., Horita, K., Fujioka, Y., and Kasuga, M. (1994). Role of SH-PTP2, a protein-tyrosine phosphatase with Src homology 2 domains,
in insulin-stimulated Ras activation. Mol. Cell. Biol. 14, 6674–6682.
Odorizzi, P.M., Pauken, K.E., Paley, M.A., Sharpe, A., and Wherry, E.J. (2015). Genetic absence of PD-1 promotes accumulation of terminally differentiated
exhausted CD8+ T cells. J. Exp. Med. 212, 1125–1137.
Okazaki, T., Maeda, A., Nishimura, H., Kurosaki, T., and Honjo, T. (2001). PD-1 immunoreceptor inhibits B cell receptor-mediated signaling by recruiting src homology 2-domain-containing tyrosine phosphatase 2 to phosphotyrosine.
Proc. Natl. Acad. Sci. USA 98, 13866–13871.
Paley, M.A., Kroy, D.C., Odorizzi, P.M., Johnnidis, J.B., Dolfi, D.V., Barnett, B.E., Bikoff, E.K., Robertson, E.J., Lauer, G.M., Reiner, S.L., et al. (2012). Progenitor and terminal subsets of CD8+ T cells cooperate to contain chronic
viral infection. Science 338, 1220–1225.
Pauken, K.E., and Wherry, E.J. (2015). Overcoming T cell exhaustion in
infec-tion and cancer. Trends Immunol. 36, 265–276.
Peled, M., Tocheva, A.S., Sandigursky, S., Nayak, S., Philips, E.A., Nichols, K.E., Strazza, M., Azoulay-Alfaguter, I., Askenazi, M., Neel, B.G., et al. (2018). Affinity purification mass spectrometry analysis of PD-1 uncovers SAP as a new checkpoint inhibitor. Proc. Natl. Acad. Sci. USA. 115, E468–
E477.
Pircher, H., Moskophidis, D., Rohrer, U., B€urki, K., Hengartner, H., and Zinker-nagel, R.M. (1990). Viral escape by selection of cytotoxic T cell-resistant virus
variants in vivo. Nature 346, 629–633.
Prahallad, A., Heynen, G.J., Germano, G., Willems, S.M., Evers, B., Vecchione, L., Gambino, V., Lieftink, C., Beijersbergen, R.L., Di Nicolantonio, F., et al. (2015). PTPN11 is a central node in intrinsic and acquired resistance to
tar-geted cancer drugs. Cell Rep. 12, 1978–1985.
Salmond, R.J., Huyer, G., Kotsoni, A., Clements, L., and Alexander, D.R. (2005). The src homology 2 domain-containing tyrosine phosphatase 2 regu-lates primary T-dependent immune responses and Th cell differentiation.
J. Immunol. 175, 6498–6508.
Sheppard, K.A., Fitz, L.J., Lee, J.M., Benander, C., George, J.A., Wooters, J., Qiu, Y., Jussif, J.M., Carter, L.L., Wood, C.R., et al. (2004). PD-1 inhibits T-cell receptor induced phosphorylation of the ZAP70/CD3zeta signalosome and
downstream signaling to PKCtheta. FEBS Lett. 574, 37–41.
Siminovitch, K.A., and Neel, B.G. (1998). Regulation of B cell signal transduc-tion by SH2-containing protein-tyrosine phosphatases. Semin. Immunol. 10,
Speiser, D.E., Utzschneider, D.T., Oberle, S.G., Munz, C., Romero, P., and Zehn, D. (2014). T cell differentiation in chronic infection and cancer: functional
adaptation or exhaustion? Nat. Rev. Immunol. 14, 768–774.
Tajan, M., de Rocca Serra, A., Valet, P., Edouard, T., and Yart, A. (2015). SHP2
sails from physiology to pathology. Eur. J. Med. Genet. 58, 509–525.
Topalian, S.L., Drake, C.G., and Pardoll, D.M. (2015). Immune checkpoint blockade: a common denominator approach to cancer therapy. Cancer Cell 27, 450–461.
Utzschneider, D.T., Charmoy, M., Chennupati, V., Pousse, L., Ferreira, D.P., Calderon-Copete, S., Danilo, M., Alfei, F., Hofmann, M., Wieland, D., et al. (2016). T cell factor 1-expressing memory-like CD8(+) T cells sustain the
im-mune response to chronic viral infections. Immunity 45, 415–427.
Woo, S.R., Turnis, M.E., Goldberg, M.V., Bankoti, J., Selby, M., Nirschl, C.J., Bettini, M.L., Gravano, D.M., Vogel, P., Liu, C.L., et al. (2012). Immune inhibi-tory molecules LAG-3 and PD-1 synergistically regulate T-cell function to
pro-mote tumoral immune escape. Cancer Res. 72, 917–927.
Yamamoto, R., Nishikori, M., Kitawaki, T., Sakai, T., Hishizawa, M., Tashima, M., Kondo, T., Ohmori, K., Kurata, M., Hayashi, T., et al. (2008). PD-1-PD-1 ligand interaction contributes to immunosuppressive microenvironment of
Hodgkin lymphoma. Blood 111, 3220–3224.
Yokosuka, T., Takamatsu, M., Kobayashi-Imanishi, W., Hashimoto-Tane, A., Azuma, M., and Saito, T. (2012). Programmed cell death 1 forms negative costimulatory microclusters that directly inhibit T cell receptor signaling by
recruiting phosphatase SHP2. J. Exp. Med. 209, 1201–1217.
Yu, P., Lee, Y., Liu, W., Krausz, T., Chong, A., Schreiber, H., and Fu, Y.X. (2005). Intratumor depletion of CD4+ cells unmasks tumor immunogenicity
leading to the rejection of late-stage tumors. J. Exp. Med. 201, 779–791.
Zhang, T., Guo, W., Yang, Y., Liu, W., Guo, L., Gu, Y., Shu, Y., Wang, L., Wu, X., Hua, Z., et al. (2013). Loss of SHP-2 activity in CD4+ T cells promotes
mela-noma progression and metastasis. Sci. Rep. 3, 2845.
Zhang, J., Zhang, F., and Niu, R. (2015). Functions of Shp2 in cancer. J. Cell.
Cell Reports, Volume
23
Supplemental Information
Shp-2 Is Dispensable for Establishing
T Cell Exhaustion and for PD-1 Signaling
In Vivo
Giorgia Rota, Charlène Niogret, Anh Thu Dang, Cristina Ramon Barros, Nicolas Pierre
Fonta, Francesca Alfei, Leonor Morgado, Dietmar Zehn, Walter Birchmeier, Eric
Vivier, and Greta Guarda
B
CD4cre Ptpn1 1wt/wt CD4cre Ptpn1 1fl/fl Ptpn1 1fl/fl CD4cre Ptpn1 1wt/wt CD4cre Ptpn1 1fl/fl Ptpn1 1fl/flT cells T cell negative fraction
actin Shp-1 Shp-2
A
actin Shp-1 Shp-2 P14 CD4cre Ptpn1 1fl/fl P14 Ptpn1 1fl/flex vivo in vitro culture
P14 Ptpn11fl/fl P14 CD4cre Ptpn11fl/fl 0 5 10 15 relative Ptpn1 1 mRNA expression ***
Figure S1. Shp-2 is deleted in T cells and CD4cre Ptpn11
fl/flmice show normal T cell selection and peripheral homeostasis .
Related to Figure 1. A) Total T cells were enriched from spleens of CD4cre Ptpn11
wt/wt, CD4cre Ptpn11
fl/fland Ptpn11
fl/flmice. The
remaining fraction is indicated as T cell-negative. Expression of Shp-2 or Shp-1 was tested by immunoblot in cell lysates from the
indicated subsets, actin used as loading control. T cell purity was over 90%, whereas T cell contamination in T cell-depleted
spenocytes less than 5%. B) CD8
+T cells were enriched from spleens of P14 transgenic CD4cre Ptpn11
fl/fland Ptpn11
fl/flmice, with a
purity of over 97%. Cell were activated with plastic-bound α-CD3 and α-CD28 (1μg/ml each, in the presence of 10 ng/ml IL-2) for 48
hours and cultured for additional 48 hours (in the presence of 20 ng/ml IL-2). Cells were then collected and expression of Shp-2 or
Shp-1 was tested by immunoblot (left panel) and abundance of Ptpn11 mRNA determined by quantitative RT-PCR (relative to Polr2a;
right panel). Quantitative RT-PCR data represent mean ± SD of n=3 technical replicates and are representative of at least two
independent experiments. C-F) Analysis of thymi from P14-transgenic CD4cre Ptpn11
fl/fland Ptpn11
fl/flmice. C and D) Cellularity (C)
and percentages of DN, DP, and SP thymocytes among lineage-negative lymphocytes (D) are depicted. E and F) A representative
histogram illustrates the levels of CD5, CD24, and CD69 (E) and of Vα2 and TCRβ (F) on DP and CD8 SP. G) Inguinal lymph nodes
(LNs) cellularity and percentages of CD4
+(CD4
+CD3
+) and CD8
+(CD8
+CD3
+) T cells (gated on lymphocytes) in CD4cre
Ptpn11
wt/wt, CD4cre Ptpn11
fl/fl, and Ptpn11
fl/flmice are illustrated. H and I) Percentages of naïve (CD44
low-intCD62L
high), “CM-like”
(CD44
highCD62L
high), and “EM-like” (CD44
highCD62L
low) CD4
+and CD8
+T lymphocytes in the iLNs of the afore-mentioned mice (H)
and a representative flow cytometry plot of CD62L and CD44 expression (I) are depicted. Results represent mean ± SEM of n=4 mice/
group (C and D) and of n=3-5 mice/group (G and H) and are representative of two (C-F) or at least two (G-I) independent
experiments. Only statistically significant differences are shown (B-D, G and H); Student’s t-test; ***p ≤ 0.001
C
0 25 50 cellularity thymus (x10 6) 0 20 40 60 80 100 DN DP CD4 SP CD8 SP % subsets P14 CD4cre Ptpn11fl/fl P14 Ptpn11fl/fl CD5 CD24 CD69 vα2 TCRβ gated on CD8 SP % of max CD5 CD24 CD69 vα2 TCRβ gated on CD4/CD8 DPE
% of max % of max % of maxF
P14 CD4cre Ptpn11P14 Ptpn11 fl/fl fl/fl FMO P14 CD4cre Ptpn11fl/fl FMO P14 Ptpn11fl/fl gated on CD8 SP gated on CD4/CD8 DPD
cellularity LN (x10 6)G
naive“CM-like” “EM-like” naive “CM-like” “EM-like” 0 20 40 60 80 100 % subsets (among CD4 + T cells) 0 20 40 60 80 100 % subsets (among CD8 + T cells) 0 1 2 3 % among lymphocytes 0 10 20 30 40 CD4 + CD8 + Ptpn11fl/fl CD4cre Ptpn11fl/fl CD4cre Ptpn11wt/wt CD62L CD44 CD4+ CD8+ 76.8 80.9 80.4 75 74.1 72.3 3.94 4.27 4.45 6.91 12.3 6.03 8.84 6.39 8.73 18.2 16.3 17.6 1.65 5.24 4.0 5.63 4.43 5.65
I
CD4cre Ptpn11wt/wt CD4cre Ptpn11fl/fl Ptpn11fl/flH
d8
A
d34 spleen 0 5 10 15 % CD4 + T cells 0 5 10 15 20 % CD4 + T cells d20 0 0.5 1.0 1.5 2.0 n° CD4 + T cells (x10 6)B
0 20 40 cellularity spleen (x10 6) d34 CD4cre Ptpn11wt/wt CD4cre Ptpn11fl/fl Ptpn11fl/flD
0 10 20 30 0 10 20 0 5 10 15 0 2 3 4 1 % CD8 + T cells % CD62L lo CD44 hi CD8 + cells % PD-1 + CD8 + cells % gp33 + CD8 + cells ** *** ** ** *** *** *** *** CD4cre Ptpn11wt/wt CD4cre Ptpn11fl/fl CD4cre Ptpn11wt/fl CD4cre Ptpn11wt/wt CD4cre Ptpn11fl/fl Ptpn11fl/fl 0 2 4 6 8 10 % CD62L lo CD44 hi CD4 + cells % CD62L lo PD-1 hi CD4 + cells CD44 CD62L PD-1 CD62L 25.6 17.4 15.7 41.4 9.27 13.0 13.1 64.7 28.6 12.9 25.7 32.7 42.3 5.14 14.8 37.7 21.8 4.89 18.9 54.5 41.0 6.1 14.6 38.3 Ptpn11fl/fl CD4cre Ptpn11fl/fl CD4cre Ptpn11wt/wt d34 spleen on CD8+ T cellsC
E
0 2 4 6 8 bloodFigure S2. Characterization of T cells in CD4cre Ptpn11
fl/flmice during chronic LCMV. Related to Figure 2
A) Graph illustrates percentages of CD4
+T cells at day 8 and 20 p.i. in blood of CD4cre Ptpn11
wt/wt, CD4cre Ptpn11
fl/fland Ptpn11
fl/flmice. B) Graphs depict percentages and numbers of CD4
+T cells, percentages of CD62L low CD44
high (CD62L
loCD44
hi), and of CD62L low PD-1 high (CD62L
loPD-1
hi) CD4
+T cells at day 34 p.i. in the spleen of
the afore-mentioned mice. C) Representative flow cytometry plots of CD62L/CD44 or CD62L/PD-1 expression on
CD8
+T cells at day 34 p.i. in the spleen. D) Graph shows spleen cellularity of CD4cre Ptpn11
wt/wt, CD4cre Ptpn11
fl/fland Ptpn11
fl/flmice at day 34 p.i.. E) Graphs illustrate percentages of CD8
+, CD44high CD62Llow effector, PD1
+, and
gp33-specific (gp33
+) T cells among lymphocytes in the spleen of CD4cre Ptpn11
wt/wt, CD4cre Ptpn11
fl/fl, and CD4cre
Ptpn11
wt/flmice at day 34 p.i.. A, B, D, and E) Results are a pool of two independent experiments, and mean ± SEM
of n=6-15 (A), n=6-12 (B and D), n=7-8 (E) mice/group. Only differences statistically significant in comparison to
both controls are shown; **p ≤ 0.01, ***p ≤ 0.001; Student’s t-test
CD45.1 CD45.2 CD45.1 CD45.2 45.3 54.8 14.3 38.4 55.1 44.7 control KO control KO 6.05 58.6 0 10 20 ratio normalized on initial mix
mix day 11 (spleen) co-transfer P14 Ptpn11fl/fl - P14 CD4cre Ptpn11fl/fl co-transfer P14 control - P14 Pdcd1 -/-***
A
B
Figure S3. Ptnp11- and Pdcd1- deficient T cells show profound differences in expansion upon chronic LCMV. Related to
Figure 3. Wild type recipient mice (CD45.2) were co-transferred with a mix of 400 control (Ptpn11
fl/fl, CD45.1) and 400
Ptpn11-deficient (KO; CD4cre Ptpn11
fl/fl, CD45.1/2) P14 CD8
+T cells and infected with LCMV clone 13. In parallel, wild
type mice (CD45.1/2) were co-transferred with a mix of 400 control (CD45.1) and 400 Pdcd1-deficient (KO; CD45.2) P14
CD8
+T cells and infected with LCMV clone 13. A) Percentages of KO and control P14 T cells in the initial mix and in the
spleen at day 11 p.i. are shown as a representative flow cytometry plot (gated on Va2
+CD8
+T cells). B) The graph depicts the
ratio of Ptpn11- or Pdcd1- deficient over control (normalized to the initial mix) at day 11 in individual mice (n=5 mice/group);
Only statistically significant differences are shown; ***p ≤ 0.001; Student’s t-test.
P14 CD4cre Ptpn11fl/fl /P14 Ptpn11fl/fl
A
0 50 100 Armstrong clone 13 % IFN-γ + cells 0 50 100 Armstrong clone 13 % TNFα + cells (among IFN-γ +) * P14 CD4cre Ptpn11fl/fl P14 control TNFαIFN-γ 91.1 4.03 88.6 7.81 38.8 44.3 21.2 58.6 Armstrong clone 13 day 29 p.i. (gp33 peptide)0 20 40 60 80 100 % CD107a + cells clone 13 Armstrong P14 CD4cre Ptpn11fl/fl (gp33 peptide) P14 control (gp33 peptide)
P14 CD4cre Ptpn11fl/fl (not stimulated)
P14 control (not stimulated)
CD107a CD107a
% of max
Armstrong clone 13
day 30 p.i. (gp33 peptide)
PFU/kidney d34 kidney
E
CD4cre Ptpn11wt/wt CD4cre Ptpn11fl/fl Ptpn11fl/fl 100 101 102 103 104 105 100 101 102 103 104 105 blood: day 8 day 18-22PFU/ml
C
D
F
gp33 peptideB
gp33 peptideFigure S4. Functional characterization of Ptnp11-deficient T cells during chronic LCMV. Related to Figure 4
A-D) Wild type recipient mice were co-transferred with a 1:1 mix of congenically-marked control (CD4cre Ptpn11
wt/wt) and
Ptpn11-deficient P14 CD8
+T cells and infected with LCMV clone 13 or Armstrong, as a control. A-D) Splenocytes isolated at
day 30 from infected mice were restimulated with gp-33 peptide pulsing and stained for CD107a (A and B), IFN-γ and TNF-α
(C and D). Graphs (A, C) illustrate frequencies of CD107a
+(A), IFN-γ
+, and TNFα
+among IFN-γ
+(C) Ptpn11-deficient and
control P14 T cells, and representative flow cytometry pictures are shown (B, D). Results depict mean ± SEM of n=3-4
(Armstrong) and n=5-6 (clone 13) (A and C). Results confirm data shown in Figure 4B and C and were performed once with
gp-33 restimulation (A and B) or are representative of at least two independent experiments (C and D). E and F) Viral titers at
the indicated times in serum (E) and 34 days after infection with LCMV clone 13 in the kidney (F) from CD4cre Ptpn11
wt/wt,
CD4cre Ptpn11
fl/fland Ptpn11
fl/flmice. Results illustrate mean ± SEM of n=4-9 mice/group (E) and n=6-12 mice/group (F) and
are a pool of two independent experiments. Only statistically significant differences are shown; *p ≤ 0.05, Student’s t-test.
TNFαIFN-γ P14 CD4cre Ptpn11fl/fl
P14 control
P14 CD4cre Ptpn11fl/fl
days 0 10 20 0 500 1000 0 10 20 days control Pdcd1 -/-0 20 40 60 80 tumor volume (mm 3) tumor volume (mm 3)
A
day 5 post tumor engraftment 5/7 0/8 control Pdcd1 -/-tumor volume (mm 3) CD4cre Ptpn11wt/wt /Ptnp11wt/fl CD4cre Ptpn11fl/fl Ptpn11fl/fl CD4cre Ptpn11wt/wt /Ptnp11wt/fl CD4cre Ptpn11fl/fl Ptpn11fl/fl 0 100 200 300day 5/6 post tumor engraftment
isotype ctrl α-PD-1 0 10 20 0 500 1000 0 10 20 0 10 20 0 500 1000 0 10 20 CD4cre Ptpn11wt/wt CD4cre Ptpn11fl/fl CD4cre Ptpn11wt/wt CD4cre Ptpn11fl/fl PBS α-CD4
C
tumor volume (mm 3) days days days days tumor volume (mm 3) 0 10 20 30 0 50 100 survival (%) CD4cre Ptpn11wt/wt (PBS) CD4cre Ptpn11wt/wt (α-CD4) CD4cre Ptpn11fl/fl (PBS) CD4cre Ptpn11fl/fl (α-CD4) p value CD4cre Ptpn11wt/wt (PBS) vs CD4cre Ptpn11wt/wt (α-CD4) CD4cre Ptpn11fl/fl (PBS) vs CD4cre Ptpn11fl/fl (α-CD4) CD4cre Ptpn11wt/wt (PBS) vs CD4cre Ptpn11fl/fl (PBS) CD4cre Ptpn11wt/wt (α-CD4) vs CD4cre Ptpn11fl/fl (α-CD4) ** 0.0012 **** < 0.0001 ns 0.86 ns 0.34 0/11 0/7 4/10 6/9 daysB
D
0 50 100 % PD-1 + on CD8 + cells 0 20 40 60 % 2B4 + on CD8 + cells 0 20 40 60 80 % Lag-3 + on CD8 + cells CD4cre Ptpn11fl/fl Ptpn11fl/flF
isotype ctrl treated mice (day 12 post tumor engraftment)Figure S5. Control of MC38 engraftment in the absence of PD-1 signaling, helper T cells, and Shp2. Related to Figure 5.
A) Wild type and Pdcd1-deficient mice were subcutaneously inoculated with MC38 cells. Tumor growth in individual mice is
shown at day 5 (on the left) and over time (on the right); the number of mice completely controlling tumor growth in each group is
indicated within the graphs. B) Mice of the indicated genotypes were subcutaneously inoculated with MC38 cells. Graph depicts
tumor volume 5-6 days after (depending on the experiment), when mice were randomized as indicated and treatment with α-PD1
antibody or isotype control was started. C) CD4cre Ptpn11
wt/wtand CD4cre Ptpn11
fl/flmice were depleted of CD4
+T cells by
weekly i.p. injections of α-CD4-depleting antibody (GK1.5, BioXcell, 200 μg/mouse), or PBS as control, starting two days prior
to MC38 engraftment. Tumor growth in individual mice is shown (on the left); the number of mice completely controlling tumor
growth in each group is indicated next to the graphs. Survival curves and statistical comparisons are shown (on the right). D-F)
CD4cre Ptpn11
fl/fland Ptpn11
fl/flmice were inoculated with MC38 cells. D) Graphs show tumor volume 5 days after inoculation
(on the left), when mice were divided as indicated and treatment with α-PD-1 antibody or isotype control was started, and 12 days
(on the right) after inoculation and three injections of α-PD1 antibody or isotype control. E) Graph depicts the percentage of
infiltrating T helper cells (gated as CD8
-CD3
+, which largely correspond to CD4
+T lymphocytes) in isotype and α-PD-1
antibody-treated mice among hematopoietic cells. F) Percentage of PD-1
+, Lag-3
+, and 2B4
+among CD8
+T cells infiltrating
tumors from isotype-treated CD4cre Ptpn11
fl/fland Ptpn11
fl/flmice. Results depict n=7-11 mice/group (C, right panel), and mean ±
SEM of n=7-8 mice/group (A, left panel), of n=9-11 mice/group (B), of n=3-9 mice/group (D-F). Data are a pool of two
independent experiments (A-D and F) and a representative graph of two independent experiments (E). Only statistically
tumor volume (mm
3)
day 5 post tumor engraftment
isotype ctrl α-PD-1 Ptpn11fl/fl CD4cre Ptpn11fl/fl Ptpn11fl/fl CD4cre Ptpn11fl/fl 0 200 400 600 800 p=0.057 p=0.052 day 12 post tumor engraftment
0 50 100 150 tumor volume (mm 3) % CD3 + CD8 - cells 0 10 20
day 12 post tumor engraftment