HAL Id: hal-00316477
https://hal.archives-ouvertes.fr/hal-00316477
Submitted on 1 Jan 1998HAL is a multi-disciplinary open access
archive for the deposit and dissemination of sci-entific research documents, whether they are pub-lished or not. The documents may come from teaching and research institutions in France or abroad, or from public or private research centers.
L’archive ouverte pluridisciplinaire HAL, est destinée au dépôt et à la diffusion de documents scientifiques de niveau recherche, publiés ou non, émanant des établissements d’enseignement et de recherche français ou étrangers, des laboratoires publics ou privés.
Letter to the Editor: First complementary observations
by ionospheric tomography, the EISCAT Svalbard radar
and the CUTLASS HF radar
C. N. Mitchell, I. K. Walker, S. E. Pryse, I. Kersley, I. W. Mccrea, T. B. Jones
To cite this version:
C. N. Mitchell, I. K. Walker, S. E. Pryse, I. Kersley, I. W. Mccrea, et al.. Letter to the Editor: First complementary observations by ionospheric tomography, the EISCAT Svalbard radar and the CUTLASS HF radar. Annales Geophysicae, European Geosciences Union, 1998, 16 (11), pp.1519-1522. �hal-00316477�
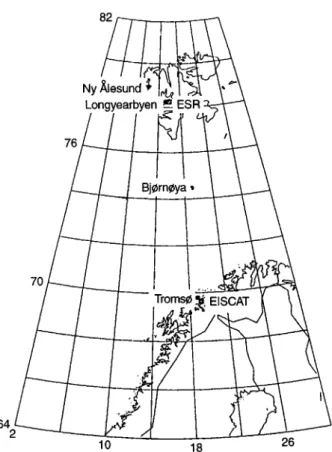
latitudes must be reconciled with the sparsity of settle-ments providing suitable locations. Since October 1996 Navy Navigation Satellite System (NNSS) receivers have been deployed at four sites shown on the map in Fig. 1: Tromsø (69.8°N,19.0°E), Bjørnøya (74.5°N,19.0°E), Longyearbyen (78.2°N,15.7°E) and Ny Ålesund (78.9°N,12.0°E). The sites were chosen to span the region between the EISCAT radar at Tromsø (69.6°N,19.2°E) and the new EISCAT Svalbard Radar (ESR) at Longyearbyen (78.1°N,16.0°E), allowing investigations into the
elec-Letter to the Editor
First complementary observations by ionospheric tomography,
the EISCAT Svalbard radar and the CUTLASS HF radar
C. N. Mitchell1, I. K. Walker1, S. E. Pryse1, I. Kersley1, I. W. McCrea2, T. B. Jones3
1
Department of Physics, The University of Wales, Aberystwyth, SY23 3BZ, UK 2Rutherford Appleton Laboratory, Chilton, Didcot, Oxon, OX11 0QX, UK 3
Department of Physics and Astronomy, University of Leicester, Leicester, LE1 7RH, UK Received: 6 October 1997 / Revised: 3 February 1998 / Accepted: 4 February 1998
Abstract. Experimental results are presented from
iono-spheric tomography, the EISCAT Svalbard radar and the CUTLASS HF radar. Tomographic measurements on 10 October 1996, showing a narrow, field-aligned enhance-ment in electron density in the post-noon sector of the day-side auroral zone, are related to a temporal increase in the plasma concentration observed by the incoherent scatter radar in the region where the HF radar indicated a low ve-locity sunwards convection. The results demonstrate the complementary nature of these three instruments for po-lar-cap ionospheric studies.
Key words. Ionosphere · Auroral ionosphere ·
Polar ionosphere · Radio science (ionospheric physics)
Introduction
In this paper first results are presented from observations of the dayside auroral ionosphere over Svalbard using three complementary experimental techniques: iono-spheric tomography giving an image of the spatial struc-ture of electron density; the EISCAT Svalbard radar (ESR) yielding the temporal development of electron concenttion along a fixed line of sight and the CUTLASS HF ra-dar giving information on the convection of the plasma.
Ionospheric tomography has been used extensively at mid-and auroral latitudes to produce images of electron density. A number of successful experimental results have been reported in a special issue of Annales Geophysicae (13, 1995). Pryse et al. (1997) demonstrated that it was possible to create tomographic images of the polar-cap ionosphere using just two closely-spaced receivers at Longyearbyen and Ny Ålesund. Their results showed tom-ographic images of the cusp region at magnetic midday, and of the polar-hole in the dawn convection cell.
The ground-based receiver configuration for iono-spheric tomography requires a number of stations aligned approximately in longitude, a restriction that at high
Fig. 1. Map showing the locations of the receiving stations and the
sible to use a tomographic algorithm to obtain the values of electron density in a latitude-height plane.
The tomographic image presented in this paper was re-constructed using the method described by Fremouw et al. (1992), with modifications to use a range of Chapman pro-files and to allow the incorporation of hmF2 and NmF2 values from the dynasonde located at Tromsø to improve the reconstruction of the vertical profile.
Results and discussion
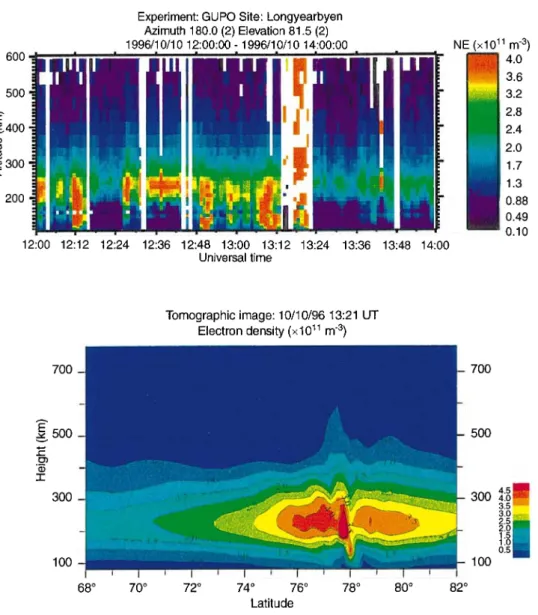
On 10 October 1996 the ESR radar ran for over 7 hours in the GUP0 mode, with the beam static and pointing approx-imately along the geomagnetic field line at an elevation of some 81°. At the time relevant to the present observations both sites of the CUTLASS radar were receiving returns from ionospheric irregularities obove Svalbard. The elec-tron densities obtained from ESR between 1200 and 1400 UT are plotted in Fig. 2. It should be noted that an unavoid-able gap in the observations occurred between 1313 and 1323 UT. The F-layer peak, at an altitude of approximately 240 km, is broken by regions of enhanced electron den-1520 C. N. Mitchell et al.: First complementary observations by ionospheric tomography, ESR and CUTLASS
Fig. 2. Electron densities
ob-tained from the EISCAT Sval-bard radar on 10 October 1996. The enhancement in electron density occurring between 1307 and 1312 UT is of particular interest to the current study
Fig. 3. Tomographic image of
electron density for the satellite crossing 70°N,3°E at 1321 UT on 10 October 1996. A latitudi-nally narrow enhancement in electron density at 78°N in the ionosphere to the west of Sval-bard is a prominent feature
tron-density distribution in the auroral and polar-cap re-gions of the ionosphere. In this paper initial observations are presented from this tomographic chain and from ESR. Interpretation of the results is aided by information on plasma velocities measured by the CUTLASS HF radar. This bistatic radar, with stations at Hankasalmi (62.3°N, 26.6°E) in Finland and Pykkvibær (63.8°N,20.5°W) in Ice-land, can determine the convective flow of the plasma over a wide area of the high-latitude ionosphere including that of interest here (Milan et al., 1997).
Experimental and method
The experimental system designed for recording radio sig-nals transmitted from the NNSS satellites has been de-scribed by Kersley et al. (1993). The phase-coherent sig-nals are transmitted on two frequencies, 150 and 400 MHz. The recorded signals are in the form of differential carrier phase measurements, that provide information on the total electron content along a number of ray paths as the satellite passes from horizon-to-horizon. By combining such measurements from a number of receivers, it is
pos-sities extending to lower altitudes. Several enhancements in the density were particularly intense, at around 1212, 1250 and 1308 UT, when densities in excess of 4.0×10¹¹m–3 were seen even at the lowest altitude of measurements by the radar. The enhancement observed between 1307 and 1312 UT is of particular interest as it was close in time to an NNSS satellite pass.
The tomographic image shown in Fig. 3 is for a south-bound stallite pass that crossed 70°N at a longitude of 3°E at 1321 UT on 10 October 1996. The height of the F-layer peak is in general agreement with that found by ESR. At 78°N a latitudinally narrow enhancement in electron den-sity can be seen to extent down to altitudes below the F-layer peak. This field-aligned structure has the character-istic ionospheric signatures of a discrete auroral arc in the
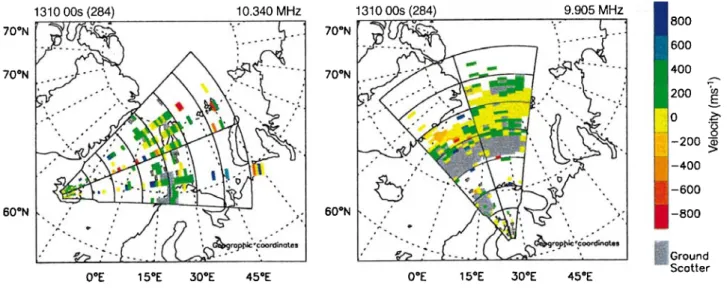
post-noon sector of the dayside auroral zone, of the kind studied by Moen et al. (1997). The plasma circulation in the polar-cap ionosphere driven by the solar wind is such that a magnetic local time (MLT) and corrected geomag-netic latitude (CGM) framework is more appropriate to re-late the features in tomographic images to measurements from other instruments. The enhancement in the ESR measurements at 1308 UT and the narrow feature in the tomographic image to the west of Svalbard have been con-verted to positions on the MLT/CGM plot shown in Fig. 4. Also shown in Fig. 4 is a plot of electric potential esti-mated from the IZMEM model for the prevalent IMF con-ditions measured by the WIND satellite (By + 2.8 nT, Bz – 0.8 nT). The IZMEM plot shows that the spatial struc-ture seen on the tomographic image and the temporal den-sity enhancement measured by the radar are located on sunward-convecting field lines in the post-noon sector. The feature imaged by tomography is coincident in MLT/CGM with that seen by ESR. It is possible that the feature imaged by ionospheric tomography is that ob-served by the ESR at 1308 UT, provided that the plasma convection velocities are low. Line-of-sight velocity meas-urements from the CUTLASS radar are displayed in Fig. 5. The left plot shows measurements from Iceland and the right plot measurements from Finland. Negative velocities are away from the radar. Although there was not sufficient spatial overlap to combine the measurements to obtain vec-tor velocities, the line-of-sight velocities from both radars over Svalbard are less than 200 m s–1. In addition, the ve-locities are predominantly away from the Finland radar and towards the Iceland radar, in agreement with the inter-pretation that the same feature in the weak sunward con-vective flow was being observed by both ESR and tomog-raphy.
These first results demonstrate the potential of multi-instrument studies in the high-latitude ionosphere, where measurements of electron density from the ESR provide information on the temporal changes in the plasma den-sity at one location, ionospheric tomography shows the spatial distribution of electron density over an extended region of latitude and the CUTLASS radar measures plasma convection velocities.
Fig. 4. IZMEM plot of electric potential for the prevalent IMF
con-ditions on MLT/CGM co-ordinates. The section of the tomograph-ic image and the coincident location of the feature in the image (75.0°N, 16.48 MLT) and the ESR measurements (75.0°N, 14.41 MLT) are shown
Fig. 5. CUTLASS velocity components for the Iceland radar (left)
and the Finland radar (right). Negative velocities are away from the radars
Acknowledgements. Grateful thanks are extended to the individuals
and organisations responsible for housing and monitoring receiving systems for the ionospheric tomography experiment. They include the Norwegian Polar Research Institute at Ny Ålesund, staff at UNIS, Longyearbyen and Prof. T. Hansen and staff at the University of Tromsø. Thanks are also due to the EISCAT Scientific Organisation and the EISCAT group and World Data Centre at the UK Rutherford and Appleton Laboratory. The IZMEM model has been used cour-tesy of V. Papitashvili (SPRL, University of Michigan). The values of the IMF components were provided by the NASA/GSFC WIND magnetometer data processing team. The research has been support-ed by the UK Particle Physics and Astronomy Research Council. CUTLASS is a UK national facility funded by PPARC.
Topical Editor D. Alcaydé thanks D. J. McEwen for his help in evaluating this paper.
References
Fremouw, E. J., J. A. Secan, and B. M. Howe, Application of
stochastic inverse theory to ionospheric tomography, Radio Sci.,
17, 721–732, 1992.
Kersley, L., J. A. T. Heaton, S. E. Pryse, and T. D. Raymund,
Ex-perimental ionospheric tomography with ionosonde input and EISCAT verification, Ann. Geophysicae, 11, 1064–1070, 1993.
Milan, S. E., T. K. Yeoman, M. Lester, E. C. Thomas, and T. B. Jones, Initial backscatter occurrence statistics from CUTLASS
HF radar, Ann. Geophysicae, 15, 702–718, 1997.
Moen, J., S. T. Berry, L. Kersley, and B. Lybekk, Probing discrete
auroral arcs by ionospheric tomography, Ann. Geophysicae, 1998 (in press).
Pryse, S. E., L. Kersley, M. J. Williams, I. K. Walker, and C. A. Willson, Tomographic imaging of the polar-cap ionosphere over
Svalbard, J. Atmos. Terr. Phys., 59, 1953–1959, 1997.