HAL Id: hal-00317822
https://hal.archives-ouvertes.fr/hal-00317822
Submitted on 28 Jul 2005
HAL is a multi-disciplinary open access
archive for the deposit and dissemination of
sci-entific research documents, whether they are
pub-lished or not. The documents may come from
teaching and research institutions in France or
abroad, or from public or private research centers.
L’archive ouverte pluridisciplinaire HAL, est
destinée au dépôt et à la diffusion de documents
scientifiques de niveau recherche, publiés ou non,
émanant des établissements d’enseignement et de
recherche français ou étrangers, des laboratoires
publics ou privés.
oblique ionospheric sounding, and TEC from GPS
during a magnetic storm
D. V. Blagoveshchensky, M. Lester, V. A. Kornienko, I. I. Shagimuratov, A. J.
Stocker, E. M. Warrington
To cite this version:
D. V. Blagoveshchensky, M. Lester, V. A. Kornienko, I. I. Shagimuratov, A. J. Stocker, et al..
Observa-tions by the CUTLASS radar, HF Doppler, oblique ionospheric sounding, and TEC from GPS during
a magnetic storm. Annales Geophysicae, European Geosciences Union, 2005, 23 (5), pp.1697-1709.
�hal-00317822�
SRef-ID: 1432-0576/ag/2005-23-1697 © European Geosciences Union 2005
Annales
Geophysicae
Observations by the CUTLASS radar, HF Doppler, oblique
ionospheric sounding, and TEC from GPS during a magnetic storm
D. V. Blagoveshchensky1, M. Lester2, V. A. Kornienko3, I. I. Shagimuratov4, A. J. Stocker5, and E. M. Warrington5 1Department of Radioengineering, St. Petersburg University of Aerospace Instrumentation, Russia
2Department of Physics and Astronomy, University of Leicester, UK
3Department of Geophysics, Arctic and Antarctic Research Institute, St. Petersburg, Russia 4West Department of IZMIRAN, Kaliningrad, Russia
5Department of Engineering, University of Leicester, UK
Received: 21 April 2004 – Revised: 7 April 2005 – Accepted: 14 April 2005 – Published: 28 July 2005
Abstract. Multi-diagnostic observations, covering a
signif-icant area of northwest Europe, were made during the mag-netic storm interval (28–29 April 2001) that occurred during the High Rate SolarMax IGS/GPS-campaign. HF radio ob-servations were made with vertical sounders (St. Petersburg and Sodankyla), oblique incidence sounders (OIS), on paths from Murmansk to St. Petersburg, 1050 km, and Inskip to Leicester, 170 km, Doppler sounders, on paths from Cyprus to St. Petersburg, 2800 km, and Murmansk to St. Petersburg, and a coherent scatter radar (CUTLASS, Hankasalmi, Fin-land). These, together with total electron content (TEC) mea-surements made at GPS stations from the Euref network in northwest Europe, are presented in this paper. A broad com-parison of radio propagation data with ionospheric data at high and mid latitudes, under quiet and disturbed conditions, was undertaken. This analysis, together with a geophysi-cal interpretation, allow us to better understand the nature of the ionospheric processes which occur during geomagnetic storms. The peculiarity of the storm was that it comprised of three individual substorms, the first of which appears to have been triggered by a compression of the magnetosphere. Be-sides the storm effects, we have also studied substorm effects in the observations separately, providing an improved under-standing of the storm/substorm relationship. The main re-sults of the investigations are the following. A narrow trough is formed some 10 h after the storm onset in the TEC which is most likely a result of enhanced ionospheric convection. An enhancement in TEC some 2–3 h after the storm onset is most likely a result of heating and upwelling of the au-roral ionosphere caused by enhanced currents. The so-called main effect on ionospheric propagation was observed at mid-latitudes during the first two substorms, but only during the first substorm at high latitudes. Ionospheric irregularities ob-served by CUTLASS were clearly related to the gradient in Correspondence to: D. V. Blagoveshchensky
(dvb@ppp.delfa.net)
TEC associated with the trough. The oblique sounder and Doppler observations also demonstrate differences between the mid-latitude and high-latitude paths during this particu-lar storm.
Keywords. Ionosphere (Ionospheric disturbances) –
Mag-netospheric physics (Storms and substorms) – Radio science (Ionospheric propagation)
1 Introduction
The High Rate GPS/GLONASS measuring campaign (HIRAC) was initiated by the International GPS Service (IGS) and supported by COST 271 activities with the aim of analysing transionospheric signals received from naviga-tion satellites by the IGS ground stanaviga-tion network, in order to study the behaviour of the ionosphere during the recent so-lar maximum. Measurements, including total electron con-tent (TEC), were undertaken during the period 23–29 April 2001, with the interval from 28 to 29 April 2001 being of par-ticular interest since a magnetic storm of moderate intensity took place at this time. The largest contribution to the TEC is typically from the F2 region. However, we know that ge-omagnetic storms cause both positive and negative changes to the peak electron density, NmF2, depending upon loca-tion and time within the storm. Consequently, we would ex-pect changes in TEC during storms to be dominated by the changes in F2 region density, provided the electron density is not simply re-distributed in altitude, although it is possible for changes in E-region density to contribute as well. Thus, comparisons utilizing a variety of techniques play a valuable role in developing our understanding of the storm effects on the total electron distribution within the ionosphere.
Although we understand many of the geomagnetic storm effects on the F2-region (e.g. Buonsanto, 1999; Gonzales et al., 1994; Lastovicka, 2002), a complete understanding
Fig. 1. Map showing the locations and paths of the various HF instrumentation employed in these experiments. The GPS measure-ments fall in the range between latitudes of 40◦and 70◦N and lon-gitudes of 10◦W and 40◦E.
remains elusive due to the highly variable nature of magnetic storms. The storm on 28 and 29 April 2001, which is dis-cussed in this paper, illustrates this variability. Although both positive and negative phases, similar to a “classical” storm, were present, the main feature of this storm is the presence of three well-defined substorms identified in the AE index. The study of the ionospheric effects of this storm interval, therefore, enables us to distinguish the impact of substorm effects from the larger scale storm effects, and, therefore, will contribute to the debate on the storm/substorm relationship, with particular reference to the effects in the mid- and high-latitude ionosphere.
The substorm process is known to manifest itself in a va-riety of ways in the ionosphere, such as the initial auroral brightening and subsequent expansion of the disturbed au-rora, the development of the ionospheric current associated with the substorm current wedge, equatorward ionospheric convection bursts, larger scale enhancements of westward flow in the pre-midnight sector. The electron density in the lower ionosphere is substantially enhanced, particularly in the auroral zone which leads to a large increase in radio wave absorption in the HF band (e.g. Milan et al., 1998). The enhancement of the lower ionosphere electron density is caused by strongly increased precipitation of energetic
par-ticles from the magnetosphere, such that an increase in ab-sorption measured by an auroral zone riometer from 0.0 to 2.5 dB is equivalent to a change in electron density at heights below 90 km of a factor of 100 or more (Lastovicka, 2002).
Whilst the purpose of the HIRAC campaign was to make measurements of TEC (in this paper from the Euref net-work of GPS stations in northwest Europe), it is necessary to compare such measurements with those made contempo-raneously with a range of other instrumentation. The purpose of this paper is to present HF radio measurements made with ionosondes at St. Petersburg, and Sodankyla, oblique inci-dence sounders (OIS) on paths from Murmansk to St. Pe-tersburg (1050 km) and Inskip to Leicester (170 km), and HF Doppler measurements on paths from Cyprus to St. Peters-burg and Murmansk to St. PetersPeters-burg to support the GPS ob-servations. In addition, HF radar measurements were also made with the CUTLASS radar located in Hankasalmi, Fin-land. The locations of these sites are shown in Fig. 1. Fur-thermore, these observations were supported by measure-ments of solar wind parameters, the interplanetary magnetic field (IMF), the Kp, AE and Dst magnetic indices,
riome-ter absorption data from the Sodankyla observatory, and data from the IMAGE magnetometer network.
The remainder of this paper presents an overview of the solar wind and geomagnetic conditions prevailing during the storm. The observations of TEC are then presented, followed by the HF observations. We conclude the paper with a dis-cussion of the observations with reference to our understand-ing of magnetic and ionospheric storms and magnetospheric substorms.
2 Character of the geomagnetic disturbance
To provide the necessary context for the following observa-tions we present the Dst, AE and Kp magnetic indices and
the IMF Bzcomponent measured by the ACE spacecraft for
the interval 01:00 UT, 28 April 2001 to 23:59 UT on 29 April 2001 (Fig. 2). As indicated by the Dst index (Fig. 2a) a
storm main phase commenced at approximately 13:00 UT on 28 April 2001, following a positive phase which had be-gun at 05:00 UT on the same day. The main phase of the storm peaked at 02:00 UT on 29 April 2001, when the Dst
reached its minimum value, and ended at about 09:00 UT on 29 April 2001.
Inspection of the hourly values of the IMF Bzcomponent
(Fig. 2b) indicates that the IMF was predominantly north-ward until just after 15:00 UT on 28 April 2001, after which it remained southward for almost 15 h before turning north-ward and remained so for the rest of the interval. The so-lar wind velocity and density during this interval (data not shown) demonstrate that a shock in the solar wind passed ACE at ∼04:40 UT on 28 April 2001. At this time the solar wind velocity increased from ∼470 km s−1to ∼750 km s−1, the density from 4 cm−3to 10 cm−3, resulting in an equiva-lent increase in the solar wind dynamic pressure from 1.4 nPa to 9 nPa. This increase by a factor of 10 in pressure caused a
sudden impulse in the geomagnetic field at 05:00 UT on 28 April 2001 and was clearly responsible for the large increase in the hourly Dst at that time (Fig. 2a). The solar wind
veloc-ity and densveloc-ity remained higher than their pre-shock values for much of the following interval.
The hourly AE index values (Fig. 2c) indicate that the magnetic storm contained three pronounced substorms, num-bered 1, 2 and 3, when AE exceeded 500 nT. The expansion phase onset (To)of the first substorm was at 05:00 UT on
28 April 2001, had a maximum AE of ∼800 nT, and ended (Te)some time between 07:00 and 08:00 UT. More
accu-rate timings from preliminary quick look 1-min values of AE indicate Towas 05:00 UT and Te07:00 UT. This substorm
occurred during a prolonged interval of northward IMF and was a consequence of the shock impact mentioned above. After 07:00 UT, AE remained high, typically of the order of 300 nT, but reasonably steady, with no impulsive changes indicative of substorm activity until after 12:00 UT. The sec-ond substorm started at 13:30 UT and ended at 15:30 UT (based upon preliminary quick look one-minute data). This substorm had the largest value of AE of the three events, reaching nearly 1500 nT. A number of intervals of southward IMF were measured by ACE from ∼09:00 UT to 11:00 UT, 11:30 UT to 12:00 UT and 12:30 UT to 14:00 UT prior to and during the second substorm. The third and final sub-storm during the sub-storm period started at 01:00 UT on 29 April and finished at 04:00 UT (timings again based upon the pre-liminary data). This substorm occurred during a period of prolonged southward IMF. It is evident from Fig. 2d that the main maxima of Kpcoincide with the three substorm
inter-vals, with the largest values of Kp(∼6) occurring during the
second, most intense, substorm.
To summarise the geomagnetic conditions, the Dst
mini-mum at 02:00 UT on 29 April 2001 was less than −50 nT, and Bzwas less than −5 nT for at least two hours during the
interval. Therefore, according to the classification given by Gonzalez et al. (1994), the storm is categorised as moderate. The onset of the positive phase of the storm occurred follow-ing a shock in the solar wind impactfollow-ing the Earth’s magneto-sphere, while the negative or main phase of the storm began some 8 h after this. The periods 00:00–06:00 UT on 28 April and 12:00–23:59 UT on 29 April may be considered as either weakly disturbed or quiet.
3 Ionospheric observations
3.1 Total electron content (TEC) measurements
Global Positioning System (GPS) observations provide an excellent method for studying the large-scale structure and dynamics of the ionosphere. The total electron content (TEC) along the path between the satellite and the ground re-ceiver can be determined from observations of the time delay of the dual-frequency (1.57 GHz and 1.23 GHz) GPS signals. A technique has been developed in the West Department of IZMIRAN that allows TEC maps over Europe to be produced
Fig. 2. Variations of geophysical parameters during a magnetic storm on 28–29 April 2001, (a) Dst-index, (b) Bz-component of the interplanetary magnetic field, (c) AE-index, and (d) Kp. The three substorms that occurred during this period are marked by ver-tical lines and indicated as 1, 2, and 3.
using the GPS measurements from more than 60 stations of the Euref Network (Shagimuratov, 2002). The high density of stations in Europe enables TEC maps to be derived with high temporal and spatial resolution between latitudes of 40◦ and 75◦N and longitudes of 10◦W and 40◦E. The error in the TEC determination for the 30-s intervals of averaging used here does not exceed 1014m−2(0.01 TEC units). This permits ionisation irregularities and wave processes in the ionosphere to be monitored over a wide range of amplitudes, up to 10−4of the diurnal variation of TEC, and periods, from a few hours down to 5 min.
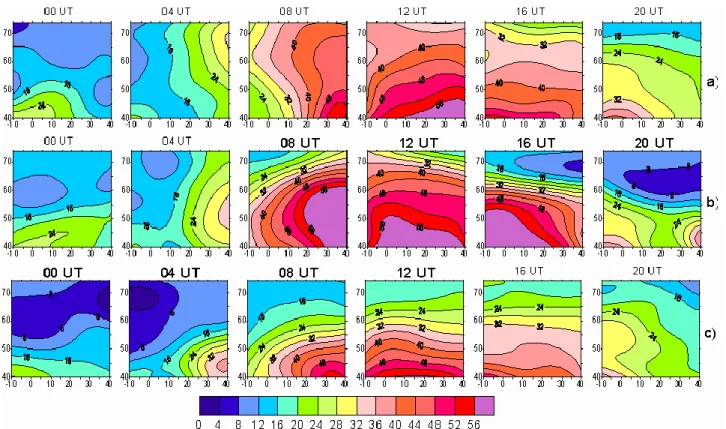
In Fig. 3 maps of TEC for a quiet day, 27 April 2001 (Fig. 3, top row) and the two disturbed days of the geo-magnetic storm, 28 and 29 April 2001 (Fig. 3, middle and bottom row, respectively) are presented. For the quiet day, as expected, the TEC increased through the morning hours, reaching a maximum close to noon, and then decreased in the evening. At times (e.g. 04:00–08:00 UT), there was a strong east to west gradient. Prior to the commencement of the magnetic storm (05:00 UT, 28 April 2001), the TEC variations at 00:00 UT and 04:00 UT, 28 April 2001, were very similar to those at the same times on 27 April 2001.
Fig. 3. Observed TEC (bold UT values indicate a storm interval), (a) quiet day of 27 April, (b) disturbed day of 28 April, and (c) disturbed day of 29 April. Numbers on the scale are TEC in units of 1016m−2.
However, once the storm had started, there were significant differences between the quiet and disturbed days for the same hours. The clearest feature was the development of a deep and relatively narrow trough in the TEC, which can be seen at eastern longitudes and ∼70◦N latitude at 16:00 UT on 28 April 2001. By 20:00 UT on 28 April 2001, this trough had moved equatorward such that it was then centred at 65◦N lat-itude at 20:00 UT. At 00:00 UT on 29 April 2001, the trough extended across the whole map, but occurred at lower lati-tudes in the west and had become somewhat broader and by 04:00 UT on 29 April 2001 it had become present only in the west. Other features in the TEC following the storm onset include an increase in TEC at latitudes below 60◦N,
particu-larly evident at 08:00 UT on 28 April 2001, but also present at 12:00 UT and 16:00 UT on that day. In addition, there were lower values of TEC at latitudes greater than 60◦N from 08:00 UT to 16:00 UT on 29 April 2001, although the lower latitude values of TEC were comparable to the quiet day values at this universal time. By the end of 29 April 2001, the TEC values at all latitudes were comparable to those on 27 April 2001.
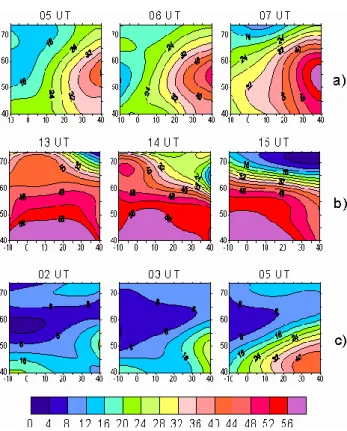
It is instructive to also look at the TEC maps during the expansion phases of the three individual substorms that oc-curred during this storm (Fig. 4). During substorm 1 (Fig. 4a) there was a smooth time variation in TEC with higher TEC in the east and an increase at all longitudes with time. Since similar behaviour was observed for quiet conditions, it ap-pears that no significant changes to the TEC occurred during
this expansion phase. The only minor change is a small re-duction in TEC at 07:00 UT at high latitudes (>70◦N). Dur-ing the second substorm (Fig. 4b), there were some large-scale irregularities and strong gradients in the TEC. For ex-ample, there were enhancements in the TEC at 13:00 UT at latitudes above 60◦N which were not present at 12:00 UT on 27 April 2001 (Fig. 3, top row), isolated structures at 14:00 UT, and finally, a much larger latitudinal gradient at 15:00 UT than was present at 16:00 UT on the quiet day (Fig. 3, top row). The TEC during the third substorm (Fig. 4c) is dominated by the trough structure and generally low levels of TEC, as discussed above.
3.2 Oblique incidence soundings for the Murmansk-St. Pe-tersburg path
Several key parameters indicative of the HF propagation conditions, and hence of ionospheric conditions, were de-termined from an oblique incidence sounding undertaken over the path from Murmansk to St. Petersburg (midpoint geographic 64.5◦N, geomagnetic 60◦N). The parameters included F2MOF (maximum observed frequency for sig-nals reflected from the F2-layer) and F2LOF (lowest ob-served frequency for signals reflected from the F2-layer). EMOF, ELOF, EsMOF, and EsLOF were similarly de-fined for signals reflecting from the E and sporadic-E-(Es)-layers, respectively. Here we consider sporadic-E as an E-layer with a higher than expected critical frequency
Fig. 4. Observed TEC during the expansion phases of three sub-storms: (a) Number 1 of 28 April, (b) Number 2 of 28 April, and
(c) Number 3 of 29 April. Numbers on the scale are TEC in units of 1016m−2.
without distinguishing between the formation mechanisms. It is likely, however, that the sporadic-E observations made here are related to auroral particle precipitation. An addi-tional parameter, DeltaF2MOF, was defined as the deviation of F2MOF from the 10-day quiet median, such that negative values of DeltaF2MOF indicate that the F2MOF is less than the equivalent 10-day quiet mean value. Note that the MOF depends on the ionospheric electron density profile, while the LOF depends on the level of ionospheric absorption and on a range of system parameters including the transmitter power and antenna gains (Milan et al., 1998).
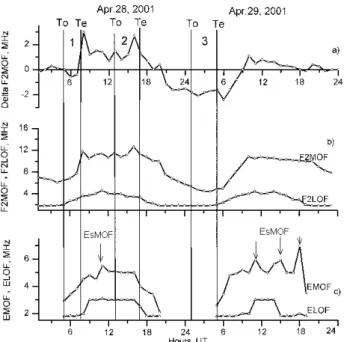
The variations of the parameters defined above during the magnetic storm on 28–29 April for the Murmansk to St. Pe-tersburg path are presented in Fig. 5. Figure 5a presents DeltaF2MOF, while Fig. 5b presents F2MOF and F2LOF. In Fig. 5c, EMOF, ELOF, EsMOF and EsLOF are presented. The times when propagation was by sporadic-E are indicated by the horizontal lines. Finally, Figs. 5d and e present the X component from the Sodankyla observatory of the IMAGE magnetometer network and the Sodankyla riometer, respec-tively. At the time of the first substorm there was a nega-tive X component bay of some 250 nT at Sodankyla, even though the local time of this station was near 07:00 MLT. In-creased absorption occurred at Sodankyla, but only towards the end of the interval of the first substorm (Fig. 5e). Dur-ing this substorm, vertical soundDur-ings made at St. Petersburg
Fig. 5. Oblique sounding measurements made on the path Murmansk-St. Petersburg during a magnetic storm of (a) DeltaF2MOF, (b) F-region MOF and LOF, and (c) E-region MOF and LOF. Measurements made at Sodankyla, Finland (near to path mid-point) of (d) X-component of geomagnetic field, and (e) ri-ometer absorption A (dB) at 32 MHz.
and Sodankyla (data not shown) indicate that the ionosphere was not essentially altered. Note that Sodankyla is poleward and to the west of the midpoint for the Murmansk-St. Pe-tersburg path. For two or three hours before the onset of the substorm, DeltaF2MOF increased from negative values, reaching a maximum positive value at To (05:00 UT).
To-wards the end of the substorm expansion phase DeltaF2MOF decreased, which was due to a decrease in the measured F2MOF at the time (Fig. 5b, upper panel). This was fol-lowed by a marked increase after Te which was a result of
a large increase in measured F2MOF. DeltaF2MOF then fell to zero during the following few hours. Similar behaviour of DeltaF2MOF during and following an isolated substorm of moderate intensity was reported by Blagoveshchensky and Borisova (2000), Blagoveshchensky et al. (1992, 1996 and 2003) and named the “main effect”. We note that at the path midpoint (64.5◦N, 32◦E) the TEC values increase by
∼50% from 05:00 to 07:00 UT (Fig. 4 top row), although at 08:00 UT the TEC values at the path midpoint on 28 April 2001 were ∼25% less than those on 27 April 2001. The decrease in F2MOF towards the end of the substorm sug-gests a decrease in the maximum electron density at the mid-point, which is inconsistent with the increase in TEC val-ues. Furthermore, the large positive DeltaF2MOF after Te
Fig. 6. Oblique ionospheric measurements made on the path Inskip–Leicester, 28–29 April 2001, of (a) DeltaF2MOF, (b) F-region MOF and LOF, and (c) E-F-region MOF and LOF.
also implies an increased density at the path midpoint, again inconsistent with the TEC decrease from quiet to disturbed values.
Substorm 2, which resulted in the largest value of the AE index during this interval, was accompanied by high absorp-tion (Fig. 5e) and changes in the ionosphere measured by vertical incidence sounding at St. Petersburg and Sodankyla (data not shown). DeltaF2MOF was initially negative at the start of this substorm and a sharp decrease occurred at 15:00 UT. The main phase of the magnetic storm began at 13:00 UT when Dst and IMF Bz values were negative
(Fig. 2), some 30 min before the onset of this substorm. Here the large increase in DeltaF2MOF at the end of the substorm was absent. The most likely reason for this is probably the development of the intense trough in ionisation which oc-curred at 15:00 UT (Fig. 4, middle row). The decline in F2MOF and F2LOF and the subsequent increase in the nega-tive values of DeltaF2MOF are all associated with the trough that forms across the oblique propagation path. Furthermore, after 19:00 UT the propagation by the F2 path was lost due to the presence of the sporadic-E on the path. This was also the case throughout the interval of the third substorm, which was also characterised by the largest absorption values ob-served by Sodankyla. This implies particle precipitation into the D- and E-regions during this substorm in the vicinity of the oblique propagation path.
After the F2 propagation path returned at 05:00 UT on 29 April, the DeltaF2MOF was still considerably negative, which is consistent with the weaker levels of TEC at this time compared with the quiet day levels. However, from 06:00 UT onwards there was a steady increase in DeltaF2MOF towards
a value of zero which was finally reached at 15:00 UT. We also note that after F layer propagation returned there was still enhanced absorption along the path, as evidenced by the high value of F2LOF, which is consistent with the high val-ues of the riometer absorption at Sodankyla.
3.3 Comparison with the oblique incidence soundings for the Inskip − Leicester path
The midpoint of the Inskip-Leicester path (170 km) is located at mid-latitudes (geographic latitude 53◦, geomagnetic lat-itude 51◦), although propagation can sometimes be affected by auroral features to the north (Siddle et al., 049, 052, 2004), as opposed to the subauroral path from Murmansk to St. Pe-tersburg (geomagnetic latitude 60◦). The main results are
presented in Fig. 6, in a similar way to those for Murmansk-St. Petersburg (Fig. 5). The intervals when the three sub-storms (1, 2 and 3) identified earlier occurred are also shown. During the first substorm, the “main effect” occurred very clearly on the Inskip to Leicester path. The rise in DeltaF2MOF was slightly less than on the higher latitude path but, nevertheless, was still significant and also occurred, as a result of a large increase in the F2MOF. As noted by Blagoveshchensky and Borisova (2000), Blagoveshchensky et al. (1992, 1996 and 2003), the “main effect” commonly occurs during substorms at both middle and high latitudes. Unlike the higher latitude path, the “main effect” is also seen during the second substorm, although weaker and start-ing from a higher value of DeltaF2MOF. However, again the feature is caused by a rise in F2MOF. There is no such evidence for the “main effect” during the third substorm, however, which occurred when the DeltaF2MOF was signifi-cantly negative. This large negative value began at 20:00 UT on 28 April 2001 and continued until 08:00 UT on 29 April 2001. It is clear from the TEC observations that this is a re-sult of the very low values of TEC during this time frame along this path (Fig. 3, middle and bottom rows).
The behaviour of the ionization in the E-layer during the magnetic storm is different at middle and high latitudes. The Es-layers observed continuously at high latitudes are not present at all times at middle latitudes (for example, at 15:00 UT and 18:00 UT on 29 April). This suggests that the behaviour of the E-layer during this storm was more localised than the F-region storm effects.
3.4 Doppler measurements for the Murmansk-St. Peters-burg path
In addition to the OIS operating on the Murmansk-St. Peters-burg path, an HF Doppler sounder (Andreev et al., 1995) was also operational on the path for 3 specific intervals, 16:00– 21:00 UT, 28 April 2001, 01:00–10:00 UT, 29 April 2001 and 18:00–23:59 UT, 29 April 2001. The first and second of these intervals were coincident with the expansion and re-covery phases of substorms 2 and 3, respectively, while the third interval occurred during the quiet period following the recovery phase of the storm. The operational frequency, fop,
Fig. 7. Sonogram for Murmansk-St. Petersburg between 16:26 and 16:45 UT on 28 April 2001. Numbers on the colour scale are power spectrum values, arbitrary units.
of this system was centred at 5.93 MHz and the bandwidth is between −30 and +30 Hz of this centre frequency.
The data from the HF Doppler sounder are in sonogram format, each of which lasted for 20 min, and Fig. 7 is a rep-resentative example from the first of the three intervals. Uni-versal time increases from the bottom of the panel upwards, while the frequency axis presented here is between −9 Hz and +8 Hz of the centre frequency, which is the frequency range during this interval in which there was significant re-ceived signal amplitude. To summarise the data from the sonograms, Table 1 presents certain average characteristics, to which we refer during the following discussion.
Three important characteristics can be identified from the sonograms. The width of the Doppler spectrum, 1fD(Hz),
provides information on the propagation mode, such that the smaller this value, the less disturbed the propagation path. During quiet periods 1fD was in the range 1–3 Hz. This
in-creased during the substorm expansion and recovery phases, however, to values between 10 and 30 Hz. Figure 7, taken from the expansion phase of substorm 2, illustrates that the width at any given time is typically larger than 3 Hz, although this is mainly due to the presence of extra traces in the sono-gram (see below). Figure 8, taken from the late expansion
Fig. 8. Sonogram for Murmansk-St. Petersburg between 05 :00 and 05:46 UT on 29 April 2001. Numbers on the colour scale are power spectrum values, arbitrary units.
phase or early recovery phase of substorm 3, illustrates a width of some 5 Hz or more. If the central frequency of the Doppler sounder exceeded the MOF, either via E- or F-regions, then there would have been a transition from signal reflection to scattering from irregularities and consequently, a broadening of the spectrum. For much of the first interval of sonogram recording (16:00–21:00 UT on 28 April 2001), the operational frequency was less than F2MOF and propagation would have been via a sporadic-E mode. For the first hour of the second interval, fopwas greater than the propagation
fre-quency via either the F- or E- region. These times are clearly illustrated by the high values of 1fDgiven in Table 1. Note,
based on the OIS data, the cases when fopare larger than the
MOF are not accompanied by either multimode or multi-path propagation.
The second characteristic that can be identified from the sonograms are wave disturbances which cause a change in the central frequency of the propagation mode as a result of small changes in the reflection height of the signal. The wave period (Tw)and amplitude fDmax(Hz) can be identified from
the sonogram. Two types of waves are known to cause such changes in the reflection height. ULF waves, or geomagnetic
Fig. 9. Sonogram for Cyprus-St. Petersburg between 02:00 and 02:46 UT on 29 April 2001. Numbers on the colour scale are power spectrum values, arbitrary units.
pulsations, have periods typically in the 10-s range. Atmo-spheric gravity waves result in travelling ionoAtmo-spheric distur-bances (TIDs) and these have longer periods, typically in the several minutes range. On the Murmansk to St. Petersburg path, the periods that were seen were characteristic of ULF waves. Longer period gravity waves were seen on a lower lat-itude path between St. Petersburg and Cyprus (Fig. 9). Gen-erally, under quiet conditions, waves of both types were ab-sent.
The third and final characteristic that can be determined from the sonograms is the presence of additional modes of propagation which is indicated by the presence of additional traces. The amplitude of the frequency deviation from the centre frequency in Hz of these additional traces is given in Table 1 and found to vary from −10 to +18 Hz, depending on time. These additional traces (see, for example, Fig. 7) were only found during the expansion phase of the substorm or immediately afterwards.
The results obtained have shown that the Doppler spec-tra on the high-latitude Murmansk-St. Petersburg path are always relatively broad. The broad spectra can arise either
due to scatter from ionospheric irregularities or from addi-tional traces due to different propagation modes. This proba-bly implies a highly-structured ionosphere on this path under dynamic substorm conditions.
3.5 Doppler measurements for the Cyprus-St. Petersburg path
For the Cyprus-St. Petersburg path (9410 kHz and 12095 kHz), the variations of Doppler spectra at 9410 kHz are well correlated with those on 12 095 kHz. Furthermore, ray-tracing calculations showed that the point of reflection of the wave with a frequency 9410 kHz in the F2-layer of ionosphere was about 22 km lower than the point of reflec-tion of the wave with a frequency 12 095 kHz. Therefore, only sonograms for 9410 kHz signals will be presented here. A sonogram taken during the expansion phase of substorm Number 3 (02:00 to 03:00 UT on 29 April 2001) for this path is presented in Fig. 9. Here the Doppler width 1(fD)is ∼4 Hz and there are wave disturbances with a quasi-period (Tw)of 30 min and amplitude (fDmax)2 Hz, but, as with the
Murmansk − St. Petersburg path at this time, there are no additional traces indicating only one propagation mode. The wave processes are likely to be medium-scale travelling iono-spheric disturbances (TIDs). From the Doppler measure-ments in Fig. 9, it is possible to estimate some values of the TID parameters. According to Afraimovich (1982), tenta-tive estimates of the wave disturbance amplitude M, the low border of horizontal wavelength, 3, the velocity of the wave screen movement, or TID phase velocity, V, and the intensity of disturbance of electron concentration, relative amplitude of a wave disturbance, δ, can be obtained from the following
M =Tw·(fDmax) · λ · (1/2π ), 3=2π · Zo · (M/2Zo)1/2, V =3/Tw,
δ=M/2Zo,
where Twis the period of the wave disturbance, fDmaxis the
wave amplitude as measured by the Doppler sounder, λ is the wavelength of the HF radio wave, and Zois the height of
reflection.
If we take Zo as 250 km, and λ as 32 m and the
val-ues of the parameters from Fig. 9 are Tw=30 min, and
fDmax=2 Hz, then we obtain estimates for M of 18 km, 3=300 km, V=167 m/s, δ=3.6×10⁻². These values are sim-ilar to those obtained by other observation methods (Stocker et al., 2000).
From Fig. 7, the ionospheric velocity near the signal re-flection position is determined by the equation (Afraimovich, 1982)
V =(λ·fDmax)/2·cosφ,
where φ is the wave incidence angle on the ionosphere. Cal-culations give V=175 m/s, which represents the maximum
Table 1. Doppler characteristics and OIS data on the path Murmansk-St.Petersburg. fopis the frequency of the Doppler signal (5930 kHz).
Date Time, UT Doppler characteristics Oblique ionospheric sounding
1fD, Hz Tw, min fDmax, Hz Amplitude of additional traces, Hz 28 April 2001 16:00– 17:00 6 6 5–7 −10 ÷ +5 fop≤F2MOF 17:00– 18:00
10 3 2 −4 ÷ +8 fop≤F2MOF fop<EsMOF
18:00– 19:00
30 2 1,5 −5 ÷+8 fop<EsMOF fop≥F2MOF
19:00– 20:00 30 − − − fop<EsMOF 20:00– 21:00 16 − − − fop<EsMOF 29 April 2001 01:00– 02:00
25 − − −6 ÷+18 fop EsMOF fop≤EsLOF
02:00– 03:00
4 2 1 − fop EsMOF fop<EsLOF
03:00– 04:00
Signal is not detected fop EsLOF
04:00– 05:00 10 5 magnetic pulsations: 30 s 3 magnetic pulsations: to 8 Hz −4 ÷ 0 fop≤F2MOF fop≤EsLOF 05:00– 06:00 9 5 magnetic pulsations: 40 s 3 magnetic pulsations: to 8 Hz
− fop EsMOF fop<F2MOF
velocity of the plasma under the influence of the propagat-ing TID.
To summarise, the Doppler spectra on the Murmansk-St. Petersburg and Cyprus-St. Petersburg were made. It was found that the width of the Doppler spectra on the mid-latitude path was significantly narrower than on the higher-latitude path for all examined events. Also, the TID parame-ters estimated from the sonograms are typical medium-scale TID values and are similar to previous observations (e.g. Stocker et al., 2000 and references therein). We cannot, how-ever, in this instance, identify the source of the TIDs. 3.6 Observations by the CUTLASS radar
The two CUTLASS radars (Lester et al., 1997), one located in Iceland and one in Finland form the eastern pair of radars of the Northern Hemisphere element of the Super Dual Au-roral Radar Network, SuperDARN (Greenwald et al., 1995). The CUTLASS radars have a common observing volume over and to the north of Scandinavia. A combination of the measurements from the two radars enables the ionospheric convection velocity vector perpendicular to the Earth’s mag-netic field to be determined. During the interval of interest, however, observations in the vicinity of the Murmansk-St. Petersburg path are limited to the Finland radar.
There were three main intervals of ionospheric backscat-ter during the storm inbackscat-terval. The first of these was from 05:30 UT to 10:30 UT and consisted of scatter from the
F-region at the far ranges of the radar is field of view, i.e. at much higher latitudes than we are interested in here. There-fore, we do not consider this scatter further in our discus-sion. The other two intervals are of scatter from the E-region and occurred close to the mid-point of the Murmansk-St. Pe-tersburg path. The data in Fig. 10 are from 12:00 UT on 28 April to 11:00 UT on 29 April, which corresponds to the most disturbed part of the magnetic storm described above (Figs. 2 and 5). The geographic latitudes indicated in Fig. 10 range from 60◦, which corresponds to that of St. Petersburg, to 69◦, corresponding to Murmansk. Note that the Han-kasalmi radar is located at 62◦latitude. The data from beam 15 of the Hankasalmi radar can approximately be compared with Doppler and OIS measurements on the Murmansk-St. Petersburg path, as it is directed northward and is approx-imately parallel to but displaced in longitude by about 3◦
from the Murmansk-St. Petersburg path. In Fig. 10, the ex-pansion phases of substorms Number 2 and Number 3 are indicated by the vertical lines, and the times at which the Doppler records presented in Figs. 7–9 are also indicated on Fig. 10.
The top panel in Fig. 10 illustrates the ionospheric backscattered power. Prior to 14:00 UT on 28 April, no ionospheric scatter was observed. However, during sub-storm 2, there was an interval when intense irregularities were concentrated near the midpoint of the Murmansk-St. Petersburg path on φ=64.5◦. These irregularities disappeared
Fig. 10. Ionospheric scatter observed by CUTLASS Finland radar during a magnetic storm 28–29 April, (a) power, (b) velocity, and (c) spectral width.
after the end of the expansion phase of substorm 2. During substorm 3, there was a larger region of less intense radar backscatter.
The Doppler velocity of the irregularities responsible for the ionospheric scatter is shown in the middle panel of Fig. 10. The first patch of scatter had Doppler velocities which were typically less than 200 m s−1 away from the radar. Investigation of the data on the other radar beams dur-ing this interval indicates that the Doppler velocity was neg-ative on all beams, with the larger values in the west of the field of view. This is consistent with an overall westward ve-locity in this region. Comparison with TEC maps in Figs. 2 and 3 indicates that the irregularities occurred at latitudes at the equatorward gradient in TEC associated with the trough which formed following the onset of the main phase of the storm. The second interval of scatter had Doppler velocities which tended to be weakly negative. Although highly vari-able, the nature of the velocities on the other beams is con-sistent with the eastward flow at this time.
E-region irregularities tend to fall into two types: those caused by the two stream instability and those which are gen-erated by the gradient drift instability (Hunsucker and Harg-reaves, 2003). Normally the former have Doppler veloci-ties which saturate at the local ion acoustic speed, typically
between 300 m s−1and 400 m s−1in the auroral ionosphere
and small values of spectral width. Conversely, irregulari-ties generated by the latter mechanism have velociirregulari-ties which are lower than the ion acoustic speed and have larger spectral widths. During the first interval, the spectral widths tend to be large, suggesting that they were generated by the gradient drift instability. During the second interval, when the scatter was much weaker, there was a mixture of large and small val-ues of spectral width. Comparison with the TEC maps again indicates that the scatter occurred close to a gradient in TEC but a much weaker one on this occasion.
4 Physical interpretation of obtained results
4.1 Current understanding
The current understanding and recent advances in the study of ionospheric storms have been reviewed in many publi-cations (e.g. Buonsanto, 1999; Gonzales, 1994; Lastovicka, 2002). It is known that ionospheric storms result from large energy inputs to the upper atmosphere associated with geo-magnetic storms. The latter occur during unusually disturbed conditions in the solar wind, often related to an interplane-tary shock impacting the magnetosphere but always requiring an extended interval of southward IMF. The energy inputs to the upper atmosphere take the form of enhanced electric fields, currents, and energetic particle precipitation. Strong electric fields combine with increased conductivities result-ing from energetic particle precipitation to give substantial electric currents and consequently strong Joule heating of the atmospheric gases. There is also frictional heating due to collisions between the plasma accelerated by the large elec-tric fields and the ambient neutral gas. Either way, the neu-tral gas is heated, creating pressure gradients which modify the global thermospheric circulation. There are changes in neutral air winds and composition which result in changes to rates of production and loss of ionization. The modified electron densities, in turn, modify the ion drag on the neu-trals. Disturbed neutral winds also cause F-region electric fields by the disturbance dynamo mechanism. These electric fields redistribute the plasma, affecting production and loss rates. Storm-related electric fields may also destabilize the plasma, producing irregularities.
Rapid expansion of the neutral atmosphere due to heat-ing at high latitudes may cause upwellheat-ing, i.e. the motion of air through constant pressure surfaces. Enhanced equa-torward winds transport the composition changes to lower latitudes, so that one can see a “composition disturbance zone” of increased mean molecular mass reaching from high to middle latitudes. The equatorward winds often take the form of traveling atmospheric disturbances (TADs) when the heating events are impulsive. They manifest themselves in the ionosphere as large-scale traveling ionospheric distur-bances (TIDs). Equatorward of this zone, poleward neutral winds may occur and convergence of these winds results in downwelling which decreases the mean molecular weight at
constant pressure levels. A decrease in the mean molecular mass would lead to increases in NmF2 and TEC while an
in-crease in the mean molecular mass due to upwelling leads to decreases in NmF2 and TEC. A rise in the F2 peak height to a
region of reduced loss due to equatorward winds would also produce increases in NmF2. Similarly, a drop in hmF2 due
to poleward winds reduces NmF2. As a result of the local
time variation of winds at middle latitudes, negative iono-spheric storm effects are most often seen in the morning sec-tor and positive ssec-torm effects in the afternoon and evening. When NmF2 or TEC perturbations are studied according to
storm time, i.e. time from onset of the disturbances, the typ-ical storm shows an initial positive phase followed by a neg-ative phase, with the duration and strength of the two storm phases, depending on latitude and season (Buonsanto, 1999). 4.2 28–29 April 2001 magnetic storm origin
The moderate geomagnetic storm discussed in this paper is unusual in a number of respects. The positive phase of the storm, i.e. when Dstis positive, is unusually long, starting as
a result of the shock impact at 05:00 UT and lasting for 7 h, during which time the IMF was predominantly northward. Only after the IMF turned southward did the main phase of the storm begin.
The second unusual aspect of this storm is that it consisted of 3 major, but separate substorms, where major is defined here as an interval where AE exceeded 500 nT. Larger storms often result in a number of substorm activations but it is not simple to separate them in terms of the typical substorm phases. The first of the three substorms was unusual in itself. To start with the expansion phase onset was coincident with the sudden impulse caused by the shock impact. Investiga-tion of the AL and AU indices revealed that the contribuInvestiga-tion to the initial rise in AE was from the AU index rather than the AL index which is the case for normal substorms. The AL index does subsequently make the largest contribution to the AE index, after 05:30 UT, and there was a secondary intensification in AE at 06:30 UT which was a result of a rapid change in AL. Furthermore, the substorm was initiated despite there being no significant interval of southward IMF for many hours prior to the onset. Compressions of the mag-netosphere as a result of enhanced solar wind pressure have recently been seen to cause a major change in the particle precipitation into the auroral zones and hence the size and shape of the auroral oval (e.g. Boudouridis et al., 2003).
The onset of the main phase of the storm was 13:00 UT which was some 30 min prior to the onset of the second sub-storm. This substorm did have several intervals of southward IMF prior to the expansion phase onset, at 13:30 UT, and therefore did have a true growth phase. The expansion phase was the most disturbed of the three, in terms of amplitude of AE and also lasted the longest. The final substorm occurred at the peak of the main phase and following this event the storm appears to have started its recovery phase.
To summarize, the storm consisted of 3 separate sub-storms, the first of which was caused by the shock in the solar
wind impacting on the magnetosphere. The second substorm was responsible for the onset of the negative phase of the magnetic storm, while the storm recovery phase began at the end of the third substorm.
4.3 Delta F2MOF and TEC variations
There are two separate measures of the changes in iono-spheric electron density presented in this paper. The maps of TEC covering a geographic latitude range from 40–75◦N
and a geographic longitude range from −10 to 40◦E, based on GPS measurements, are the first measure. The propa-gation frequencies on two paths, one at high latitudes Mur-mansk to St. Petersburg, and one at mid latitudes, Inskip to Leicester, are the second, since F2MOF is equivalent to the maximum electron density at the path midpoint, assuming a single hop propagation.
The TEC maps demonstrate two key results. Firstly, some 3 h after the onset of the storm, the TEC at mid latitudes had increased by some 50% or more above the quiet day level and this remained the case until 16:00 UT. Note, however, that there appeared little change in TEC during the expan-sion phase of the first substorm. The increase in ionization at mid latitudes was probably the result of upwelling of ion-ization at high latitudes which is then transported equator-ward by the interaction with neutral winds. This seems to have occurred during an interval of strong ionospheric cur-rents, notably indicated by the AE, AL and AU indices, but not necessarily electric fields, since the IMF remained north-ward during this initial part of the storm. Therefore, current flow at high-latitudes caused heating and upwelling, result-ing in dynamical and composition changes which ultimately led to higher densities at mid-latitudes. The time scale for this process was of the order of 2 h, which is approximately the length of the expansion phase of the first substorm.
The second feature in the TEC maps is a deep ionization trough which formed at higher latitudes and was clearly vis-ible at 15:00 UT (Fig. 4, middle row) but may have been present at higher latitudes than could be measured before this time. These results are confirmed by the estimates of NmF2 based upon the F2MOF observations. On the mid lat-itude path the DeltaF2MOF was positive from 08:00 UT to 18:00 UT, while at higher latitudes, although positive from 08:00 UT to 12:00 UT, it remained negative thereafter. The trough is most likely to have been the result of high elec-tric fields, following the southward turning of the IMF. This is demonstrated by the fact that there was an equatorward motion of the trough with time, which would have been due to the equatorward motion of the ionospheric convection as the southward IMF took hold, as well as the rotation of the viewing area to later magnetic local times. The CUTLASS observations in Fig. 10 do indicate that the westward flow did pick up near 64◦N at 13:30 UT and inspection of the other radars demonstrate strong westward flows at higher latitudes which did appear to move equatorward in this time frame.
Finally, there appears to be a discrepancy following sub-storm 1 between the TEC observations and the DeltaF2MOF
from the St.Petersburg-Murmansk path, where the TEC ob-servations indicate an decrease at the path midpoint while DeltaF2MOF indicates an increase. Since TEC integrates the total number of electrons along the path from receiver to transmitter and the DeltaF2MOF is dependent only upon the local plasma frequency at the reflection location (path mid-point for 1 hop propagation), it is perhaps not surprising that discrepancies do exist. Re-distribution of plasma with al-titude, which is likely under these circumstances could be the reason for these discrepancies but further detailed stud-ies would be required, including knowledge of the maximum electron density at the path mid-point.
4.4 The “main effect”
The ionospheric effect of an isolated substorm has been doc-umented elsewhere (Blagoveshchensky and Borisova, 2000; Blagoveshchensky et al., 1992; Blagoveshchensky et al., 1996; Blagoveshchensky et al., 2003). This effect, referred to as the main effect, can be summarized as the following tem-poral variation of Delta foF2, an increase some 6–8 h before
the expansion phase onset, followed by a decrease until the end of the expansion phase, after which there is another in-crease. Only isolated substorms with a sharp onset to the ex-pansion phase and a duration of not more than several hours demonstrate this effect (see references above).
The enlargement of Delta foF2 values at high and middle
latitudes before a substorm onset is a result of lifting the F2 layer (or hmF2) caused by the vertical drift. The latter arises,
firstly, due to the electric field origin and, secondly, due to the meridional equatorward winds. One can see the “main effect” for Delta F2MOF on Figs. 5 and 6.
In the first substorm, the effect is seen clearly at both mid and high latitudes, in particular the sharp rise at the end of the expansion phase onset. In the second event, the effect is seen only at mid-latitudes as a result of the trough in TEC impacting upon the propagation at high latitudes. However, since the main effect is only associated with substorms which are isolated, then we conclude that the first two substorms can be considered isolated in the sense of their impact on the ionosphere. This demonstrates, therefore, that the storm not only had large-scale effects but also the smaller scale effects which are normally seen during smaller substorms. This fur-ther supports the view that this storm was the result of sev-eral substorms adding together separately. In addition, the cause of the lack of the “main effect” on the two paths is different. On the high-latitude path, there is significant ab-sorption which does not allow the HF signal to propagate via the F-region, while at the lower latitudes, the path mid-point is within the TEC trough and consequently, no propagation path can be established.
5 Conclusions
During the High Rate GPS/GLONASS measuring campaign (HIRAC), simultaneous experimental measurements were
made, some results of which are presented here. The nature of the experimental campaign, involving a range of different radio techniques, such as GPS, oblique incidence sounding, vertical incidence sounding, HF Doppler, and an HF coherent scatter radar, CUTLASS, provides an entirely different way of looking at the ionospheric storm effects. In addition, we note that the magnetic storm responsible for the ionospheric effects, which is classified as moderate, is relatively unusual in that it consists of 3 separate individual substorms, the first of which is triggered by the compression in the solar wind.
The main results and conclusions can be summarised as follows:
1. The GPS observations of TEC demonstrate the forma-tion of a well-defined trough following the southward turning of the IMF. This was most likely caused by the enhanced electric fields associated with the south-ward turning and subsequent equatorsouth-ward expansion of the ionospheric convection pattern. This trough im-pacted the observations on the high-latitude path of the “main effect” during the second substorm. This demon-strates the importance of the multi-diagnostic experi-mental campaign.
2. The TEC observations also indicated an enhancement in TEC at lower latitudes, some 2–3 h after the storm onset. This enhancement is most likely a result of the enhanced currents which were present at the time in the high-latitude ionosphere. These currents cause heating and upwelling, altering the composition and the wind field, also generating atmospheric waves, and re-distributing plasma to lower latitudes where it increases the TEC.
3. The “main effect” on ionospheric propagation during substorms was observed during the first 2 substorms on the mid-latitude path and during the first substorm on the high-latitude path. This observation is in accordance with previous observations of this effect, which gen-erally occur during isolated substorms. As mentioned above, the trough in TEC appeared to impact on the ob-servation of the main effect as did the absorption on the high-latitude path during the third substorm. We also note the presence of the main effect in association with the first substorm, which was unusual, apparently being triggered by a magnetospheric compression.
4. At the time the trough was present within the CUT-LASS Finland radar’s field-of-view, the ionospheric ir-regularities present were clearly co-located with a gradi-ent in the TEC. Although the irregularities responsible for the ionospheric scatter observed by the radar were likely to be in the E-region, the coexistence of the TEC gradient and the irregularities is of direct interest to un-derstanding the physical mechanism for the generation of these irregularities. This study demonstrates the po-tential for such overlapping data sets.
5. The results are chiefly in a good agreement with the picture of our current understanding of physical pro-cesses which develop during a magnetospheric storm. However, the mechanism which causes the ionospheric “main effect” is not simply explained and there is a ne-cessity for further study of this problem.
6. The behaviour of the oblique sounding characteristics on the subauroral Murmansk–St. Petersburg path were primarily determined by ionospheric variations leading to changes in the radio propagation and by the level of absorption in the lower ionosphere. The propagation behaviour at high and mid latitudes was similar when the signal was reflected from the F2-layer, but different when the signal was reflected from the E-layer.
7. The Doppler spectral width is at a maximum (10–30 Hz) during the substorm expansion and recovery phases, while under the quiet conditions the width is 1–3 Hz. The spectral broadening is probably associated with the presence of ionospheric irregularities during disturbed conditions and also depends to a degree on the propaga-tion mode. The wave disturbances observed during the substorm expansion and recovery phases were found to have periods between 2 and 30 min. Under quiet con-ditions, wave disturbances were usually observed. The parameters of the medium-scale travelling ionospheric disturbances (TID) derived from the measurements are similar to those previously reported. Additional tracks on sonograms are not observed during the expansion phase of a substorm or immediately after it, while at other times the tracks are absent.
Acknowledgements. The authors would like to express their
grati-tude to colleagues at the Sodankyla Observatory and the compilers of the NASA catalogue edited by J. H. King for a possibility of us-ing their data accessed over the INTERNET, as well as to M. A. Sergeeva and A. V. Pyatkova, who are postgraduates at St. Peters-burg University of Aerospace Instrumentation, for their help in data processing.
The CUTLASS Finland radar is supported by PPARC, the Swedish Institute for Space Physics, Uppsala, and the Finnish Meteorologi-cal Institute.
This work was facilitated through financial support on grant PST/CLG No980327.
The Editor in chief thanks I. McCrea and B. Reinisch for their help in evaluating this paper.
References
Afraimovich E. L.: Interference methods in ionospheric radio sounding. Nauka, M., 197 p. (in Russian) 1982.
Andreev A. D., Blagoveshchenskaya N. F., and Kornienko V. A.: Ionospheric wave processes during HF heating experiments, Adv. Space Res., 15, 1245–1248, 1995.
Blagoveshchensky D. V. and Borisova T. D.: Substorm effects of ionosphere and HF propagation, Radio Science, 35, (5), 1165– 1171, 2000.
Blagoveshchensky D. V., Egorova L. V., and Lukashkin V. M.: High-latitude ionospheric phenomena diagnostics by high-frequency radio wave propagation observations, Radio Science, 27, (2), 267–274, 1992.
Blagoveshchensky, D. V., Borisova, T. D., and Egorova, L. V.: Pre-and after substorm situations in the ionosphere Pre-and decameter radio wave propagation (in Russian), Geomagn. Aeron., 36(4), 125–134, 1996.
Blagoveshchensky, D. V., Maltseva, O. A., and Rodger A.,S.: Iono-sphere dynamics over Europe and western Asia during magneto-spheric substorms 1998–1999, Ann. Geophys., 21, 1141–1151, 2003,
SRef-ID: 1432-0576/ag/2003-21-1141.
Boudouridis, A., Zesta, E., Lyons, L. R., Anderson, P. C., and Lum-merzheim, D.: Effect of solar wind pressure pulses on the size and strength of the auroral oval, J. Geophys. Res., 108(A4), 8012, doi:10.1029/2002JA009373, 2003.
Buonsanto, M. J.: Ionospheric storms − a review, Space Sci. Re-views, 88, 563–601, 1999.
Gonzalez, W. D., Joselyn, J. A., Kamide, Y., et al.: What is a geo-magnetic storm?, J. Geophys. Res., 99(A4), 5771–5792, 1994. Greenwald, R. A., Baker, K. B., Dudeney, J. R., Pinnock, M., Jones,
T. B., Thomas, E. C., Villain, J.-P., Cerisier, J.-C., Senior, C., Hanuise, C., Hunsucker,R. D., Sofko, G., Koehler, J., Nielsen, E., Pellinen, R., Walker, A. D. M., Sato, N., and Yamagishi, H.: Darn/Superdarn: A global view of the dynamics of high-latitude convection, Space Sci. Reviews, 71, 761–796, 1995.
Hunsucker, R. D. and Hargreaves, J. K.: The high-latitude iono-sphere and its effects on radio propagation. Cambridge Univer-sity Press, 2003.
Lastovicka, J.: Monitoring and forecasting of ionospheric space weather - effects of geomagnetic storms, J. Atmos. and Solar-Terr. Phys., 64, 667–705, 2002.
Lester, M., Jones, T. B., Robinson, T. R., Thomas, E. C., Yeoman, T. K., Pellinen, R., Huuskonen, A., Opgenoorth, H., Persson, M., Pellinen-Wannberg, A., and Haggstrom, I.: CUTLASS − A tool for co-ordinated Cluster/Ground Based investigations of the Solar Terrestrial System, in Satellite-Ground Based Source Book, ESA SP-1198, (Eds.) Lockwood, M., Wild, M. N., and Opgenoorth, H. J., ESA Publ., ESTEC, Noordwijk, The Nether-lands, 191–202, 1997.
Milan S. E., Lester, M., Jones, T. B., and Warrington, E. M.: Ob-servation of the reduction in the available HF band on four high-latitude paths during periods of geomagnetic disturbance, J. At-mos. and Solar-Terr. Phys., 60, 617–629, 1998.
Shagimuratov, I. I.: Monitoring of the ionosphere with using GPS. In: book of abstracts of the International conference on problems of geocosmos, 3–8 June 2002, St. Petersburg, Russia, 102–103, 2002.
Siddle D. R., Stocker, A. J., and Warrington, E. M.: The time-of-flight and direction of arrival of HF radio signals received over a path along the mid-latitude trough: observations, Radio Science, 39, RS4008, doi:10.1029/2004RS003049, 2004.
Siddle D. R., Zaalov, N. Y., Stocker, A. J., and Warring-ton, E. M.: The time-of-flight and direction of arrival of HF radio signals received over a path along the mid-latitude trough: theoretical considerations, Radio Science, 39(RS4008), doi:10.1029/2004RS003052, 2004.
Stocker A. J., Arnold, N. F., and Jones, T. B.: The synthesis of trav-elling ionospheric disturbance (TID) signatures in HF radar ob-servations using ray tracing, Ann. Geophys., 18(1), 56–64, 2000, SRef-ID: 1432-0576/ag/2000-18-56.