Publisher’s version / Version de l'éditeur:
Analytical Chemistry, 82, 7, pp. 3086-3093, 2010-03-12
READ THESE TERMS AND CONDITIONS CAREFULLY BEFORE USING THIS WEBSITE.
https://nrc-publications.canada.ca/eng/copyright
Vous avez des questions? Nous pouvons vous aider. Pour communiquer directement avec un auteur, consultez la Questions? Contact the NRC Publications Archive team at
[email protected]. If you wish to email the authors directly, please see the first page of the publication for their contact information.
NRC Publications Archive
Archives des publications du CNRC
This publication could be one of several versions: author’s original, accepted manuscript or the publisher’s version. / La version de cette publication peut être l’une des suivantes : la version prépublication de l’auteur, la version acceptée du manuscrit ou la version de l’éditeur.
For the publisher’s version, please access the DOI link below./ Pour consulter la version de l’éditeur, utilisez le lien DOI ci-dessous.
https://doi.org/10.1021/ac100229k
Access and use of this website and the material on it are subject to the Terms and Conditions set forth at
Versatile thin-film reactor for photochemical vapor generation
Zheng, Chengbin; Sturgeon, Ralph E.; Brophy, Christine; Hou, Xiandeng
https://publications-cnrc.canada.ca/fra/droits
L’accès à ce site Web et l’utilisation de son contenu sont assujettis aux conditions présentées dans le site LISEZ CES CONDITIONS ATTENTIVEMENT AVANT D’UTILISER CE SITE WEB.
NRC Publications Record / Notice d'Archives des publications de CNRC: https://nrc-publications.canada.ca/eng/view/object/?id=fada45b1-5741-4a88-b860-7658fb8f140b https://publications-cnrc.canada.ca/fra/voir/objet/?id=fada45b1-5741-4a88-b860-7658fb8f140b
Thin film hydride generation: determination of ultra-trace copper by
flow injection in-situ hydride trapping graphite furnace AAS
Chengbin Zhenga,b, Ralph E. Sturgeon*aand Xiandeng Houb
a Institute for National Measurements Standards, National Research Council Canada,
Ottawa, Ontario, Canada, K1A 0R6.
bCollege of Chemistry, Sichuan University, Chengdu, Sichuan, 610064, China.
ABSTRACT
A novel system which significantly enhances copper hydride generation efficiency was used for the determination of trace copper by coupling a flow injection system to a graphite furnace for in-situ collection of the analyte and subsequent AAS detection. A single device integrated the functions of hydride generator and gas liquid separator. Solutions of the sample, acidified to 1 % formic acid, and tetrahydroborate reductant were merged to yield a thin film wetting a reaction surface from which product vapor was efficiently liberated and transported to the heated furnace. Optimum operating conditions provided for a generation / transport / collection efficiency of 8-12%. Interferences from common transition and noble metals were effectively eliminated. A limit of detection of 60 pg ml-1 was obtained based on processing a 5 mL sample volume with a precision of better than 4% (RSD) at 1 ng mL-1. The methodology was successfully applied to the determination of Cu in several NRCC natural water and biological tissue Certified Reference Materials.
INTRODUCTION
Chemical vapor generation (CVG) has developed into a widely used sample introduction methodology to improve the sensitivity and limits of detection in atomic spectrometry owing to its advantages of high reaction yield and sample introduction efficiency, as well as ease of matrix separation, analyte preconcentration, and potential application for speciation analysis without chromatographic separation.1 Hydride generation (HG) has become the most popular CVG approach for determination of elements such as As, Sb, Bi, Ge, Sn, Pb, Se, Te, Hg and Cd. Unfortunately, CVG techniques, especially HG, tend to lose some of their appeal because of their rather limited scope of application.
CVG is currently undergoing a resurgence of interest. Following the report of detection of a volatile species of copper generated by merging its acidified sample solution with sodium tetrahydroborate,2a significant effort has arisen to use the acid-tetrahydroborate system to form (volatile) species of transition and noble elements (Ag, Au, Fe, Cr, Co, Cu, Ni, Os, Pd, Rd, Rh, Tl and Zn) which can be phase separated and transported to detectors by a carrier gas.3-16Because there is little information on either the identity of the species generated, or the reaction mechanism, such studies remain largely in a state of debate due to the complex nature of the reaction and the rather low generation efficiency. Several studies suggest that the metal ions are reduced to unstable reaction intermediates by tetrahydroborate, ultimately producing free atoms, hydrido-metal complexes and nanoparticles.5, 17-19 However, the resultant species are not stable in solution, and thus extended residence time results in analyte precipitation or decomposition, leading to decreased product yield. Such characteristics determine, to a great extent, the analytical figures of merit for these techniques and limit their scope of analytical application.
Significant efforts have thus been invested to overcome these shortcomings, including use of “enhancement” regents and modifiers to improve reaction efficiencies.18, 20
All published investigations reveal that detection of (volatile) transition and noble metal species is only achieved under conditions facilitating rapid gas-liquid phase separation of the product1. This also appears to reduce interferences from transition and noble metals during hydride generation of conventional elements.21, 22 Over the past several years, a number of successful approaches based on use of solid or immobilized reagents for CVG have been investigated with a view to reducing interferences or improving generation efficiency. Thus, Tian et al.23 developed a novel reduction bed hydride generator by coating a mixture of KBH4 and solid organic acid powders onto the surface of a moveable paper tape. The sample was dropped onto the immobilized bed and the volatile species immediately swept to the detector, obviating the need for a gas-liquid separator. This substantially reduced interference from zinc and iron. Solid NaBH4 / organic acid was also reported for hydride generation of lead.24 These approaches are only suited to the processing of microliter sample volumes. Solid NaBH4or SnCl2reagents have also been coated onto other supports to permit larger volume sampling.25-27. However, such immobilized reductants are not entirely suitable for hydride or cold vapor generation due to their gradual consumption during the analysis process, leading to poor precision. In this regard, Yu and Wang28coated NaBH
4onto several different tube materials, renewing it during each run to permit long-term operation for mercury cold vapor generation. Sturgeon et al.21, 22, 29-31 investigated several approaches based on a modified Meinhard nebulizer or Scott spray chamber to achieve rapid reactions and product separation from the liquid phase. Rapid mixing of the sample and reductant solutions by co-nebulizing
them permitted very short reaction times (below 100 ms) within the nebulizer assembly, leading to virtual suppression of interferences from transition and noble metals on the hydride generation of selenium. Brindle introduced a multimode sample introduction system which has also proven useful for rapid separation and reduction of interferences from transition and noble metals.32-34
The aim of this work was to undertake flow injection thin film hydride generation of copper with its subsequent trapping in a graphite furnace to enhance its determination by AAS. Thin film hydride generation possesses the advantages of rapid reaction and fast separation of the unstable copper species from the liquid phase. It is noteworthy that this approach also separates the analyte in a “dry” gaseous form, permitting in-situ trapping in a graphite furnace as opposed to nebulization based techniques. Additionally, the thin film hydride generator provides a large surface area and long reaction time compared to nebulization approaches, which together enhance the extent of the reaction and the efficiency of transfer of soluble reaction products to the gas phase.
EXPERIMENTAL SECTION Instrumentation
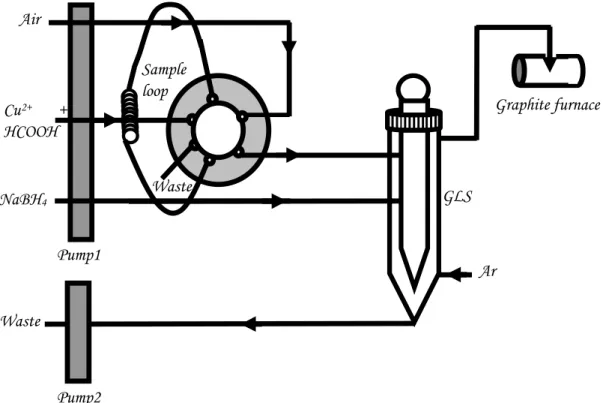
The gas-liquid separator (GLS) unit from a Tekran Instruments series 2600 automated water analysis system (Toronto, Canada) served as both the thin film generator and the gas-liquid separator. This device consists of a 1 cm diameter central glass rod whose surface has been etched and housed within a concentric glass tube, as illustrated in Figure. 1. The rod is 27 cm long; the external glass housing is 30 cm long with an id of 1.6 cm.
A six port series 9010 injection valve (Rheodyne, IDEC Corp, CA) fitted with a 1 ml polytetrafluoroethylene (PTFE) sample loop was used in series with a four channel minipuls 2 peristaltic pump (Gilson, Middleton, WI) for transport of all liquids to m the thin film generator. A second, two channel pump, served to independently remove waste solution from the bottom of the reactor. Acidified sample and sodium tetrahydroborate reductant were simultaneously delivered to the generator, the two solutions merging at the head of the central glass rod over the surface of which the reaction mixture then flowed. A third channel of the pump served to evacuate the waste solution from the bottom of the reactor, as presented in Figure1.
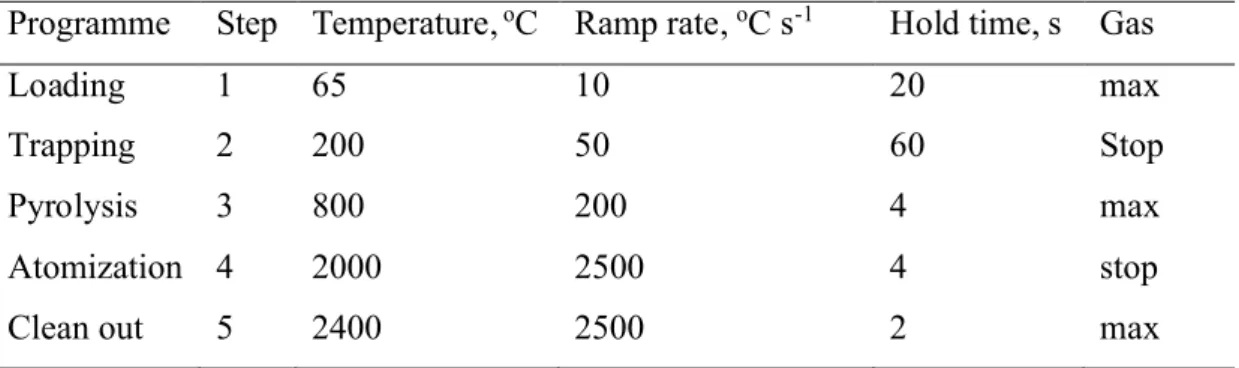
Volatile analyte was swept by a 500 ml min-flow of1Ar gas, introduced at the bottom of the thin-film generator, into the graphite furnace via a 30 cm length of 1.1 mm i.d PTFE tubing which was connected to a final 10 cm length of 1.0 mm i.d quartz tubing. The quartz tip was manually inserted through the dosing hole of the graphite furnace during the analyte trapping process and retracted before atomization of the deposited sample. Atomic absorption measurements were accomplished with an Analytik Jena AG model ZEEnit® 60 (Analytik Jena, Germany) fitted with a standard transverse heated graphite atomizer (THGA) and a copper hollow cathode lamp (wavelength, 324.7 nm; slit setting, 0.2 nm; lamp current, 4 mA) operated under the conditions summarized in Table 1. Peak area (integrated absorbance) was recorded.
Reagents and samples
All solutions were prepared using 18 MΩ-cm deionized water (DIW) produced by reverse osmosis of tap water followed by deionization (Barnstead/Thermoline, Dubuque,
IA, USA). Working solutions were prepared daily by diluting a 1000 mg l-1stock solution of copper with high purity formic acid ((88%, GFS, Canada) to yield solutions of varying concentration of the latter so as to permit the effect of formic acid on response to be evaluated. Nitric, hydrochloric and sulfuric acids were purified in-house prior to use by sub-boil distillation of reagent grade feedstock in a quartz still. Solutions of NaBH4(Alfa Chemicals Inc., Newburyport, MA, USA) were prepared daily at a concentration of 1% (m/v) in 0.1% (m/v) NaOH (BDH Inc., Toronto, ON, Canada). Argon was of high purity and obtained from Praxair Products Inc. (Mississauga, ON, Canada).
Several environmental and biological certified reference materials (CRMs) were analyzed for validation of the accuracy of the technique, including National Research Council Canada (NRCC) open ocean sea water (NASS-5), coastal seawater (CASS-4), river water (SLRS-4), dogfish muscle (DORM-3) and Dogfish Liver Tissue (DOLT-4).
Analytical procedure and sample preparation
The sequence of operations characterizing vapor generation of copper, its collection and atomization was similar to that reported earlier35 for the flow injection photo-CVG determination of nickel by in-situ collection GFAAS. The process is briefly outlined below. Solutions of copper standard or prepared samples containing 1% HCOOH were initially pumped into the 1 ml sample loop through the six-port injection valve. The quartz tip at the end of the gas transfer line was inserted into the injection port of the furnace so as to be suspended approximately 1 mm above the interior tube wall; the heating program of the furnace was initiated. The injection valve was then manually positioned to permit the sample to be flushed to the generator by a flow of air propelled by the pump. Simultaneously, a solution of NaBH4was also introduced to the generator
via a second channel of the peristaltic pump. Generation of the volatile copper species
(assumed to be the hydride)2was initiated at the confluence of the two thin liquid films as they merged on the surface of the central glass rod. The volatile product was rapidly separated from the thin liquid film during its flow down the rod and transported to the graphite furnace in a flow of Ar. The furnace was maintained at 200 oC for 60 s to complete the trapping process. The waste channel pump operated continuously to evacuate liquid from the bottom of the reactor at about 4.0 ml min-1. A brief pyrolysis at 800 oC for 4 seconds was applied to the furnace in an effort to ensure removal of any moisture from water vapor that may have condensed at the cooler extremities of the tube during the analyte deposition process. No impact of this pyrolysis temperature on response could be discerned. The quartz tip was then removed from the furnace, the atomization cycle (2000 oC for 4s) and subsequent clean out (2400 oC for 2 s) were completed and the signal recorded. The graphite furnace program is summarized in Table 1.
Several Certified Reference Materials were prepared and analyzed for their copper content in an effort to illustrate the efficacy of the proposed procedure. No prior sample treatment was undertaken for SLRS-5 river water, whereas an evaporative preconcentration step was used for NASS-5 and CASS-4 seawaters because of their low concentrations of copper. For this, sub-samples of NASS-5 and CASS-4 were evaporated from 50 ml to 20 ml and 5 ml, respectively. Sufficient HCOOH was then added to the concentrates to reconstitute the volumes to 25 and 10 ml, respectively, prior to analysis such that a 1 % HCOOH concentration was established. 1,10 phenanthroline at a concentration of 0.0005% (m/v) was added to all sample and standard solutions. Solutions
of DORM-3 muscle tissue and DOLT-4 liver tissue were prepared following microwave assisted acid digestion procedures reported earlier35 and diluted 100- and 200-fold, respectively, with 1% HCOOH containing 0.0005% (m/v) 1,10 phenanthroline. Quantitation was achieved against external calibration curves in all cases.
RESULTS and DISCUSSION
In contrast to conventional hydride generation, wherein solutions of NaBH4and acidified sample are typically mixed in a reaction coil before being flushed to a GLS, in this study they were separately delivered onto the surface of the central rod where they merged as a thin film in which the reaction occurred. This particular design resulted in the following advantages: (i) intimate mixing of reagents was promoted; (ii) excessive frothing due to hydrogen generation was reduced; (iii) rapid and very efficient separation of volatile reaction products could be realized through the thin liquid film; (iv) less water (aerosol free) could be transported to the furnace; and (iv) a longer residence time promoting an efficient reaction was realized. Because the system variables were sequentially optimized with respect to response from copper and multivariate techniques were not used, the optimal parameters may not have been precisely realized.
Optimization of GF-AAS parameters
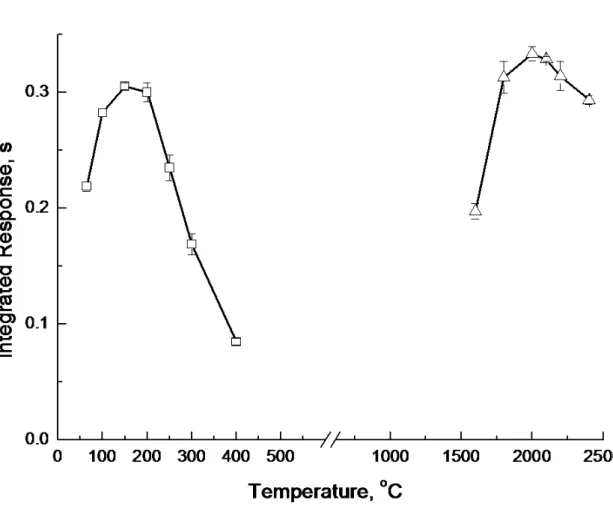
The optimum operating conditions for GF-AAS are summarized in Table 1. The trapping temperature was varied over the range 65 - 400 oC while using a fixed Ar flow rate of 400 ml min-1. Results are shown in Figure 2. As expected, analyte trapping occurs at relatively low temperature, in accordance with the relative instability of the generated species.2 Greater than 70% of optimum response could be achieved with the furnace at
65 oC (the lowest temperature permissible). Response decreased at trapping temperatures higher than 150 0C. In accord with earlier studies,35 subsequent experiments revealed that the optimum trapping temperature was also dependent on the carrier gas flow rate. This is addressed in further detail later.
No chemical modifiers (Pd or Ir permanent modifiers) were used in an effort to lower the trapping temperature and, as was also the case for nickel35, their presence did not noticeably enhance the performance characteristics of the system.
Fixing the trapping temperature at 150 oC and the carrier gas flow rate at 400 ml min-1, the atomization temperature was optimized. Results are presented in Figure 2. A relatively stable response is apparent in the range 1800-2400 and, in order to maximize the lifetime of the graphite tube, a temperature of 2000 oC was selected for subsequent experiments.
Optimization of generation conditions
A series of NaBH4 solutions (THB) stabilized in 0.05% NaOH was used to investigate effect on response. Above 1 % NaBH4the reaction was extremely vigorous and produced copious bubbles, leading to difficulty on mixing of the reactant solutions. Furthermore, excess water vapor was generated which condensed in the transport tube and resulted in the loss of some analyte. High concentrations of THB also elevated the blank. A solution of 1.0% THB was ultimately selected based on a compromise between signal intensity and background (blank).
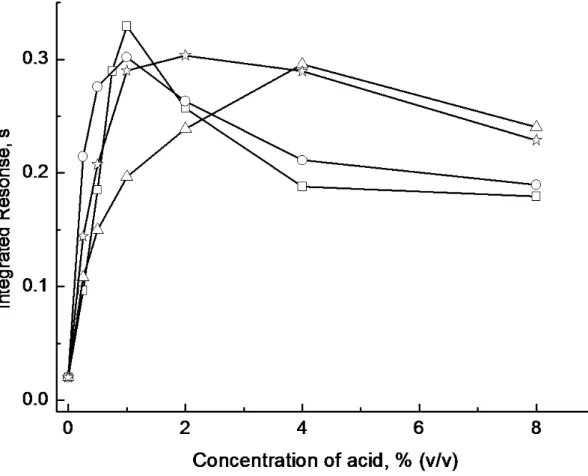
The acidity of the sample is also a factor significantly affecting generation efficiency. Current literature is not in agreement with respect to the impact of HCl and HNO3on the hydride generation of copper.2, 36, 37The influence of several inorganic and organic acids,
including HCl, HNO3, H2SO4, H3PO4, HCOOH, CH3COOH, and CH3CH2COOH, as well as their concentration, was thus investigated. The effect of concentration of several selected acids is shown in Figure 3. Volatile product can be generated from a variety of acidic media and fortuitously even in HNO3, which is particularly beneficial as this acid is required in many digestion procedures and it would otherwise be necessary to remove it prior to analysis. Compared to inorganic acids, HCOOH is “greener” and its optimal concentration is lower, with the consequence that 1% HCOOH was selected as the reaction medium for subsequent experiments.
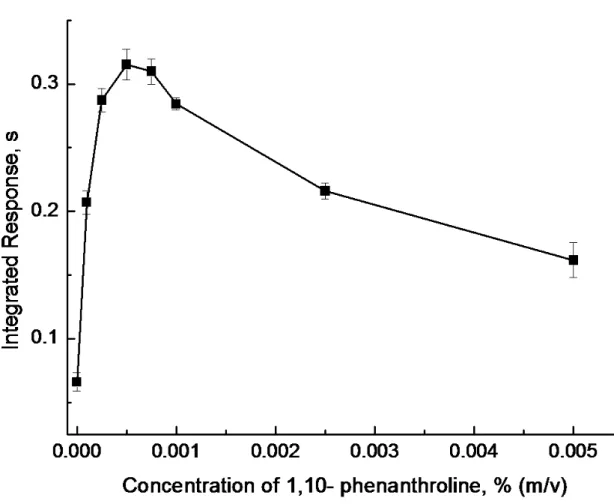
Various inorganic and organic reagents have been used as chemical modifiers to enhance the CVG efficiencies of transition and noble elements, including cobalt and ascorbic acid for Cd,38 DDTC for Au,15,39 1.10-phenanthroline for Cu, Cd, Ni and Zn,20, 40 8-hydroxyquinoline for Zn and Cd,20, 40 reduced palladium or Triton-100 in combination with an antifoaming for Ag,18, 19as well as room temperature ionic liquids for Cu, Ag and Au.41 In the present work, several organic reagents were investigated as potential chemical modifiers for hydride generation of copper, including EDTA, DDTC, thiourea, 1,10-phenanthroline and hydroxyquinoline. Amongst these, 1,10-phenanthroline and 8-hydroxyquinoline provided a significant enhancement effect, with the former being better. Figure 4 illustrates the effect on response by the addition of 1,10-phenanthroline to the sample solution; a 0.0005% (m/v) concentration was selected as optimal, producing an approximately 10-fold enhancement in response.
Optimization of separation and transport parameters
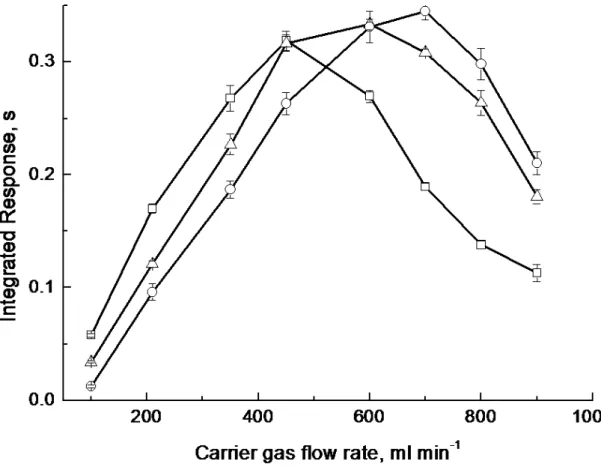
A relationship exists between the carrier gas flow rate and the optimum trapping temperature because of the cooling effect of the gas flow on the local environment of the
quartz tube at the tip of the transfer line and the tube surface35. Decomposition of analyte on the inner surface of quartz tip occurs when the trapping temperature is elevated and the carrier gas flow rate is low, leading to decreased response. Fixing the trapping temperature at 200 oC, the impact on response with increase of carrier gas flow rate was evaluated in the rage 100-900 ml min-1. Signal increased with increase in carrier flow rate up to 500 ml min-1 because of efficient separation of analyte from liquid phase and/or minimization of sorption of hydride onto the inner surface of the transport tube. Above 500 ml min-1, the local trapping temperature of the graphite tube was depressed due to cooling by the gas flow and resulted in a lower trapping efficiency. These relationships are evident from Figure 5. Response at lower trapping temperatures is improved compared to higher temperatures when a low carrier gas flow rate is used. An Ar flow rate of 500 ml min-1 was selected for subsequent experiments in combination with a trapping temperature of 200 oC.
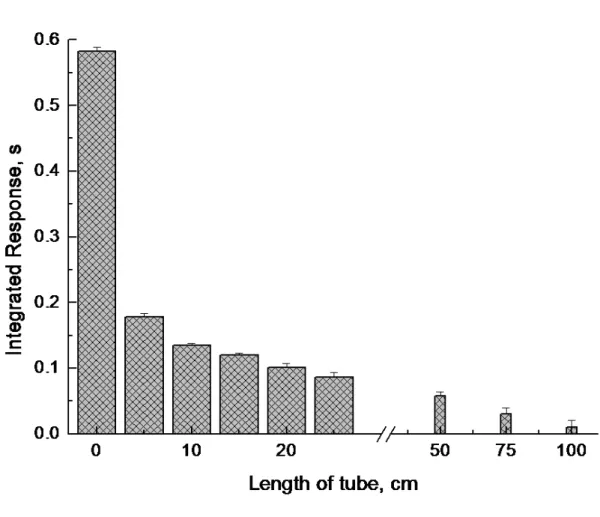
All published studies support the conclusion that response is dependent on efficient mixing of the reaction solutions followed by rapid separation of analyte from the liquid phase.2 To support this point, a length of tubing (“reaction tube”, 1.1 mm id) was inserted just prior to the thin film generator in which pre-mixing of the reaction solutions could occur. As shown in Figure 6, response was strongly dependent on the length of the mixing tube, it being suppressed 3-fold when using only a 5 cm line. Presumably, the nascent analyte is unstable and easily decomposed if not subjected to immediate phase separation. This highlights the inherent and unique advantage of the thin film hydride generator in that the process of phase separation begins as soon as the reaction is initiated.
Moreover, as the reactant solutions flow as a thin film over the surface of the central rod, the large surface area promotes intimate mixing, efficient reaction and effective phase separation.
The rate at which sample and reductant are supplied to the reactor influence the effectiveness with which the system performs as it is essentially kinetically driven. Above a sample delivery rate of 2.8 ml min-1(1.2 ml min-1reductant) response decreased, a consequence of insufficient time for either complete reaction or complete separation of the product from the liquid medium. As the kinetics of these two processes are fixed, high flow rates of solution serve to “truncate” the reaction and decrease response.
The effect of sample volume on response was investigated using a solution containing 1 ng ml-1Cu which was delivered using 0.1, 0.5, 1.0, 2.0, 3.0, 5.0, and 8.0 ml sample loops. Signal increases with increase in sample volume up to 5.0 ml and is limited by the inherent short linear range of the AAS spectrometer. Correspondingly, a larger volume of NaBH4 is required, which results in a larger blank, however. A sample volume of 1 ml was therefore used for the subsequent experiments, unless otherwise noted.
As increasing the length of the transfer line between the thin film generator and the graphite furnace reduces response,2a length as short as possible was selected, with 30 cm being the minimum practical tube length used here.
Generation efficiency
Hydride generation efficiency differs widely, from tenths to tens of percent, depending on the approach used for its evaluation. This leads to considerable confusion in the literature. One popular method used for estimation of efficiency is comparison of response obtained using the proposed method with that arising from use of an alternative sample
introduction system when coupled to the same detector. Thus, by comparison of hydride introduction with pneumatic nebulization, Xu36and Pohl42reported a CVG efficiency of 9 -18% (decreasing with increasing analyte concentration) and 2.3 % respectively, for Cu. However, the exact value assigned to the nebulizer/ spray chamber system is frequently unknown. Moreover, it is difficult to guarantee that both methods are operated under otherwise the same experimental conditions. Another frequently used method is based on assessment of the residual amount of analyte in the post-reaction solution. The efficiency derived in this manner is relatively high, suggesting that the reaction is very efficient. However, the corresponding signal enhancement is often relatively poor. Efficiency estimated in this way may not correspond to the actual “on-line” efficiency. The hydrides of transition and noble metals appear to be very unstable and trend to decompose to metal complexes or nanoparticles in solution as well as be deposited onto the surfaces of transport tubing, resulting in loss of analyte. Efficiencies of 49% and 85 – 90% for Cu are given by Sturgeon2and Luna6, respectively, using this method.
For in-situ trapping GF-AAS, hydride generation efficiency consists of several stages, including formation, transport, trapping and atomization of the analyte. Therefore, the overall CVG efficiency (
ε
CVG) can be expressed as:ε
CVG =ε
genε
tranε
trapε
atwhere εgen, εtran εtrap and εat correspond to the efficiencies of generation, transport, trapping and atomization, respectively. The most straightforward means of estimating
ε
CVGis to compare the responses for an identical mass of analyte “consumed” or processed using the proposed method to that arising from direct injection of a solution equivalent to
the same mass of analyte. The sampling efficiency for direct injection is 100%. Based on this approach, the efficiency of the proposed method was determined to be in the range 8~12% (based on response from hydride generation consuming 1 ml of a 1 ng ml-1 solution compared to direct injection of 20 μl of a solution of 10 ng ml-1). The absorbance-time profiles for the copper signal were identical for both the direct injection mode and the hydride generation mode of introduction, thereby enabling accurate comparison of the integrated responses.
Interferences
Interferences arising from transition and noble metal ions are a major shortcoming of conventional hydride generation systems. Such ions are very easily reduced to their metallic state or to colloidal forms which then scavenge or decompose analyte hydrides before they can be separated from the liquid phase. Clearly, a similar “auto-interference” may arise during generation of the transition or noble metal hydrides themselves; thus reduced copper may serve to subsequently decompose its hydride in the liquid phase and result in a significant suppression in efficiency. As well, reduction in signal is encountered with a longer transport tube between the thin-film reactor and the furnace. Interference effects arising from 17 concomitant ions, including classical hydride-forming elements as well as transition and noble metal ions, were investigated and results are summarized in Table 2. Despite earlier reports of serious interference arising from Ag(I) and Ni(II) for the hydride generation of copper37, no significant interference from any of the above ions was noted in this study. The rapid separation provided by the thin film generator effectively minimizes such interferences.21, 22
Figures of merit
Several calibration curves were established using CVG by changing the volume of the sample loop, as shown in Figure 8. These data were generated several weeks after the original sets of experiments detailed above were completed, owing to a renovation of the laboratory; it is evident that there was a change in the sensitivity of the GFAAS system (approximately 30 % decrease) during this time interval. No attempt was made to establish the cause. Coefficients of determination for any fixed sample volume were better than 0.99 and the LOD, defined as the analyte concentration equivalent to 3s of 11 measurements of a blank solution, was 0.1 ng ml−1(based on a 1 ml sample volume). It is evident that the sensitivity is related to the sample volume processed and can be enhanced by increasing the test volume. Contrary to the sensitivity, the LOD can not be significantly improved in this manner because of the corresponding increase in the blank arising from the increased volume of NaBH4 solution required. A freshly prepared 1% solution of NaBH4 (in 0.2 % NaOH) contained approximately 0.4 ng ml-1Cu. The major source of this contamination was identified as arising from the NaBH4. The impurity concentration could be reduced to about 0.2 ng ml-1 by storage of 8% (m/v) NaBH
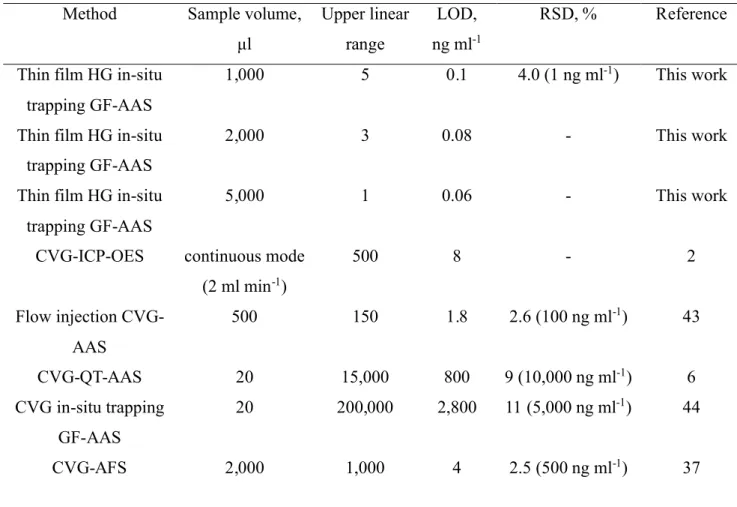
4 (containing 1.6% NaOH) for four days in pre-cleaned polyethylene screw-capped bottles followed by filtration through a 0.2 μm membrane filter and dilution to 1% (m/v) before use. It is evident that the LOD can only be significantly improved by removing residual contamination from the reductant. Table 3 summarizes figures of merit characterizing the current methodology and compares performance for the thin film generator approach with that of similar published analytical methods.
Analytical application
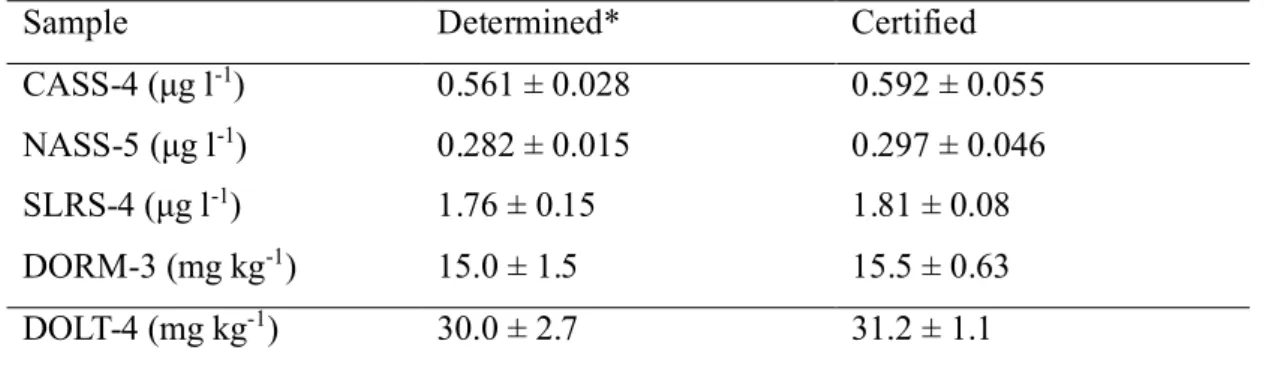
The accuracy of the proposed method was evaluated by analysis of several NRCC natural water and biological tissue CRMs. Considering the blank, a 1 ml loop was used to introduce all samples. Quantitation of copper in all CRMs was based on external calibration curves. Standards were prepared in 1% HCOOH containing 0.0005% (m/v) 1,10 phenanthroline. Analytical results are summarized in Table 4. It is clear that the proposed method provides reliable and accurate results for the determination of copper in real samples.
Conclusion
A simple and cost-effective flow injection thin film hydride generator has been successfully used for sample processing with in-situ trapping GF-AAS, permitting determination of copper in natural waters and biological tissues. This approach not only significantly enhances hydride generation efficiency of copper, but also minimizes interferences from transition and noble metals. Ongoing work in our laboratory is exploring applications of this methodology for hydride generation of other transition and noble metals as well as the minimization of interferences on classical hydride-forming elements.
ACKNOWLEDGEMENTS
C. B. Zheng thanks the National Natural Science Foundation of China (No.20805032), the Research Fund for Young Faculty at Sichuan University (Grant No. 2007-0750), and the NRCC for financial support while in Canada.
R
References
1 R.E. Sturgeon and Z. Mester,Appl. Spectrosc.,2002, 56, 202A–212A.
2 R.E. Sturgeon, J. Liu, V.J. Boyko and V.T. Luong, Anal. Chem., 1996, 68, 1883-1887. 3 P. Pohl, TRAC-Trend. Anal. Chem.,2004, 23, 21–27.
4 Y.-L. Feng, J.W. Lam and R.E. Sturgeon, Analyst,2001, 126, 1833-1837.
5 Y.-L. Feng, R.E. Sturgeon and J.W. Lam,J. Anal. At. Spectrom.,2003, 18, 1435-1442. 6 A.S. Luna, R.E. Sturgeon and R.C. de Campos, Anal. Chem.,2000, 72, 3523-3531. 7 X. Du and S. Xu, Anal. Bioanal. Chem.,2001, 370, 1065-1070.
8 P. Pohl and W. Zyrnicki,J. Anal. At. Spectrom.,2001, 16, 1442-1445.
9 T. Matoušek, J. Dědina and M. Vobecký, J. Anal. At. Spectrom.,2002, 17, 52-56.
10 X. Duan, R.L. McLaughlin, I.D. Brindle and A. Conn,J. Anal. At. Spectrom.,2002, 17, 227-231.
11 P. Pohl and W. Zyrnicki, J. Anal. At. Spectrom.,2002, 17, 746-749. 12 N. Panichev and R.E. Sturgeon, Anal. Chem.,1998, 70, 1670-1676. 13 P. Pohl and W. Zyrnicki, J. Anal. At. Spectrom.,2003, 18, 798-801.
14 P. Smichowski, S. Farías and S. Pérez Arisnabarreta, Analyst,2003, 128, 779-785. 15 Z. Li, J. Anal. At. Spectrom.,2006, 21, 435-438.
16 S. Cerutti, S. Moyano, J. Marrero, P. Smichowski and L.D. Martinez, J. Anal. At. Spectrom.,2005 20, 559-561.
17 Y.-L. Feng, R.E. Sturgeon, J.W. Lam and A. D'Ulivo,J. Anal. At. Spectrom., 2005, 20, 255-265.
19 S. Musil, J. Kratzer, M. Vobecky, J. Hovorka, O. Benada and T. Matousek,
Spectrochim. Acta, Part B, 2009, 64, 1240 - 1247
20 H.-W. Sun and R. Suo, Anal. Chim. Acta,2004, 509, 71-76. 21 W.-W. Ding and R. E. Sturgeon, Anal. Chem.,1997, 69, 527–531.
22 C. Moor, J. W. H. Lam and R. E. Sturgeon, J. Anal. At. Spectrom.,2000, 15, 143-149. 23 X.D. Tian, Z.X. Zhuang, B. Chen and X.R. Wang, Analyst,1998, 123, 627–632. 24 N. Maleki, A. Safavi and Z. Ramezani,J. Anal. At. Spectrom.,1999, 14, 1227–1230. 25 S. Tesfalidet and K. Irgum, Anal. Chem.,1989, 61, 2079-2082.
26 W. Chuachaud and J.F. Tyson, J. Anal. At. Spectrom.,2005, 20, 282-288. 27 Y. Rodriguez and J.F. Tyson, J. Anal. At. Spectrom.,2006, 21, 757-762.
28 Y.-L. Yu, Z. Du, M.-L. Chen, J.-H. Wang, J. Anal. At. Spectrom.,2007, 22, 800-806. 29 G.H. Tao and R. E. Sturgeon, Spectrochim. Acta Part B,1999, 541, 481-489
30 Y.L. Feng, R. E. Sturgeon and J. W. Lam, Anal. Chem.,2003, 75 (3), 635-640.
31 Y.L. Feng, J. W. Lam and R. E. Sturgeon, Spectrochim. Acta Part B,2004, 59, 667–675. 32 R.L.J. McLaughlin and I.D. Brindle, J. Anal. At. Spectrom.,2002, 17, 1540-1548.
33 D. Maldonado, J. Chirinos, Z. Benzo, C. Gómez and E. Marcano, J. Anal. At. Spectrom.,
2006, 21, 743 – 749.
34 A. Asfaw and G. Wibetoe, J. Anal. At. Spectrom.,2006, 21, 1027 – 1035.
35 C.B. Zheng, R.E. Sturgeon and X.D. Hou, J. Anal. At. Spectrom.,2009, 24, 1452 – 1458. 36 S.K. Xu, R.E. Sturgeon, Y. Guo, W.M. Zhang and H.F. Zhao, Ann. Chim.-Rome, 2005, 95, 491-499.
37 L. He, X.F. Zhu, L. Wu and X.D. Hou, At. Spectrosc.2008, 29, 93-98. 38 X.W. Guo and X.M Guo, J. Anal. At. Spectrom.,1995, 10, 987-991.
39 S.K. Xu and R.E. Sturgeon, Spectrochim. Acta Part B,2005, 60, 101–107.\ 40 H. W. Sun and R. Suo, Intern. J. Environ. Anal. Chem.,2008, 88, 791-801.
41 C. Zhang, Y. Li, X.-Y. Cui, Y. Jiang and X.-P. Yan, J. Anal. At. Spectrom., 2008, 23, 1372-1377.
42 P. Pohl and W. Zyrnicki, Anal.Chim. Acta,2001, 429, 135-143.
43 H.Y. Zhou, S.K. Xu and Z.L. Fang, Spectrosc. Spect. Anal.,2000, 20, 525-528.
44 A.S. Luna, H.B. Pereira, I. Takase, R.A. Gonçalves, R.E. Sturgeon and R.C. de Campos, Spectroc. Acta Pt. B-Atom. Spectr.,2002, 57, 2047-2056.
Table 1. Graphite furnace programme
Programme Step Temperature,oC Ramp rate,oC s-1 Hold time, s Gas
Loading 1 65 10 20 max
Trapping 2 200 50 60 Stop
Pyrolysis 3 800 200 4 max
Atomization 4 2000 2500 4 stop
Table 2. Effect of concomitant ions on the recovery of copper Mn+ [Mn+], ng ml-1 Recoverya, % Ag+ 2000 (10000) 88 (50) As3+ 10000 96 Au3+ 2000 (10000) 98 (45) Bi3+ 10000 101 Ca2+ 10000 102 Cd2+ 10000 102 Co2+ 2000 (10000) 106 (86) Fe3+ 2000 (10000) 92 (75) Hg2+ 10000 104 Mg2+ 10000 100 Ni2+ 10000 110 Pb2+ 10000 98 Pt4+ 1000 85 Se4+ 2000 (10000) 105 (86) Sn2+ 10000 93 Te4+ 10000 95 Zn2+ 10000 99
aaverage recovery based on three measurements; typical precision of determination was <4% RSD for a 2 ng ml-1solution of copper in 1% HCOOH
Table 3. Analytical figures of merit and comparison of performance with other
methodologies
Method Sample volume,
μl Upper linear range LOD, ng ml-1 RSD, % Reference
Thin film HG in-situ trapping GF-AAS
1,000 5 0.1 4.0 (1 ng ml-1) This work
Thin film HG in-situ trapping GF-AAS
2,000 3 0.08 - This work
Thin film HG in-situ trapping GF-AAS
5,000 1 0.06 - This work
CVG-ICP-OES continuous mode (2 ml min-1) 500 8 - 2 Flow injection CVG-AAS 500 150 1.8 2.6 (100 ng ml-1) 43 CVG-QT-AAS 20 15,000 800 9 (10,000 ng ml-1) 6 CVG in-situ trapping GF-AAS 20 200,000 2,800 11 (5,000 ng ml-1) 44 CVG-AFS 2,000 1,000 4 2.5 (500 ng ml-1) 37
Table 4. Analytical results for Certified Reference Materials
Sample Determined* Certified
CASS-4 (μg l-1) 0.561 ± 0.028 0.592 ± 0.055
NASS-5 (μg l-1) 0.282 ± 0.015 0.297 ± 0.046
SLRS-4 (μg l-1) 1.76 ± 0.15 1.81 ± 0.08
DORM-3 (mg kg-1) 15.0 ± 1.5 15.5 ± 0.63
DOLT-4 (mg kg-1) 30.0 ± 2.7 31.2 ± 1.1
Figures and Captions
Figure 1. Schematic of the instrumental set-up
Figure 2. Effect of trapping and atomization temperature on response from a 1 ml
volume of a solution of 2 ng ml-1Cu2+
□
trapping temperature∆
atomization temperatureFigure 3. Effect of concentration and type of acid on response from a 1 ml volume of a
solution of 2 ng ml-1Cu2+
□
HCOOH○
H2SO4 ☼ H3PO4∆
HNO3Figure 4. Effect of concentration of 1,10-phenanthorline on response from a 1 ml
volume of a solution of 2 ng ml-1Cu2+
Figure 5. Effect on response of carrier gas flow rate and trapping temperature
□
100 oC∆
200 oC○
300 oCFigure 6. Effect of length of mixing (reaction) tube prior to the thin-film generator on
response from a 1 ml volume of a solution of 4 ng ml-1Cu2+
Figure 7. Calibration curves obtained with varying sample loop volumes
□
1 ml○
2 ml∆
5 mlFigure 1. Schematic of the instrumental set-up Graphite furnace Cu2+ + HCOOH Waste GLS Ar Waste Air Sample loop NaBH4 Pump2 Pump1
Figure 2. Effect of trapping and atomization temperature on response from a 1 ml
volume of a solution of 2 ng ml-1Cu2+
Figure 3. Effect of concentration and type of acid on response from a 1 ml volume of a
solution of 2 ng ml-1Cu2+
Figure 4. Effect of concentration of 1,10-phenanthorline on response from a 1 ml volume
Figure 5. Effect on response of carrier gas flow rate and trapping temperature
Figure 6. Effect of length of mixing (reaction) tube prior to the thin-film generator on
Figure 7. Calibration curves obtained with varying sample loop volumes
![Table 2. Effect of concomitant ions on the recovery of copper M n+ [M n+ ], ng ml -1 Recovery a , % Ag + 2000 (10000) 88 (50) As 3+ 10000 96 Au 3+ 2000 (10000) 98 (45) Bi 3+ 10000 101 Ca 2+ 10000 102 Cd 2+ 10000 102 Co 2+ 2000 (10000) 106 (86) Fe 3+ 2000 (](https://thumb-eu.123doks.com/thumbv2/123doknet/14147808.471418/23.892.126.619.220.760/table-effect-concomitant-ions-recovery-copper-recovery-ag.webp)