Architecture of the human GATOR1
and GATOR1–Rag GTPases complexes
The MIT Faculty has made this article openly available.
Please share
how this access benefits you. Your story matters.
Citation
Shen, Kuang, Rick K. Huang, Edward J. Brignole, Kendall J. Condon,
Max L. Valenstein, Lynne Chantranupong, Aimaiti Bomaliyamu, et
al. “Architecture of the Human GATOR1 and GATOR1–Rag GTPases
Complexes.” Nature 556, no. 7699 (March 28, 2018): 64–69.
As Published
http://dx.doi.org/10.1038/NATURE26158
Publisher
Springer Nature
Version
Author's final manuscript
Citable link
http://hdl.handle.net/1721.1/118864
Terms of Use
Article is made available in accordance with the publisher's
policy and may be subject to US copyright law. Please refer to the
publisher's site for terms of use.
Architecture of the human GATOR1 and GATOR1-Rag complexes
Kuang Shen1,2,3,4,†, Rick K. Huang5,†, Edward J. Brignole2,6, Kendall J. Condon1,2,3,4, MaxL. Valenstein1,2,3,4, Lynne Chantranupong1,2,3,4,‡, Aimaiti Bomaliyamu1, Abigail Choe1, Chuan Hong5, Zhiheng Yu5,*, and David M. Sabatini1,2,3,4,*
1Whitehead Institute for Biomedical Research and Massachusetts Institute of Technology,
Department of Biology, 9 Cambridge Center, Cambridge, MA 02142, USA
2Howard Hughes Medical Institute, Department of Biology, Massachusetts Institute of Technology,
Cambridge, MA 02139, USA
3Koch Institute for Integrative Cancer Research, 77 Massachusetts Avenue, Cambridge,
MA02139, USA
4Broad Institute of Harvard and Massachusetts Institute of Technology, 7 Cambridge Center,
Cambridge, MA 02142, USA
5Howard Hughes Medical Institute, Janelia Research Campus, 19700 Helix Drive, Ashburn, VA
20147, USA
6Department of Biology, Massachusetts Institute of Technology, 77 Massachusetts Avenue,
Cambridge, MA 02139, USA
Abstract
Nutrients like amino acids and glucose signal through the heterodimeric Rag GTPases to activate mTORC1. Several protein complexes regulate the Rag GTPases, each serving as the effector of a distinct sensing branch of the pathway. One such regulator is GATOR1, which consists of Depdc5, Nprl2, and Nprl3, and is a GTPase Activating Protein (GAP) for RagA. Loss of GATOR1 renders mTORC1 signaling insensitive to nutrient starvation. Despite its central role in mTORC1
signaling, none of the GATOR1 components have sequence homology to other proteins, so the function of GATOR1 at the molecular level is unknown. Here we used Cryo-EM to solve two structures: GATOR1 alone and GATOR1 bound to the Rag GTPases. GATOR1 adopts an extended architecture with a cavity in the middle. Nprl2 serves as a link between Depdc5 and Nprl3, and Depdc5, the largest GATOR1 subunit, contacts the Rag heterodimer. Biochemical analyses reveal that our GATOR1-Rag structure represents an inhibitory state and that at least two binding modes must exist between the Rag GTPases and GATOR1. The direct interaction of Depdc5 with RagA
*Co-corresponding author. yuz@janelia.hhmi.org (Z.Y.), sabatini@wi.mit.edu (D.M.S.), Tel: 571-209-4353 (Z.Y.); 617-258-6407
(D.M.S.), Fax: 617-452-3566 (D.M.S.).
‡Present address: Harvard Medical School, 200 Longwood Avenue, Boston, MA 02115, USA †These authors contribute equally to this work.
Author contributions
K.S. and D.M.S. initiated the project. K.S. purified the proteins and performed the biochemical characterization with input from K.J.C., M.L.V., L.C., A.B., and A.C. R.K.H., C.H., and Z.Y. determined the EM density maps for GATOR1 and GATOR1-Rag
HHS Public Access
Author manuscript
Nature
. Author manuscript; available in PMC 2018 October 05.Published in final edited form as:
Nature. 2018 April 05; 556(7699): 64–69. doi:10.1038/nature26158.
A
uthor Man
uscr
ipt
A
uthor Man
uscr
ipt
A
uthor Man
uscr
ipt
A
uthor Man
uscr
ipt
inhibits the capacity of GATOR1 to stimulate GTP hydrolysis by RagA, while a weaker
interaction between the Nprl2-Nprl3 heterodimer and RagA executes the GAP activity. These data reveal the structure of a critical component of the nutrient-sensing mTORC1 pathway and a non-canonical interaction between a GAP and its substrate GTPase.
The mTORC1 pathway is a central regulator of cell growth1–5. Nutrients signal to mTORC1 through the heterodimeric Rag GTPases (RagA/B bound to RagC/D)6–9. When nutrients are abundant, RagA binds GTP and RagC binds GDP, and the complex recruits mTORC1 to the lysosomal surface10, where Rheb stimulates its kinase activity11–16. Upon nutrient
starvation, the Rag GTPases adopt the opposite nucleotide loading state and cannot bind mTORC1, which becomes inhibited10.
The intrinsic GTP hydrolysis rate of the Rag GTPases is slow17, posing a problem for quickly altering the nucleotide state when nutrient levels change. Two GTPase activating protein (GAP) complexes have been discovered, GATOR118,19 and FLCN-FNIP220,21, which stimulate GTP hydrolysis by RagA/B and RagC/D, respectively. Both GATOR1 and FLCN-FNIP2 are deregulated in human disease, with loss of function mutations in GATOR1 being a frequent cause of familial epilepsy22,23.
GATOR1 has three stably-interacting subunits, Depdc5, Nprl2, and Nprl3. Despite its central role in mTORC1 signaling18,19,24, there is almost a complete lack of structural information. Protein structure prediction software such as I-TASSER25 and Jpred26 shows that all three subunits have low primary sequence similarity to other proteins and as a consequence, have poorly defined domains. The only domains in GATOR1 with orthologous structures are two Longin domains27, one each at the N-terminus of Nprl2 and Nprl3, and a DEP domain in Depdc5. Here, we used cryo-electron microscopy (cryo-EM) to solve the structure of GATOR1 on its own and in complex with the Rag GTPases.
Structural determination of GATOR1 and the GATOR1-Rag GTPase complex
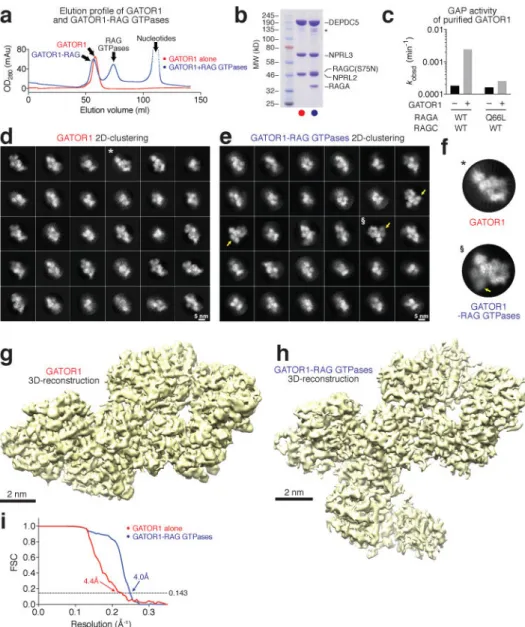
To generate GATOR1 for structural studies we co-expressed Nprl2, Nprl3, and Depdc5 in 293F cells (Fig. 1a–b). To ensure a stable interaction between GATOR1 and the Rag GTPases, we purified a Rag heterodimer consisting of wildtype RagA and the S75N mutant of RagC that eliminates its capacity to bind GTP but not GDP10. We loaded this heterodimer with an excess amount of GppNHp (a non-hydrolysable GTP analogue) and GDP, to lock its nucleotide binding configuration to GppNHpRagA-RagC(S75N)GDP, which is the most favorable for interacting with GATOR1. Indeed, all five subunits co-eluted in the same fraction after gel filtration separation (Fig. 1a–b and Extended Data Fig. 1a–b). Consistent with previous studies17–19, purified GATOR1 stimulated GTP hydrolysis by the RagA-RagC heterodimer by 14-fold, but had no effect on the complex containing mutant RagA(Q66L) (Fig. 1c).
Well-defined particles of GATOR1 (290 kD) and the GATOR1-Rag complex (370 kD) were clearly visualized by cyro-EM (Extended Data Fig. 1c–d). Reference-free two-dimensional (2D) classification revealed explicit structural details with views from different orientations (Fig. 1d–f). High-resolution three-dimensional (3D) refinements from a homogeneous subset
A
uthor Man
uscr
ipt
A
uthor Man
uscr
ipt
A
uthor Man
uscr
ipt
A
uthor Man
uscr
ipt
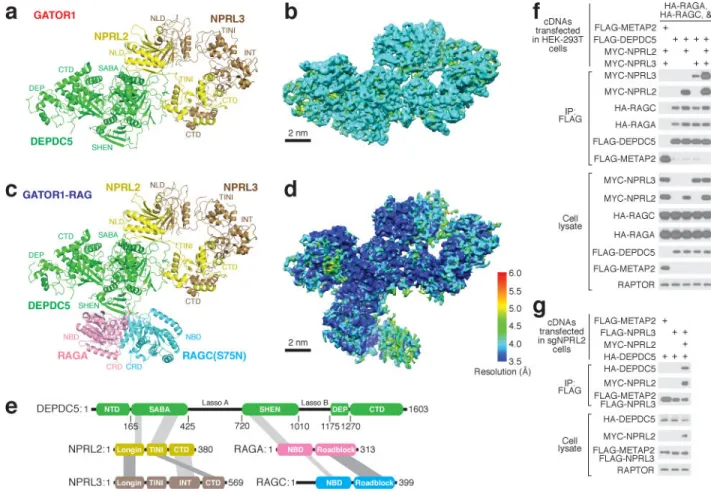
of 3D classification generated the final envelopes for GATOR1 (Fig. 1g) and the GATOR1-Rag complex (Fig. 1h) at 4.4 Å and 4.0 Å resolutions (Gold-standard criteria, Fig. 1i). Despite the lack of homologous structures for use as references, the EM density maps allowed for direct tracing of backbones and registering of bulky residues, and thus enabled the building of a tentative structural model for GATOR1 de novo. We resolved ~85% of GATOR1 except for two flexible regions in Depdc5 that lack corresponding EM density (Fig. 2a–b). For the core region of Depdc5, we reached near-atomic resolution where secondary structures and side chains were unambiguously resolved (Extended Data Fig. 1 h– j). Within the GATOR1-Rag complex, GATOR1 adopts a similar conformation as in free GATOR1. Because the Rag GTPase heterodimer shares sequence similarity with its yeast homologue, Gtr1p-Gtr2p28,29, we were able to fit a homologous model into the extra EM density (Fig. 2c–d).
Architecture of GATOR1 and the GATOR1-Rag GTPase complex
The structural model reveals that the GATOR1 subunits contain several previously unidentified domains. Depdc5 has five domains, which we named, from the N- to C-terminus, the N-terminal domain (NTD), SABA, SHEN, DEP, and C-terminal domain (CTD) (Fig. 2e and Extended Data Fig. 2a–b). With the exception of the well-defined DEP domain, the other four are resolved and visualized for the first time.
The NTD localizes to the lateral side of Depdc5 (Extended Data Fig. 2b). It has two lobes, both of which consist of a β-sheet with an adjacent α-helix (Extended Data Fig. 2c–d). VAST search30 for homologous structure models shows that Lobe B shares structural similarity to the N-terminal domain of PEX1 AAA-ATPase (Extended Data Fig. 2e), which may serve as an adaptor for ubiquitin or Ubx domains31.
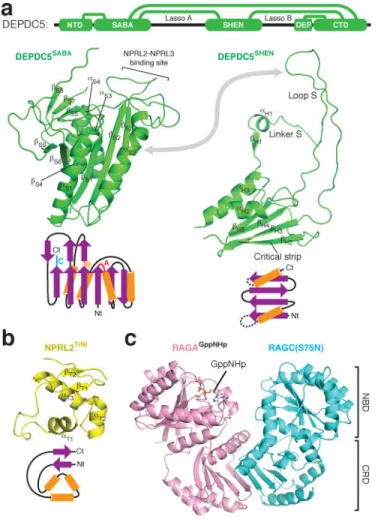
The SABA domain (residues 168-427, previously annotated as DUF3608, Domain of Unknown Function 3608) immediately follows the NTD of Depdc5 (Fig. 3a). It has a globular shape and shares topological similarities with the NADP domain of flavodoxin reductase (NDFR)32 and the CD11a I-domain33 (CD11I, Extended Data Fig. 2f–h), both of which contain ligand-binding motifs, NDFR for flavodoxin and CD11I for manganese(II). The SABA domain consists of six β-strands (βS1-S4, S6, S9) that form a platform surrounded
by four α-helices (αS1-S4), two on each side (Fig. 3a). It is conserved at the sequence level
in Iml1p24,34, the yeast homologue of Depdc5, and organizes the assembly of GATOR1 by mediating interactions with the Nprl2-Nprl3 heterodimer (see below). We therefore renamed it as Structural Axis for Binding Arrangement (SABA) domain.
The SHEN domain (residues 720-1010, Steric Hindrance for Enhancement of Nucleotidase-activity) connects to the SABA domain through a loop. Four β-strands construct its base, while two α-helices cover one side of the sheet (Fig. 3a). The SHEN domain utilizes two flexible regions (Linker S and Loop S) to form interdomain contacts. Linker S contains a β-strand (βH1) and an α-helix (αH1). Strikingly, βH1 forms a continuous sheet with the
β-strands in the NTD, inserting itself right at the interface between the NTD and the SABA domain (Extended Data Fig. 3a–b). Loop S resides between αH2 and βH3 and directly
A
uthor Man
uscr
ipt
A
uthor Man
uscr
ipt
A
uthor Man
uscr
ipt
A
uthor Man
uscr
ipt
contacts the SABA domain near where Nprl2-Nprl3 binds to it, which could potentially mediate interdomain communication (Extended Data Fig. 3c–d). A β-strand (βH2), which we
named the “critical strip”, contacts the nucleotide-binding domain of RagA (Extended Data Fig. 3e–f). This interaction has a unique function and is indispensible for normal cellular response to amino acids, and thus differentiates the GATOR1-Rag GTPases from other GAP-GTPase pairs (see below).
The CTD (residues 1291-1603) of Depdc5 contains two structurally similar lobes and has a pseudo-2-fold rotational symmetry (Extended Data Fig. 4a–c). Each half consists of a five-stranded β-sheet, with an α-helix covering one side. The CTD is located in the core of Depdc5 and contacts all the other domains of Depdc5 except the NTD, making it the central organizer of this multi-domain protein (Fig. 3a).
Nprl2 and Nprl3 have similar domain organizations (Extended Data Fig. 5a and 5f). They both contain an N-terminal Longin domain (NLD, Extended Data Fig. 5b and 5g), which heterodimerize (Extended Data Fig. 5k). After the NLD, a small domain bridges the Longin domain to the C-terminal domains (Fig. 3b and Extended Data Fig. 5a). For Nprl2, this domain also mediates partial interactions with the SABA domain of Depdc5. We therefore renamed it as the TINI domain [Tiny Intermediary of Nprl2 that Interacts (with Depdc5)]. Besides the Longin domain interactions, the C-terminal domains of Nprl2 and Nprl3 form a vast contact surface between each other that further reinforce their interaction (Extended Data Fig. 5k–m).
The Rag GTP heterodimer shares a similar architecture as Gtr1p-Gtr2p (Fig. 3c). The N-terminal regions of RagA and RagC contain the guanine-nucleotide binding domains (NBDs, Extended Data Fig. 6a). Within the nucleotide-binding pocket of RagA we can clearly observe extra EM density corresponding to GppNHp (Extended Data Fig. 6b). The nucleotide-binding pocket of RagC lacks sufficient resolution to identify the ligand bound (supposedly GDP). RagA and RagC heterodimerize via their C-terminal Roadblock domains (CRD, Fig. 3c and Extended Data Fig. 6c), as have also been observed in other mTORC1 pathway components, such as the p14-MP1 heterodimer35. Globally, the nucleotide binding domains of RagA and RagC(S75N) are rotated significantly further away from one another than seen in the open state of Gtr1p-Gtr2p (Extended Data Fig. 6d)28,29, suggesting that regulation of this GTPase heterodimer might have diverged during evolution.
The structural model also revealed the interactions between the subunits. Depdc5 directly contacts RagA and Nprl2, while Nprl3 is bound to Nprl2, and RagC to RagA. Co-immunoprecipitation experiments validated these conclusions: in the absence of other GATOR1 subunits, Depdc5 can interact with Nprl2 and the Rag GTPases, and it
co-immunoprecipitated Nprl3 to a much greater extent when Nprl2 was also co-expressed (Fig. 2f–g).
To identify the subunits of GATOR1 needed for it to associate with its known partners, we determined the capacity of GATOR1 subunits to co-immunoprecipitate endogenous GATOR219, KICSTOR36, and SAMTOR37. Overexpressing Depdc5 alone is sufficient to bind to KICSTOR and SAMTOR (Extended Data Fig. 7a), while Nprl3 is necessary and
A
uthor Man
uscr
ipt
A
uthor Man
uscr
ipt
A
uthor Man
uscr
ipt
A
uthor Man
uscr
ipt
sufficient for the interaction with GATOR2 (Extended Data Fig. 7a–b). Because SAMTOR is a sensor for SAM, and GATOR2 binds the leucine and arginine sensors, these results suggest that the nutrient availability is transmitted to GATOR1 through various interfaces (Extended Data Fig. 7c).
An intact GATOR1 is required for its GAP function
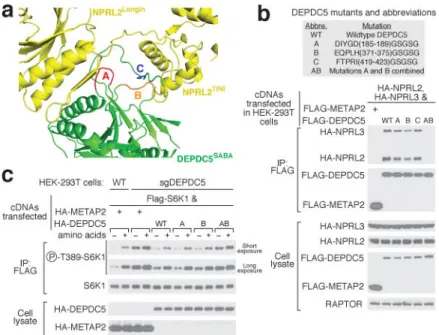
Depdc5 interacts with Nprl2 through the SABA domain (Fig. 4a). Among the large number of residues at the contact surface (Extended Data Fig. 8a–d), we observed three loops on the tip of the SABA domain that directly contact Nprl2, which we defined as Loops A
(βS1~αS1, red), B (βS4-βS5, orange), and C (βS9~C term, blue, Fig. 4a). Specifically, Loop A
contacts a unique hairpin motif (Extended Data Fig. 5c) attached to the Longin domain of Nprl2, whereas Loop B and Loop C contact the TINI domain of Nprl2 (Extended Data Fig. 8e–g). To probe the roles of these contacts in mediating the Depdc5-Nprl2 interaction, we generated Depdc5 mutants in which these loops were mutagenized to flexible GS-linkers of the same length. Mutants replacing any one of the three loops had only a minor defect in binding Nprl2, as they still co-immunoprecipitated Nprl2 and Nprl3 in cells (Fig. 4b). However, we observed a strong synergistic effect when we replaced both Loop A and Loop B with GS-linkers: compound mutant AB failed to interact with any Nprl2 and Nprl3 (Lane AB in Fig. 4b). These results suggest that Loop A and B form redundant interactions with Nprl2 and are essential for forming an intact GATOR1 complex.
We next asked if an intact GATOR1 is necessary for the appropriate regulation of mTORC1 signaling by nutrients. In HEK-293T cells lacking Depdc5, mTORC1 signaling, as detected by the phosphorylation of its substrate S6K1, is higher than that in control cells and largely resistant to amino acid starvation (Fig. 4c). Expression of wildtype Depdc5 in these cells restores normal levels of mTORC1 signaling as well as its sensitivity to amino acids (Fig. 4c). In comparison, mutant AB fails to re-sensitize the Depdc5-null cells to amino acid starvation (Fig. 4c). This result suggests that an intact GATOR1 is necessary for suppressing mTORC1 activity under nutrient-deficient conditions.
The observed Depdc5-Rag GTPases interaction represents an inhibitory
state
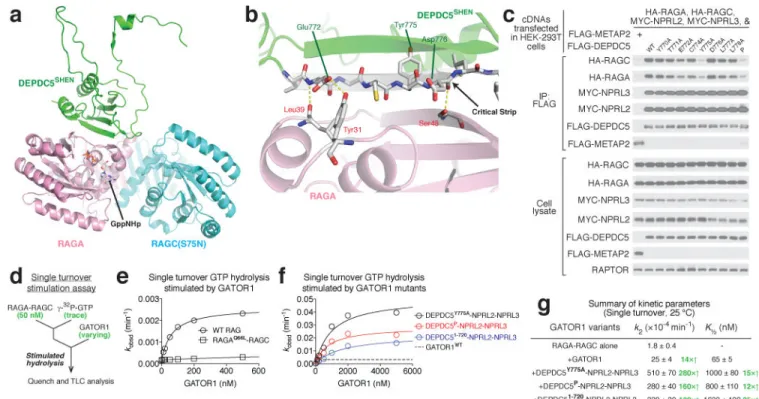
The SHEN domain of Depdc5 directly contacts the NBD of RagA (Fig. 5a). In our model we resolve three pairs of hydrogen bonds (Fig. 5b). Two of them are formed between RagA and the backbone of the critical strip of Depdc5, suggesting that the β-strand conformation of this segment of Depdc5 may be crucial for mediating the interaction. We tested this possibility by asking how variants of Depdc5 with point mutations in the critical strip (residues 771-778) interact with the Rag GTPases in a co-immunoprecipitation assay. The E772A Depdc5 mutant that can no longer form a hydrogen bond with Tyr31 of RagA, moderately reduced the interaction of Depdc5 with RagA-RagC, while the Y775A mutant severely disrupted it (Fig. 5c and Extended Data Fig. 9a–b). Considering that the side chain of Tyr775 faces away from RagA and that its backbone does not contact RagA, we
suspected that mutation of this residue disrupts the conformation of the entire β-strand. Indeed, a much more severe mutation, which we call “mutant P”
A
uthor Man
uscr
ipt
A
uthor Man
uscr
ipt
A
uthor Man
uscr
ipt
A
uthor Man
uscr
ipt
[YDLLP(775-779)GSGSG], does not further reduce the Depdc5-Rag interaction compared with mutant Y775A (Fig. 5c).
During GTP hydrolysis, canonical GAPs insert either an arginine finger or an asparagine thumb into the nucleotide-binding pocket of the target GTPase38,39. Interestingly, we did not observe any extra EM density near the nucleotide-binding domain of RagA (Extended Data Fig. 9c), raising a question that whether the interaction we resolved here is the one
responsible for stimulating GTP hydrolysis. To test this possibility, we purified GATOR1 variants containing the Depdc5 mutants deficient in Rag binding and tested their GAP activity using a single turnover assay (Fig. 5d). Surprisingly, these GATOR1 variants have enhanced GAP kinetics compared to the wildtype complex (Fig. 5e–g). For example, compared to wildtype GATOR1, the variant containing the Y775A Depdc5 mutant has a 20- and 10-fold increase in kcat and K½, respectively (Fig. 5f–g), indicating that a weaker
interaction (increased K½) carries out the real GAP function (increased kcat). To further
confirm this result, we generated a truncated Depdc5 (residues 1-720) that completely lacks the SHEN domain. This truncated version of Depdc5 still forms a complex with Nprl2-Nprl3 (Extended Data Fig. 9d), and has similar elevated hydrolysis kinetics as the GATOR1 variant containing the Y775A point mutation in Depdc5 (Fig. 5f–g).
To further validate this result, we designed a multiple turnover GTP hydrolysis assay (Extended Data Fig. 9e–h), in which the excess amount of Rag GTPases should have the opportunity to occupy the two binding modes simultaneously. Wildtype GATOR1 displayed a biphasic behavior in its reaction kinetics: At lower concentrations of the Rag GTPases, the hydrolysis rate exhibited a transient plateau (inset, Extended Data Fig. 9f). At higher concentrations of the Rag GTPases, however, we observed additional stimulation, likely because the increased concentration of the Rag GTPases promoted a weaker interaction with a higher GAP activity (Extended Data Fig. 9f). Importantly, the initial phase was missing with the Y775A mutant (Extended Data Fig. 9g). These results suggest that the Depdc5-RagA contact detected in our structure does not execute the GAP activity of GATOR1 and that an alternative interaction must do so.
Two binding modes exist between GATOR1 and the Rag GTPases
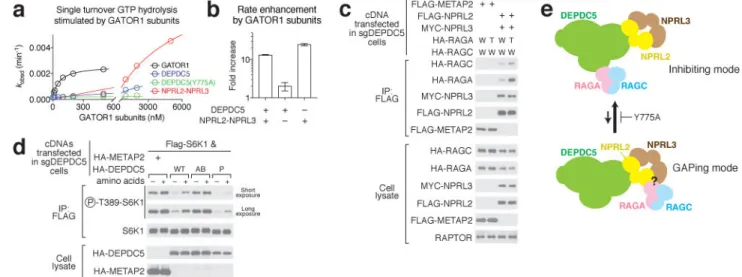
Based on the data above, we generated Depdc5 in the absence of the Nprl2-Nprl3 heterodimer and Nprl2-Nprl3 in the absence of Depdc5 and tested the capacity of each to GAP RagA (Extended Data Fig. 9d). Depdc5 had no activity, but Nprl2-Nprl3 robustly stimulated GTP hydrolysis by RagA (Fig. 6a–b). Compared to intact GATOR1, a much higher concentration of Nprl2-Nprl3 was required to stimulate RagA GTP hydrolysis, indicating that the absence of Depdc5 substantially reduces the binding affinity between the Rag GTPases and Nprl2-Nprl3 (Fig. 6a–b). Moreover, excess Nprl2-Nprl3 stimulates hydrolysis even in the presence of wildtype GATOR1, suggesting that Depdc5 prevents the Nprl2-Nprl3 within GATOR1 from accessing RagA (Extended Data Fig. 9i–j). These results further support that a weaker interaction other than the one we observed carries out the GAP function.
A
uthor Man
uscr
ipt
A
uthor Man
uscr
ipt
A
uthor Man
uscr
ipt
A
uthor Man
uscr
ipt
To independently confirm the binding between Nprl2-Nprl3 and the Rag GTPases, we performed a co-immunoprecipitation assay in cells. In cells lacking Depdc5, the Nprl2-Nprl3 heterodimer co-immunoprecipitates the Rag GTPases (Fig. 6c). The interaction was enhanced by the presence of the RagA(Q66L) mutant that prevents GTP hydrolysis (Fig. 6c, RagAGTP form), as well as by the presence of Depdc5 that permits formation of the
inhibitory binding mode (Extended Data Fig. 10a).
We further reasoned that if Nprl2-Nprl3 is the GAPing unit and the receiver for amino acid signals (cf. Extended Data Fig. 7), amino acid availability should regulate the interaction between Nprl2-Nprl3 and the Rag GTPases. To directly test this hypothesis, we pulled down Nprl2-Nprl3 in cells lacking Depdc5, and probed for the Rag GTPases that
co-immunoprecipitate with it in the presence or absence of amino acids. Higher amounts of the Rag GTPases associated with Nprl2-Nprl3 in nutrient deprived conditions (Extended Data Fig. 10b), but not in cells lacking GATOR2, which likely conveys amino acid signals to GATOR1 (Extended Data Fig. 10c). These results suggest that amino acid signals are transmitted through GATOR2 to Nprl2-Nprl3 to directly regulate the Rag GTPases. The results above led us to conclude that at least two interaction modes must exist between the Rag GTPases and GATOR1 (Fig. 6d): an inhibitory mode characterized by a strong binding affinity between the Rag GTPases and the Depdc5 SHEN domain, but a low GAP activity; and a “GAPing mode” that has the opposite characteristics. This proposal raised the question of the biological relevance of the inhibitory mode captured by our structure, as no similar behavior has been previously observed for a GAP. To probe this question, we tested the effects on mTORC1 signaling of expressing Depdc5 mutants deficient in Rag binding. We reasoned that if, as detected in vitro (cf. Fig. 5f–g), the inhibitory mode suppresses the GAP activity of GATOR1 in cells, we should observe lower mTORC1 signaling (enhanced GAP activity) when we eliminate it. This is indeed the case: in cells expressing mutant P of Depdc5, mTORC1 signaling was more suppressed than in those expressing wildtype Depdc5 even under nutrient-rich conditions (Fig. 6e). Moreover, this increased degree of inhibition requires Nprl2-Nprl3, as we saw no difference between mutant P and wildtype Depdc5 in cells lacking Nprl2 (Extended Data Fig. 10d), further supporting the notion that the Nprl2-Nprl3 heterodimer carries out the GAP activity of GATOR1. We therefore conclude that the inhibitory mode between GATOR1 and the Rag GTPases operates within cells and serves to prevent GATOR1 hyperactivation to maintain the proper response of mTORC1 to nutrients.
Summary
In this study we present cryo-EM structures for GATOR1 and the GATOR1-Rag GTPase complex. Our work leads to the surprising conclusion that at least two binding modes exist between GATOR1 and the Rag GTPases and that both are required for mTORC1 signaling to respond normally to nutrients. The inhibitory mode we have identified distinguishes GATOR1 from canonical GAPs and represents an unforeseen mechanism for how cells suppress mTORC1 activity under nutrient deficient conditions.
A
uthor Man
uscr
ipt
A
uthor Man
uscr
ipt
A
uthor Man
uscr
ipt
A
uthor Man
uscr
ipt
Extended Data
Extended Data Figure 1.
a. Gel filtration profiles for GATOR1 (red line) and GATOR1 + RagA(T21 N)-RagC
(orange line). The peak position for GATOR1 does not shift upon incubation with
RagA(T21N)-RagC, suggesting no direct binding between the two complexes. b. Coomassie blue stained SDS-PAGE analysis of the two peaks on GATOR1 + RagA(T21N)-RagC elution profile. No co-elution is observed. Asterisk denotes a non-specific band that
A
uthor Man
uscr
ipt
A
uthor Man
uscr
ipt
A
uthor Man
uscr
ipt
A
uthor Man
uscr
ipt
copurifies with GATOR1. c & d. Raw cryo-EM images for GATOR1 (c) and the GATOR1-Rag complex (d). Discrete particles were clearly visualized under the microscope. The scale bars represent 50 nm. e & f. Two-dimensional clustering of GATOR1 (e) and GATOR1-Rag GTPases (f). Yellow arrows in f point to the extra EM densities in comparison to e. * and §
mark the particles to be shown in g. Scale bars represent 5 nm. g. Direct comparison of particles from two-dimensional clustering of GATOR1 and GATOR1-Rag GTPases. Extra EM densities for the Rag GTPases can be directly observed. h-j. Sample EM density maps and the fitted structures for α-helical (h), β-strand (i), and loop (j) region of Depdc5. Secondary structures and bulky side chains can be unambiguously resolved at the current resolution. Data (a & b) are the representatives of two independent experiments.
Extended Data Figure 2.
Architecture of Depdc5, the largest subunit of GATOR1. a & b Two views of Depdc5. The protein backbone is depicted in rainbow colors from the N- (blue) to C- (red) termini.
A
uthor Man
uscr
ipt
A
uthor Man
uscr
ipt
A
uthor Man
uscr
ipt
A
uthor Man
uscr
ipt
Binding sites for Nprl2-Nprl3 and the Rag GTPases are marked. c & d. Structural model (c) and topological diagram (d) for Depdc5-NTD. e. Lobe B of Depdc5-NTD shares structural similarity to the N-terminal domain of the PEX1 AAA-ATPase. f-i. The SABA domain of Depdc5 (f) shares topological similarity (g) to flavodoxin reductase (h) and CD11a I domain (i), which all contain ligand binding sites as pointed out by the arrows. The SABA domain contains a β-sheet insertion formed by three strands. The three loops in the SABA domain of Depdc5 that mediate the Depdc5-Nprl2 interaction are colored red (loop A), orange (loop B), and blue (loop C), respectively, on the topological diagram. Nt: N-terminus. Ct: C-terminus.
Extended Data Figure 3.
A
uthor Man
uscr
ipt
A
uthor Man
uscr
ipt
A
uthor Man
uscr
ipt
A
uthor Man
uscr
ipt
Architecture of the SHEN domain of Depdc5. a. EM density map and structural model for the SHEN domain. b. Topological diagram for the SHEN domain. c. βH1 on Linker S forms
a continuous sheet with the β-strands on Lobe B of NTD, and positions itself between NTD and the SABA domain. d. EM density map and structural model for Loop S. e. Loop S (shown in purple) mediates interdomain contact with the SABA domain of Depdc5, close to where Nprl2-Nprl3 dimer binds. f. βH2 of the SHEN domain directly contacts RagA (shown in pink), which we named as the critical strip. g. EM density map and the atomic model for the critical strip. Bulky residues can be unambiguously registered into the EM density.
Extended Data Figure 4.
Architecture of the C-terminal domain (CTD) of Depdc5. a and b. Structure (a) and topological diagram (b) for Depdc5-CTD. c. Depdc5-CTD shows a pseudo two-fold rotational symmetry. Two lobes with similar folds can be seen.
A
uthor Man
uscr
ipt
A
uthor Man
uscr
ipt
A
uthor Man
uscr
ipt
A
uthor Man
uscr
ipt
Extended Data Figure 5.
Architecture of Nprl2 and Nprl3. a. Structural model for Nprl2. Contact surfaces with Depdc5 and Nprl3 are pointed out by arrows. A long linker connects the Longin domain and the TINI domain with EM density shown in mesh. The atomic model for this linker is shown in d. b. Longin domain of Nprl2. A standard Longin domain from LST4 is shown for comparison. c. A strand-turn-strand motif (hairpin) is attached to the Longin domain of Nprl2, which mediates partial interaction with Depdc5. d. EM density map and atomic model for the linker connecting the Longin domain and the TINI domain (cf. the EM density
A
uthor Man
uscr
ipt
A
uthor Man
uscr
ipt
A
uthor Man
uscr
ipt
A
uthor Man
uscr
ipt
in a). e. Structural model for the C-terminal domain (CTD) of Nprl2. f. Structural model for Nprl3. Contact surfaces with Nprl2 are indicated with arrows. g. Longin domain of Nprl3 and its overlap with the Longin domain of Nprl2. h. Structural model for the TINI domain of Nprl3 which connects its Longin domain with the C-terminal domains. i. Structural model for the Intermediary (INT) domain of Nprl3. j. Structural model for the C-terminal domain (CTD) of Nprl3. k-m. Interactions between Nprl2 and Nprl3. Three contact surfaces were identified that mediate the interactions between Nprl2 and Nprl3: the Longin domains of Nprl2 and Nprl3 (k), the TINI domain of Nprl2 and CTD of Nprl3 (I), and the CTD of Nprl2 and the INT domain of Nprl3 (m).
A
uthor Man
uscr
ipt
A
uthor Man
uscr
ipt
A
uthor Man
uscr
ipt
A
uthor Man
uscr
ipt
Extended Data Figure 6.
Architecture of the Rag GTPase heterodimer. a. Nucleotide binding domains (NBD) of RagA (pink) and RagC (cyan) overlap with those of Gtr1p and Gtr2p (grey). b Extra EM density can be observed in the nucleotide binding pocket of RagA, where GppNHp can be fitted. c. The C-terminal Roadblock domains (CRD) of RagA and RagC tightly dimerize with one another. For comparison, the dimerized Roadblock domains from Gtr1p-Gtr2p and p14-MP1 are shown. d. Global conformation of the Rag GTPase heterodimer in comparison to the two crystal structures of Gtr1p-Gtr2p. RagA and Gtr1p are aligned. Rotational
A
uthor Man
uscr
ipt
A
uthor Man
uscr
ipt
A
uthor Man
uscr
ipt
A
uthor Man
uscr
ipt
movement of RagC-NBD is illustrated and compared with Gtr2p-NBD by the direction of
αN5. The NBDs of the Rag GTPases rotate further away from one another even compared
with the open conformation of Gtr1p-Gtr2p (top).
Extended Data Figure 7.
GATOR1 orchestrates amino acid signaling on the lysosomal surface. a.
Co-immunoprecipitation of GATOR2, KICSTOR, and SAMTOR components by overexpressed GATOR1 in HEK-293T cells. Depdc5 by itself is sufficient to pull down endogenous KICSTOR components and SAMTOR. Nprl3 is necessary to pull down GATOR2 components. b. Co-immunoprecipitation of endogenous GATOR2 components by
overexpressed Nprl2-Nprl3 in cells lacking Depdc5. Nprl2-Nprl3 dimer is sufficient to pull down GATOR2, while additional Depdc5 causes no further effect. c. Amino acid and metabolites signals are transmitted to GATOR1 through various routes. Data (a & b) are the representatives of two independent experiments.
A
uthor Man
uscr
ipt
A
uthor Man
uscr
ipt
A
uthor Man
uscr
ipt
A
uthor Man
uscr
ipt
Extended Data Figure 8.
Interactions between Depdc5 and Nprl2. a & b. Large contact surfaces between Depdc5 (green) and Nprl2 (yellow) are observed from the EM density map and structural models. c
& d. Surface residues on Nprl2 (c) and Depdc5 (d) participating in mediating the
interactions, identified by “InterfaceResidue” script in Pymol. e-g. Loops A (e), B (f), and C (g) on Depdc5 directly contact Nprl2.
A
uthor Man
uscr
ipt
A
uthor Man
uscr
ipt
A
uthor Man
uscr
ipt
A
uthor Man
uscr
ipt
Extended Data Figure 9.
In vitro characterization of the GAP mechanism of GATOR1. a. Gel filtration profiles for Depdc5(Y775A)-Nprl2-Nprl3 (blue line) and Depdc5(Y775A)-Nprl2-Nprl3 + RagA-RagC(S75N) in the absence (orange line) or presence (red line) of glutaraldehyde, a crosslinker. Peak A denotes the species eluted at the large molecular weight region. b. Coomassie blue stained SDS-PAGE analysis of Peak A. Direct binding is only observed in the presence of glutaraldehyde. Asterisk denotes a non-specific band that co-purifies with GATOR1. c. No extra EM density can be observed near the NBD of RagA. d. GATOR1
A
uthor Man
uscr
ipt
A
uthor Man
uscr
ipt
A
uthor Man
uscr
ipt
A
uthor Man
uscr
ipt
variants visualized by SDS-PAGE followed by Coomassie blue staining. Asterisk denotes a non-specific band that co-purifies with GATOR1. e. Scheme for measuring stimulated GTP hydrolysis by GATOR1 in a multiple turnover setup. Excess amount of singly-GTP loaded Rag GTPases was incubated with fixed amount of GATOR1. The hydrolysis reaction was traced and quantified. f. Stimulated GTP hydrolysis by wildtype GATOR1 shows a biphasic behavior in reaction kinetics. As increasing amount of the Rag GTPases was included in the reaction, a small plateau of observed rate constant (kobsd) was first observed at a lower concentration (inset). Such biphasic behavior indicates that two binding modes exist in the wildtype GATOR1: one with higher affinity to the Rag GTPases but lower GAP activity, the other with lower affinity but higher GAP activity. A representative data set is shown in this panel, and the statistics are summarized below. g. Stimulated GTP hydrolysis by GATOR1 mutant that is defective in Rag binding eliminates the initial phase. Depdc5(Y775A)-Nprl2-Nprl3 is defective in stable Rag binding because it lacks the docking site (an intact critical strip) for the Rag GTPases. Consequentially, the inhibitory mode diminishes (inset), leaving a single phase corresponding to the GAPing mode in reaction kinetics. A representative data set is shown in this panel, and the statistics are summarized below. h. Summary of kinetic parameters for the multiple turnover GAP activity shown in panels f and g. Mean±STD of two to three independent experiments was reported. i. A stimulated-chase assay to characterize the inhibition mechanism of Depdc5. Wildtype GATOR1 was first added to bind the Rag GTPases with its inhibitory mode. Extra Nprl2-Nprl3 was then included in the reaction as a chase. We reason that if Depdc5 sequesters RagA-NBD, no further stimulation should be observed; if Depdc5 simply prevents Nprl2-Nprl3 from accessing RagA-NBD, we should observe additional stimulation because there is no Depdc5 to inhibit the extra Nprl2-Nprl3. j. Further stimulation is observed in the presence of additional Nprl2-Nprl3, as reflected by the faster hydrolysis rate (steeper slope), suggesting Depdc5 inhibits Nprl2-Nprl3 in cis. Data (a, b, d, & j) are the representatives of two independent experiments.
A
uthor Man
uscr
ipt
A
uthor Man
uscr
ipt
A
uthor Man
uscr
ipt
A
uthor Man
uscr
ipt
Extended Data Figure 10.
In vivo characterization of the GAP mechanism of GATOR1. a. Interaction between Nprl2-Nprl3 and the Rag GTPases is enhanced by wildtype Depdc5, but not mutant P which is defective in binding to the Rag GTPases. W: Wildtype Depdc5; P: mutant P. Asterisk denotes a non-specific band. b. Amino acid availability regulates the interaction between Nprl2-Nprl3 and the Rag GTPases in cells lacking Depdc5. Higher amount of Rag GTPases co-immunoprecipitates with Nprl2-Nprl3 in the absence of amino acids. c. Loss of regulated interaction between Nprl2-Nprl3 and the Rag GTPases in cells lacking Depdc5 and Mios. No difference is observed when GATOR2, the receptor for amino acid signals, is knocked out. d. Expression of Dedpc5 mutant that is defective in Rag GTPase binding has no effect in Nprl2-null cells, which sharply contrasts the result in Fig. 6e. Data (a-d) are the representatives of two independent experiments.
Supplementary Material
Refer to Web version on PubMed Central for supplementary material.
Acknowledgments
We thank all members of the Sabatini Laboratory and Thomas Schwartz for helpful insights. We thank Priyanka Abeyrathne, Nikolaus Grigorieff, Robert Grant, and Catherine Drennan for technical support. We thank Robert Saxton, Michael Pacold, and Shu-ou Shan for critical reading of the manuscript. This work was supported by grants
A
uthor Man
uscr
ipt
A
uthor Man
uscr
ipt
A
uthor Man
uscr
ipt
A
uthor Man
uscr
ipt
from the NIH (R01 CA103866, R01 CA129105 and R37 AI047389) and Department of Defense
(W81XWH-15-1-0230) to D.M.S., and fellowship support from NSF (2016197106) to K.J.C. and from the Life Sciences Research Foundation to K.S., where he is a Pfizer Fellow. R.K.H., C.H., and Z.Y. were supported by the Howard Hughes Medical Institute. D.M.S. is an investigator of the Howard Hughes Medical Institute.
References
1. Efeyan A, Comb WC, Sabatini DM. Nutrient-sensing mechanisms and pathways. Nature. 2015; 517:302–310. [PubMed: 25592535]
2. Shaw RJ, Cantley LC. Ras, PI(3)K and mTOR signalling controls tumour cell growth. Nature. 2006; 441:424–430. [PubMed: 16724053]
3. Jewell JL, Russell RC, Guan KL. Amino acid signalling upstream of mTOR. Nat Rev Mol Cell Biol. 2013; 14:133–139. [PubMed: 23361334]
4. Gonzalez A, Hall MN. Nutrient sensing and TOR signaling in yeast and mammals. EMBO J. 2017; 36:397–408. [PubMed: 28096180]
5. Saxton RA, Sabatini DM. mTOR Signaling in Growth, Metabolism, and Disease. Cell. 2017; 168:960–976. [PubMed: 28283069]
6. Schürmann A, Brauers A, Massmann S, Becker W, Joost HG. Cloning of a novel family of mammalian GTP-binding proteins (RagA, RagBs, RagB1) with remote similarity to the Ras-related GTPases. J Biol Chem. 1995; 270:28982–28988. [PubMed: 7499430]
7. Hirose E, Nakashima N, Sekiguchi T, Nishimoto T. RagA is a functional homologue of S. cerevisiae Gtr1p involved in the Ran/Gsp1-GTPase pathway. J Cell Sci. 1998; 111(Pt 1):11–21. [PubMed: 9394008]
8. Sekiguchi T, Hirose E, Nakashima N, li M, Nishimoto T. Novel G proteins, Rag C and Rag D, interact with GTP-binding proteins, Rag A and Rag B. J Biol Chem. 2001; 276:7246–7257. [PubMed: 11073942]
9. Nakashima N, Noguchi E, Nishimoto T. Saccharomyces cerevisiae putative G protein, Gtr1p, which forms complexes with itself and a novel protein designated as Gtr2p, negatively regulates the Ran/ Gsp1p G protein cycle through Gtr2p. Genetics. 1999; 152:853–867. [PubMed: 10388807] 10. Sancak Y, et al. The Rag GTPases bind raptor and mediate amino acid signaling to mTORC1.
Science. 2008; 320:1496–1501. [PubMed: 18497260]
11. Inoki K, Li Y, Xu T, Guan KL. Rheb GTPase is a direct target of TSC2 GAP activity and regulates mTOR signaling. Genes Dev. 2003; 17:1829–1834. [PubMed: 12869586]
12. Menon S, et al. Spatial Control of the TSC Complex Integrates Insulin and Nutrient Regulation of mTORC1 at the Lysosome. Cell. 2014; 156:771–785. [PubMed: 24529379]
13. Li Y, Inoki K, Guan KL. Biochemical and Functional Characterizations of Small GTPase Rheb and TSC2 GAP Activity. Mol Cell Biol. 2004; 24:7965–7975. [PubMed: 15340059]
14. Saito K, Araki Y, Kontani K, Nishina H, Katada T. Novel role of the small GTPase Rheb: its implication in endocytic pathway independent of the activation of mammalian target of rapamycin. J Biochem. 2005; 137:423–430. [PubMed: 15809346]
15. Saucedo LJ, et al. Rheb promotes cell growth as a component of the insulin/TOR signalling network. Nat Cell Biol. 2003; 5:566–571. [PubMed: 12766776]
16. Stocker H, et al. Rheb is an essential regulator of S6K in controlling cell growth in Drosophila. Nat Cell Biol. 2003; 5:559–565. [PubMed: 12766775]
17. Shen K, Choe A, Sabatini DM. Intersubunit Crosstalk in the Rag GTPase Heterodimer Enables mTORC1 to Respond Rapidly to Amino Acid Availability. Mol Cell. 2017; doi: 10.1016/j.molcel. 2017.09.026
18. Panchaud N, Péli-Gulli MP, De Virgilio C. Amino acid deprivation inhibits TORC1 through a GTPase-activating protein complex for the Rag family GTPase Gtr1. Sci Signal. 2013; 6:ra42. [PubMed: 23716719]
19. Bar-Peled L, et al. A Tumor suppressor complex with GAP activity for the Rag GTPases that signal amino acid sufficiency to mTORC1. Science. 2013; 340:1100–1106. [PubMed: 23723238]
A
uthor Man
uscr
ipt
A
uthor Man
uscr
ipt
A
uthor Man
uscr
ipt
A
uthor Man
uscr
ipt
20. Petit CS, Roczniak-Ferguson A, Ferguson SM. Recruitment of folliculin to lysosomes supports the amino acid-dependent activation of Rag GTPases. J Cell Biol. 2013; 202:1107–1122. [PubMed: 24081491]
21. Tsun ZY, et al. The Folliculin Tumor Suppressor Is a GAP for the RagC/D GTPases That Signal Amino Acid Levels to mTORC1. Mol Cell. 2013; doi: 10.1016/j.molcel.2013.09.016
22. Dibbens LM, et al. Mutations in DEPDC5 cause familial focal epilepsy with variable foci. Nat Genet. 2013; 45:546–551. [PubMed: 23542697]
23. Ishida S, et al. Mutations of DEPDC5 cause autosomal dominant focal epilepsies. Nat Genet. 2013; 45:552–555. [PubMed: 23542701]
24. Wu X, Tu BP. Selective regulation of autophagy by the Iml1-Npr2-Npr3 complex in the absence of nitrogen starvation. Mol Biol Cell. 2011; 22:4124–4133. [PubMed: 21900499]
25. Zhang Y. I-TASSER server for protein 3D structure prediction. BMC Bioinformatics. 2008; 9:40. [PubMed: 18215316]
26. Drozdetskiy A, Cole C, Procter J, Barton GJ. JPred4: a protein secondary structure prediction server. Nucleic Acids Res. 2015; 43:W389–94. [PubMed: 25883141]
27. Levine TP, et al. Discovery of new Longin and Roadblock domains that form platforms for small GTPases in Ragulator and TRAPP-II. Small GTPases. 2013; 4:62–69. [PubMed: 23511850] 28. Gong R, et al. Crystal structure of the Gtr1p-Gtr2p complex reveals new insights into the amino
acid-induced TORC1 activation. Genes Dev. 2011; 25:1668–1673. [PubMed: 21816923] 29. Jeong JH, et al. Crystal structure of the Gtr1p(GTP)-Gtr2p(GDP) protein complex reveals large
structural rearrangements triggered by GTP-to-GDP conversion. J Biol Chem. 2012; 287:29648– 29653. [PubMed: 22807443]
30. Gibrat JF, Madej T, Bryant SH. Surprising similarities in structure comparison. Curr Opin Struct Biol. 1996; 6:377–385. [PubMed: 8804824]
31. Shiozawa K, et al. Structure of the N-terminal domain of PEX1 AAA-ATPase. Characterization of a putative adaptor-binding domain. J Biol Chem. 2004; 279:50060–50068. [PubMed: 15328346] 32. Ingelman M, Bianchi V, Eklund H. The three-dimensional structure of flavodoxin reductase from
Escherichia coli at 1.7 A resolution. J Mol Biol. 1997; 268:147–157. [PubMed: 9149148] 33. Qu A, Leahy DJ. Crystal structure of the I-domain from the CD11a/CD18 (LFA-1, alpha L beta 2)
integrin. Proc Natl Acad Sci USA. 1995; 92:10277–10281. [PubMed: 7479767]
34. Algret R, et al. Molecular architecture and function of the SEA complex, a modulator of the TORC1 pathway. Mol Cell Proteomics. 2014; 13:2855–2870. [PubMed: 25073740] 35. Kurzbauer R, et al. Crystal structure of the p14/MP1 scaffolding complex: how a twin couple
attaches mitogen-activated protein kinase signaling to late endosomes. Proc Natl Acad Sci USA. 2004; 101:10984–10989. [PubMed: 15263099]
36. Wolfson RL, et al. KICSTOR recruits GATOR1 to the lysosome and is necessary for nutrients to regulate mTORC1. Nature. 2017; 543:438–442. [PubMed: 28199306]
37. Gu X, et al. SAMTOR is an S-adenosylmethionine sensor for the mTORC1 pathway. Science. 2017; 358:813–818. [PubMed: 29123071]
38. Scheffzek K, et al. The Ras-RasGAP complex: structural basis for GTPase activation and its loss in oncogenic Ras mutants. Science. 1997; 277:333–338. [PubMed: 9219684]
39. Daumke O, Weyand M, Chakrabarti PP, Vetter IR, Wittinghofer A. The GTPase-activating protein Rap1GAP uses a catalytic asparagine. Nature. 2004; 429:197–201. [PubMed: 15141215]
A
uthor Man
uscr
ipt
A
uthor Man
uscr
ipt
A
uthor Man
uscr
ipt
A
uthor Man
uscr
ipt
Figure 1. Structural determination of GATOR1 and the GATOR1-Rag complex
a. Gel filtration profiles for GATOR1 (red line) and GATOR1-Rag GTPases (blue line). b.
Coomassie blue stained SDS-PAGE analysis of purified GATOR1 (red) and GATOR1-Rag GTPases (blue). c. In vitro GAP activity of purified GATOR1. d & e. Envelopes of GATOR1 (d) and GATOR1-Rag GTPases (e) from the three-dimensional reconstructions with density shown at 0.05 threshold level (UCSF Chimera). Scale bars represent 2 nm. f. Gold-standard Fourier shell correlation (FCS) for GATOR1 (red line) and the GATOR1-Rag GTPases (blue line). Data (a-c) are the representatives of two independent experiments. See Supplementary Table 1 for cryo-EM data collection and refinement.
A
uthor Man
uscr
ipt
A
uthor Man
uscr
ipt
A
uthor Man
uscr
ipt
A
uthor Man
uscr
ipt
Figure 2. Architectures of GATOR1 and of the GATOR1-Rag GTPases complex
a & c. Atomic models and domain assignment for GATOR1 (a) and the GATOR1-Rag
GTPases complex (c). b & d. Local resolution of GATOR1 (b) and the GATOR1-Rag GTPases complex (d). e. Domain organization and interaction map for the GATOR1-Rag GTPases complex. Grey bars indicate domain-domain interactions. f & g.
Co-immunoprecipitation assay to validate interactions amongst subunits of the GATOR1-Rag GTPases complex in wildtype HEK293T (f) and sgNPRL2 cells (g). Data (f & g) are the representatives of two independent experiments. For gel source data here and below, see Supplementary Figure 1. See Supplementary Table 1 for model building and validation.
A
uthor Man
uscr
ipt
A
uthor Man
uscr
ipt
A
uthor Man
uscr
ipt
A
uthor Man
uscr
ipt
Figure 3. Domain structures within the GATOR1-Rag GTPases complex
a. Structures and topological diagrams for the SABA and SHEN domains of Depdc5.
Interdomain contacts are illustrated with green lines. b. Structure and topological diagram for the TINI domain of Nprl2. Nt: N-terminus. Ct: C-terminus. c. Structure of the RagA-RagC(S75N) heterodimer. NBD: Nucleotide binding domain. CRD: C-terminal roadblock domain.
A
uthor Man
uscr
ipt
A
uthor Man
uscr
ipt
A
uthor Man
uscr
ipt
A
uthor Man
uscr
ipt
Figure 4. An intact GATOR1 is necessary for mTORC1 inhibition upon amino acid starvation
a. Three loops in the SABA domain of Depdc5 mediate the Depdc5-Nprl2 interaction.
Loops A, B, and C are colored in red, orange, and blue, respectively. b. Compound mutant of loop A and loop B in Depdc5 disrupts GATOR1 assembly. c. Expression of Dedpc5 mutant that prevents GATOR1 assembly does not restore normal mTORC1 signaling in cells lacking Depdc5. Data (b & c) are the representatives of two independent experiments.
A
uthor Man
uscr
ipt
A
uthor Man
uscr
ipt
A
uthor Man
uscr
ipt
A
uthor Man
uscr
ipt
Figure 5. The Depdc5-Rag interaction represents an inhibitory state for GATOR1
a. Architecture of the SHEN domain-Rag GTPases interaction. b. The critical strip on
Depdc5 mediates the interaction with RagA. Three pairs of hydrogen bonds are shown in yellow dashed line. c. Point mutations in the critical strip of Depdc5 impair binding of the Rag GTPase heterodimer to GATOR1. d. Scheme for single turnover GTP hydrolysis assay to determine the stimulatory effect of GATOR1 on the Rag GTPases. e & f. Dose-dependent GAP activity of wildtype GATOR1 (e) and variants that are defective in Rag GTPase binding (f). Representative data sets are shown here, and the statistics are summarized in g.
g. Summary of kinetic parameters for the GAP activity shown in panels e and f. Mean±STD
of two to three independent experiments was reported.
A
uthor Man
uscr
ipt
A
uthor Man
uscr
ipt
A
uthor Man
uscr
ipt
A
uthor Man
uscr
ipt
Figure 6. A two-state model of the GATOR1 function
a & b. Dose-dependent GAP activity of GATOR1 subunits Depdc5 and Nprl2-Nprl3 (a) and
quantification (b). A representative data set is shown in a, and the statistics are summarized in b. Mean±STD of three independent experiments was shown. c. Interaction between Nprl2-Nprl3 and the Rag GTPases in the absence of Depdc5. W: Wildtype RagA or RagC; T: RagA(Q66L) mutant. d. A two-state model showing the equilibrium between GATOR1 and the Rag GTPases. Both the inhibitory mode and the GAPing mode are required for regulating mTORC1 activity. e. Expression of Dedpc5 mutant that is defective in Rag GTPase binding further suppresses mTORC1 activity in Depdc5-null cells. Data (c & e) are the representatives of two independent experiments.