HAL Id: hal-00316950
https://hal.archives-ouvertes.fr/hal-00316950
Submitted on 1 Jan 2001
HAL is a multi-disciplinary open access
archive for the deposit and dissemination of
sci-entific research documents, whether they are
pub-lished or not. The documents may come from
teaching and research institutions in France or
abroad, or from public or private research centers.
L’archive ouverte pluridisciplinaire HAL, est
destinée au dépôt et à la diffusion de documents
scientifiques de niveau recherche, publiés ou non,
émanant des établissements d’enseignement et de
recherche français ou étrangers, des laboratoires
publics ou privés.
the mid- and high-altitude cusps
P. J. Cargill, M. W. Dunlop, A. Balogh
To cite this version:
P. J. Cargill, M. W. Dunlop, A. Balogh. First Cluster results of the magnetic field structure of the
mid- and high-altitude cusps. Annales Geophysicae, European Geosciences Union, 2001, 19 (10/12),
pp.1533-1543. �hal-00316950�
Annales
Geophysicae
First Cluster results of the magnetic field structure of the mid- and
high-altitude cusps
P. J. Cargill, M. W. Dunlop, A. Balogh, and the FGM team
Space and Atmospheric Physics, The Blackett Laboratory, Imperial College, London SW7 2BZ, UK Received: 21 March 2001 – Revised: 22 June 2001 – Accepted: 16 July 2001
Abstract. Magnetic field measurements from the four
Clus-ter spacecraft from the mid- and high-altitude cusp are pre-sented. Cluster underwent two encounters with the mid-altitude cusp during its commissioning phase (24 August 2000). Evidence for field-aligned currents (FACs) was seen in the data from all three operating spacecraft from north-ern and southnorth-ern cusps. The extent of the FACs was of the order of 1 RE in the X-direction, and at least 300 km in the
Y-direction. However, fine-scale field structures with scales of the order of the spacecraft separation (300 km) were ob-served within the FACs. In the northern crossing, two of the spacecraft appeared to lie along the same magnetic field line, and observed very well matched signals. However, the third spacecraft showed evidence for structuring transverse to the field on scales of a few hundred km. A crossing of the high-altitude cusp from 13 February 2001 is presented. It is re-vealed to be a highly dynamic structure with the boundaries moving with velocities ranging from a few km/s to tens of km/s, and having structure on timescales ranging from less than one minute up to several minutes. The cusp proper is associated with the presence of a very disordered magnetic field, which is entirely different from the magnetosheath tur-bulence.
Key words. Magnetospheric physics (current systems;
mag-netopause, cusp, and boundary layers) – Space plasma physics (discontinuities)
1 Introduction
The high- and medium-altitude cusps are among the last of the largely unexplored regions of the Earth’s magnetosphere. The cusp plays a pivotal role in the transfer of energy from the solar wind to the ionosphere and auroral regions, since cusp magnetic field lines map directly into the Earth’s polar regions. The high-altitude cusp (8 − 10 RE) has been
previ-ously explored by the Hawkeye (e.g. Eastman et al., 2000),
Correspondence to: P. J. Cargill (p.cargill@ic.ac.uk)
HEOS-1 and -2 (e.g. Haerendel et al., 1978; Dunlop et al., 2000), Polar (e.g. Grande et al., 1997; Zhou and Russell, 1997) and Interball (e.g. Sandahl et al., 2000; Nˇemecek et al., 2000; Mˇerka et al., 2000) spacecraft. The HEOS-2 spacecraft had a fairly similar orbit to Cluster, and underwent numerous cusp passes between 1969 and 1974. Evidence for magnetic field and plasma turbulence were found (e.g. Haerendel et al., 1978). Recent Hawkeye studies have focussed on the ex-tent that the high-altitude cusp is an indented region. Zhou and Russell (1997) and Eastman et al. (2000) found contrast-ing answers to this question. However, the twin Interball spacecraft have shown evidence for indentation (Mˇerka et al., 2000), as well as a highly dynamic interface between the cusp and magnetosheath (e.g. Sandahl et al., 2000). Finally, results from POLAR have shed light on many aspects of the cusp, especially under conditions of high dynamic solar wind pressure.
The mid-altitude cusp is relatively unexplored, yet is an important region of the magnetosphere, since the currents that connect the magnetopause to the ionosphere must flow through it (e.g. Ijima, 2000). There are numerous obser-vations of magnetic field and plasma properties from a low-altitude orbit (e.g. the FAST spacecraft with an apogee of 4000 km: Strangeway et al., 2000), which show magnetic field perturbations of the order of 50–100 nT over a signifi-cant range of MLT. However, space missions have tended to neglect the medium altitude regions, and so the Cluster orbit provides a good opportunity to explore this region.
There is a lot that we do not know about the cusp. Fun-damental questions include: what is its global structure and to what extent is “funnel” geometry a reality? Is the cusp re-ally an indented region in the magnetopause? How does the shocked solar wind flow interact with such an indentation? What is the role of plasma turbulence and energetic parti-cles in the cusp? Is the turbulence produced intrinsically, or is it generated elsewhere (i.e. at the bow-shock)? What is the structure of the field-aligned currents that connect the high-altitude cusp to the ionosphere? The cusp is one of the main scientific focuses of the Cluster mission. The 4
7: 0 7:15 7:30 7:45 8: 0 8:15 8:30 8:45 9: 0 9:15 9:30 9:45 10: 0 10:15 10:30 10:45 11: 0 11:15 11:30 0 500 1000 |B| nT UT 7: 0 7:15 7:30 7:45 8: 0 8:15 8:30 8:45 9: 0 9:15 9:30 9:45 10: 0 10:15 10:30 10:45 11: 0 11:15 11:30 −1000 −500 0 500 1000 B SM X nT 7: 0 7:15 7:30 7:45 8: 0 8:15 8:30 8:45 9: 0 9:15 9:30 9:45 10: 0 10:15 10:30 10:45 11: 0 11:15 11:30 −200 −150 −100 −50 0 50 B SM Y nT 7: 0 7:15 7:30 7:45 8: 0 8:15 8:30 8:45 9: 0 9:15 9:30 9:45 10: 0 10:15 10:30 10:45 11: 0 11:15 11:30 −500 −400 −300 −200 B SM Z nT
Cluster Magnetic field 24 August 2000
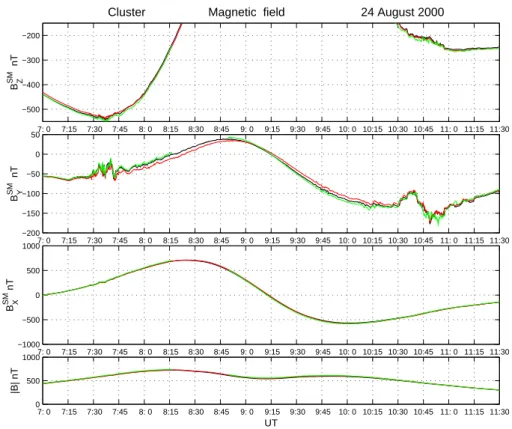
Fig. 1. The Z, Y and X magnetic field components in SM coordinates, and the field magnitude between 07:00 and 11:30 UT on 24 August
2000. Data from three spacecraft (1–3) are shown by black, red and green, respectively. There is no data available from spacecraft 4 on this date. Note the disturbed times (07:26–08:00 and 10:07–11:15).
craft will make many passes through the cusp regions during the mission. The Cluster orbit is such that we may expect crossings of the medium altitude cusp (4 − 6 RE) when the
spacecraft apogee is tailward of the Earth, and crossings of the high altitude cusp (8 − 11 RE) when the apogee is in the
solar wind.
This paper uses magnetic field measurements from the early phase of the Cluster mission to address two topics of importance to cusp physics, namely, the nature of field-aligned currents and the presence of an indentation, as mani-fested by weak magnetic field regions in the cusp. We present data from the magnetic field experiment (Flux Gate Magne-tometer (FGM), Balogh et al., 1997; 2001) obtained in both mid- and high-altitude cusp regions. During commissioning, 3 spacecraft measurements were obtained in the medium alti-tude cusp during late August 2000. Section 2 presents the re-sults from this encounter. In late January and early February 2001, Cluster had its preliminary encounters with the high altitude cusp. In Sect. 3, we present the first magnetic field results from these cusp crossings.
2 The medium altitude cusp crossings of 24 August 2000
The FGM instruments and early in-flight performance are de-scribed fully in Balogh et al. (1997, 2001). For this study, we restrict ourselves to spin-averaged (4 s) data in order to study
the larger scale structure of the cusp. Studies using higher resolution data will be presented in future publications.
Figure 1 shows the time history of the three magnetic field components from the three commissioned magnetome-ters between 07:00 and 11:30 UT on 24 August 2000. The magnetosphere was in a quiet state during this time, with small values of the Kp index (< 3) being recorded. Solar magnetic (SM) coordinates are used, with the Z-axis paral-lel to the north magnetic pole, and the Y -axis perpendicular to the Sun-Earth line towards dusk (Kivelson and Russell, 1995). SM coordinates are well suited to regions of the mag-netosphere where the magnetic structure is controlled more strongly by the Earth’s dipole than by the solar wind. We found that SM coordinates organised the data slightly better than Geocentric Solar Magnetospheric (GSM) coordinates in the sense that the slow evolution of the dipole tilt angle is re-moved. At this time, there was only data from the FGM ex-periments on spacecrafts 1–3. The 4t hFGM instrument was being commissioned at this time. Although we do not have a complete four spacecraft set of data, we believe even with three spacecraft, this data set is of outstanding scientific in-terest. A standard colour-coding is used: spacecraft 1–4 are shown by black, red, green and blue, respectively.
Figures 2a, b show the Cluster orbit in the SM X −Z plane (Fig. 2a) and SM X − Y plane (Fig. 2b). The details of both plots are found in the figure captions, but we note here that the spacecraft separation vectors are 20 times larger on the
plots than in reality. For example, 2 RE on the plots
corre-sponds to a separation of approximately 600 km. The solid lines are magnetic field lines calculated from the Tsyganenko (1989) (T89) model with Kp = 1+, and show the approxi-mate location of the spacecraft with respect to a model mag-netosphere. The blue dots show the position of the spacecraft at every hour, with key times indicated. The spacecraft con-figurations are shown at the time along the orbit correspond-ing to the location of spacecraft 1 (black).
The overall field profiles shown in Fig. 1 between 07:00 and 11:00 UT are what one would expect for this orbit, and compare well with the Tsyganenko (1989) model with a Kp value of 1+ (M. W. Dunlop, unpublished work, 2000). The important features for the present study are the disturbed re-gions between 07:26 and 08:00 UT, and between 10:07 and 11:15 UT. Referring to the orbit plots, we see that according to the T89 model (Fig. 2a), these disturbed regions corre-spond to the spacecraft when it is located in the mid-altitude cusps (4 − 6 RE). The alignment with the theoretical cusp
location is almost exact for the southerly crossing (the space-craft are at Y = 0 in SM coordinates), but there is a small displacement (about 1 RE in the duskward direction) for the
northerly crossing. The field structure in the YSM direction
differs between the two regions. The field structure in the southerly pass does not appear to have any organised struc-ture, but rather it consists of a series of large oscillations. In the northerly pass, there is a clear bipolar signature with first a duskward and then a dawnward component, superposed on the background field which does not itself change signifi-cantly.
Given their location, we suggest that these disturbed field regions are the consequence of field-aligned currents flowing between the high-altitude cusp and the aurora. One would expect from Amp´ere’s law that the main magnetic field com-ponents due to the field-aligned current would be in the Y and X SM directions, but with the X-component becoming more important as the terrestrial field lines swing away from
Z-direction (see Fig. 2).
Figure 3 shows the solar wind plasma and magnetic field as measured by the Advanced Composition Explorer (ACE) spacecraft between 04:00 and 12:00 on 24 August 2000. The magnetic field measurements are shown every 16 s, while the plasma measurements are five-minute averages (higher reso-lution plasma data is not available for a significant fraction of the interval). The solar wind was relatively quiet, with a ve-locity between 300 and 400 km/s. The most notable feature is the high initial density (20 cm−3) that decreases at around
06:00 to more typical solar wind values. The Z-component of the Interplanetary Magnetic Field (IMF) is initially north-ward, but turns southward at 07:15 UT, and fluctuates there-after between positive and negative. Finally, at 06:35, the
Y-component swings from dawnward to duskward.
For the first cusp encounter, the delay time from ACE to the cusp is approximately 1 h and 20 min, so that one is interested in looking at the solar wind between 06:05 and 06:40. This corresponds to a predominately northward IMF. The southward turning should arrive at approximately 08:35,
−5 0 5 10 −10 −8 −6 −4 −2 0 2 4 6 8 10 12 X Re Z Re 12:00 UT 11:00 UT 8:00 UT 7:00 UT 10:00 UT 9:00 UT −2 −1 0 1 2 3 4 5 −2 −1.5 −1 −0.5 0 0.5 1 1.5 2 Y Re X Re 12:00 UT 11:00 UT 10:00 UT 9:00 UT 8:00 UT 7:00 UT
Fig. 2. The Cluster orbit between 03:00 and 17:00 on 24 August
2000 in the X−Z SM plane (top panel) and X−Y SM plane (bottom panel). The spacecraft are colour-coded (black, red, green and blue for spacecraft 1–4, respectively). The relative position of spacecraft 4 is shown even though there is no magnetometer data available. The blue dots denote the time, measured every hour. Magnetic field lines based on the Tsyganenko (1989) model are superimposed for context. The spacecraft separations shown are 20 times larger than in reality. The spacecraft configurations are shown at a time corre-sponding to the location of spacecraft 1 (black) along the orbit.
after Cluster has left the cusp. For the second encounter, the delay from the ACE to the cusp is now approximately 1 h and 8 min, so one is interested in the solar wind between 09:00 and 10:10. During this time, the IMF is primarily in the dusk-dawn direction, with a weaker N/S component that changes
Fig. 3. The solar wind conditions measured by the ACE spacecraft
between 04:00 and 12:00 UT on 24 August 2000. The six panels show BX, BY, BZ, B, N and V , respectively.
sign three times in this interval.
We now proceed to analyse the two local regions of FACs. Figure 4 shows 40 min of data from the southward cusp pass in SM coordinates. For this encounter, spacecraft 1 and 3 are located at roughly the same Y position (the separation is 60 km), with spacecraft 2 displaced by 200 km in the Y -direction from spacecraft 3. In the X − Z plane, spacecraft 2 and 3 are at roughly the same X location, with spacecraft 1 leading the other two by 150 km.
As shown in Fig. 4, the background field seen by each of the spacecraft is different, corresponding to their differ-ent locations in the magnetosphere. The main magnetic field disturbance begins at approximately 07:28, lasts until 07:48, and consists of large (30–40 nT) disturbances in the Y - and
X-components, with smaller oscillations (5–10 nT) in BZ.
This is consistent with a current flowing mostly in the Z-direction (SM). Based on Fig. 4, we note:
1. The overall duration of the FACs as seen by all space-craft are roughly the same. For a spacespace-craft formation speed of 6 km/s, this corresponds to 7200 km (1.12 RE),
assuming that the whole FAC structure is not moving with respect to the spacecraft. In addition, the over-all extent of the FACs in the Y -direction is clearly larger than the separation between spacecraft 1 and 2 (200 km).
2. The fields measured by spacecraft 1 and 3 have very similar profiles, with the signal from spacecraft 1 lead-ing that from spacecraft 3 by between 10 and 30 s in the more obvious structures. Some of these structures are thus convecting across the spacecraft, while others may be stationary. Spacecraft 1 and 3 are at roughly the same Y -location, and so one might expect them to fly through similar structures (except for a small shift in the background field strength). In addition, the signals at spacecraft 1 would be expected to preceed those at spacecraft 3 (see above).
3. The field measured by spacecraft 2, while following a similar “envelope” to that seen by the other two space-craft, shows, however, marked differences. For exam-ple, the lag in the signal seen by spacecraft 2 can vary from 0 s to 1 min. This is likely to be evidence for struc-turing in the Y -direction, as opposed to spacecraft 2 which sees the same structure as seen by spacecraft 1 and 3.
We now discuss point (3) further by considering de-trended data shown in Fig. 5. The de-trending involve cal-culating a two-minute average of the background field, and then subtracting this from the total signal. The full extent of the field disturbance seen by all three spacecraft is still apparent here, with the dominant role of the X- and Y -field components being clear. We focus on two features that are readily apparent in this data.
1. One of the most obvious features in Fig. 5 is the large-amplitude pulse in BY that peaks at around 07:40 UT.
This is clearly a structure that moves at a variable speed across all three spacecraft. Spacecraft 1 and 3 see roughly the same structure, with a delay of mately 30 s at the start (corresponding to an approxi-mately stationary structure), decreasing to 15 s at the end (corresponding to a structure moving in the neg-ative X-direction at a few km/s). However, while the overall field envelope seen by spacecraft 2 is of the same duration, the initial rise of the field occurs on a differ-ent timescale, with a two-step rise: the decay closely maps that seen by spacecraft 1 and 2. We argue that this is evidence for structure in the FACs on the scale of the spacecraft separation in the SM Y -direction. If this structuring was on a smaller scale than the separa-tion , the signals seen by spacecraft 1 and 2 would be uncorrelated. On the other hand, structuring on a larger scale than the separation would lead to almost identical profiles. Thus, we infer currents on the scale 200 km. 2. A second feature of interest occurs between 07:33 and
7:15 7:20 7:25 7:30 7:35 7:40 7:45 7:50 7:55 100 150 200 250 300 350 400 450 hrs:mns UT B SM X nT 7:15 7:20 7:25 7:30 7:35 7:40 7:45 7:50 7:55 −70 −60 −50 −40 −30 −20 −10 0 B SM Y nT 7:15 7:20 7:25 7:30 7:35 7:40 7:45 7:50 7:55 −550 −540 −530 −520 −510 −500 −490 −480 B SM Z nT
Cluster Magnetic field 24 August 2000
Fig. 4. The Z, Y and X magnetic field components in SM coordinates between 07:15 and 07:55 UT on 24 August 2000. This corresponds to
the region of field-aligned currents in the southern cusp.
7:270 7:28 7:29 7:30 7:31 7:32 7:33 7:34 7:35 7:36 7:37 7:38 7:39 7:40 7:41 7:42 7:43 7:44 7:45 20 40 |B| nT UT 7:27 7:28 7:29 7:30 7:31 7:32 7:33 7:34 7:35 7:36 7:37 7:38 7:39 7:40 7:41 7:42 7:43 7:44 7:45 −30 −20 −10 0 10 BX nT 7:27 7:28 7:29 7:30 7:31 7:32 7:33 7:34 7:35 7:36 7:37 7:38 7:39 7:40 7:41 7:42 7:43 7:44 7:45 −20 −10 0 10 20 BY nT 7:27 7:28 7:29 7:30 7:31 7:32 7:33 7:34 7:35 7:36 7:37 7:38 7:39 7:40 7:41 7:42 7:43 7:44 7:45 −20 −10 0 10 20 BZ nT
Cluster Magnetic field 24 August 2000
Fig. 5. De-trended magnetic field components and field magnitude between 07:27 and 07:45 UT on 24 August 2000. The de-trending was
10:15 10:20 10:25 10:30 10:35 10:40 10:45 10:50 10:55 11: 0 −500 −450 −400 −350 −300 −250 hrs:mns UT B SM X nT 10:15 10:20 10:25 10:30 10:35 10:40 10:45 10:50 10:55 11: 0 −180 −160 −140 −120 −100 B SM Y nT 10:15 10:20 10:25 10:30 10:35 10:40 10:45 10:50 10:55 11: 0 −250 −200 −150 −100 B SM Z nT
Cluster Magnetic field 24 August 2000
Fig. 6. The Y , Z and X magnetic field components in SM coordinates between 10:15 and 11:00 UT on 24 August 2000. This corresponds to
the region of field-aligned currents in the northern cusp.
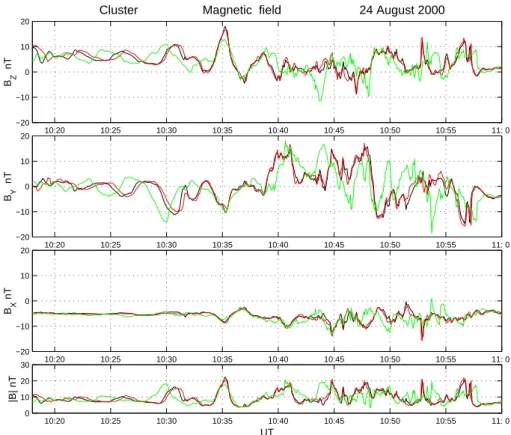
10:20 10:25 10:30 10:35 10:40 10:45 10:50 10:55 11: 0 0 10 20 30 |B| nT UT 10:20 10:25 10:30 10:35 10:40 10:45 10:50 10:55 11: 0 −20 −10 0 10 20 BX nT 10:20 10:25 10:30 10:35 10:40 10:45 10:50 10:55 11: 0 −20 −10 0 10 20 BY nT 10:20 10:25 10:30 10:35 10:40 10:45 10:50 10:55 11: 0 −20 −10 0 10 20 BZ nT
Cluster Magnetic field 24 August 2000
with a delay of approximately 10 s between the space-craft. These are a series of structures moving in the neg-ative X-direction over the spacecraft at between 10 and 12 km/s and have scales of the order of 120–300 km. While the exact profiles are not identical, the overall form clearly is, and so we infer that the two spacecraft are flying through the same structure. This is in contrast to the field seen by spacecraft 2. The initial pulse be-tween 07:35:00 and 07:35:40 is broadly similar. How-ever, the subsequent Y -field structure is entirely differ-ent, which is indicative of structuring of the FACs, in this case, on a scale of less than 200 km (the separation in the Y -direction).
The corresponding data for the northern cusp crossing are shown in Figs. 6 and 7. Again, SM coordinates are used, and Fig. 7 shows the de-trended data. These figures show that the FACs are evident between 10:15 and 11:15. For this encounter, spacecrafts 1, 2 and 3 are separated by 450 and 350 km in the X-direction, with spacecraft 3 leading craft 2, which, in turn, leads spacecraft 1. The three space-craft have minimal Y -separation (maximum of 30 km), but in the Z-direction, spacecraft 3 is higher than spacecraft 1 and 2 by 250 km (see Figs. 2a, b for details). We believe that this configuration implies that spacecraft 1 and 2 are lying (approximately) along the same magnetic field line (see T89 plot in Fig. 2a), with spacecraft 3 leading the other two, and thus located on a different field line. The large-scale field structure has the following properties:
1. Superficially, we note that BY has a more ordered
struc-ture here than in the southward pass, with first a pos-itive and then a negative excursion. Indeed BY first
decreases below and then increases above its ambient value (Fig. 1), with maximum excursions of roughly 40 nT. At the same time, the X-field does not appear to show perturbations of a similar size. The fluctua-tions in the Z-field are also quite notable, of the order of 20 nT or so. One interpretation of the difference be-tween the values of the Y - and Z-components is that Cluster is flying through a large-scale cylindrical current channel, with the current flowing in the Z-direction and lasting from approximately 10:30 until 11:00. The rela-tively small value of BXwould arise if the three
space-craft flew through the centre of the current channel. 2. The fields seen by spacecraft 1 and 2 have very
sim-ilar profiles. This is consistent with their lying along approximately the same magnetic field line. However, there is sometimes a small delay of spacecraft 2 with respect to spacecraft 1 and vice versa (see below). 3. The field seen by spacecraft 3 has the same overall
enve-lope as the other two, but sometimes leads and at other times trails the other two field profiles.
As with the southerly cusp encounter, the fine structure of the field is seen better by the examination of de-trended data shown in Fig. 7. We draw the following conclusions:
1. The similarity of the fields measured by spacecraft 1 and 2 is even clearer here than in Fig. 6. For much of the time they are indistinguishable. If we assume that changes in the FACs propagate at the Alfv´en speed (taken as 104km/s), then changes between the two spacecraft would only be evident on timescales of
1 s. The small differences seen are likely to be due to the two spacecraft temporarily sampling different field lines.
2. From 10:22 until 10:30, prior to entry into the main re-gion of FACs, spacecraft 3 sees a similar structure to spacecraft 1 and 2, but approximately 90 s earlier. This is consistent with the three spacecraft flying through an approximately stationary magnetic field structure. 3. After 10:30, the current structure becomes more
com-plicated. While spacecraft 1 and 2 continue to see al-most identical fields, it is difficult to identify any rela-tionship between the fields seen by spacecraft 1 and 2, and spacecraft 3. This de-correlation is on a scale of separation between spacecraft 3, and spacecraft 1 and 2, i.e. roughly 450 km.
The reason for this highly disorganised current structure is unclear. The IMF is predominantly in the e/w direction, with a weak N/S component. The IMF BZis southward
be-tween 07:50 and 10:30, except for a 25 min interval bebe-tween 09:15 and 09:40 when it turns northward. With a 1 h 8 min delay from the L1 point to the magnetosphere, the northward field might be expected to arrive between 10:25 and 10:50, although there are obviously uncertainties in this timing. It is thus unclear whether the change in the FAC properties after 10:30 is due to the change in the direction of BZin the solar
wind. However, such values of interplanetary BZ are
un-likely to lead to strongly driven magnetopause reconnection. One possible conclusion is that the structure of the FACs is intrinsically fine-scale, even at quiet times. Further cusp mid-altitude crossings which will be made during the summer of 2001 will help revolve this point.
3 The high altitude cusp crossing of 13 February 2001
In early 2001, Cluster had its first encounter with the high-altitude cusps. Figure 8 shows a summary of the orbit and magnetic field measurements from the cusp crossing at 20:00 on 13 February 2001. The upper panel shows the space-craft position as a function of time projected onto the X − Z plane. The orbit projection onto the GSM X − Y plane is not shown since all of the spacecraft were at approxi-mately Y = 2 RE throughout the encounter. Projected T89
field lines are shown for reference. During the cusp en-counter, spacecraft 1 led the others in the X-direction by be-tween 400 km (spacecraft 4) and 600 km (spacecraft 2 and 3). Spacecraft 1 and 4 were displaced from spacecraft 2 and 3 by approximately 250 km in the Y -direction. One would thus expect any magnetopause or cusp crossing to be seen
19: 0 19:10 19:20 19:30 19:40 19:50 20: 0 20:10 20:20 20:30 20:40 20:50 21: 00 20 40 60 80 100 hrs UT |B| nT −5 0 5 10 15 20 −15 −10 −5 0 5 10 13 February 2001 X Re Z Re Cusp @ 20:00 UT
Fig. 8. The top panel shows the Cluster orbit on 13 February 2001
in the X − Z GSE plane. The lower panel shows the magnetic field magnitude measured by the four Cluster spacecraft between 19:00 and 21:00 UT. The standard colour-coding is used. Note the field depression corresponding to the cusp between 20:00 and 20:10 UT.
first by spacecraft 1, and then by the other three in quick suc-cession.
The upper panel of Fig. 8 suggests that the inward encounter of the southern cusp should occur at around 20:00 UT on 13 February. The lower panel of Fig. 8 shows the magnetic field magnitude seen by the four Cluster craft for two hours centred on 20:00 UT. The four space-craft are first in the magnetosheath, which can be identified by the high levels of magnetic field turbulence. The cusp is identified as the region of the field drop-out, commencing at roughly 20:00 and ending at roughly 20:07. This is followed by a region with large field fluctuations (there is a possible partial cusp re-entry at 20:12) and the magnetosphere proper was entered at approximately 20:25. The total time spent by Cluster in the cusp itself was 7 min, with a further 18– 20 min in the region between the cusp and magnetosphere, presumably a boundary layer of some form. We believe this encounter probably occurred at the tailward edge of the cusp (see below), so that the full extent of the cusp was not sam-pled.
The relevant observations from ACE are shown in Fig. 9. The temporal resolution of the magnetic field and plasma measurements are 16 and 64 s, respectively. The solar wind
Fig. 9. The solar wind conditions measured by the ACE
space-craft between 17:00 and 21:00 UT on 13 February 2001. The six panels show BX, BY, BZ, B, N and V , respectively.
speed was in the range of 520–550 km/s for several hours during the latter part of 13 February, but with a modest den-sity of 5–6 cm−3. The IMF had turned southward before 17:00 UT, and remained pointing in that direction for the re-mainder of the day. The strength of the southward field var-ied, with a minimum of −10 nT and for the time of inter-est it was in the range of −5 to −6 nT. There was no sig-nificant dawn-dusk field after 18:00 UT. Thus, the magneto-sphere was in a state where significant magnetic reconnection would be expected at the sub-solar point, and the poleward-propagating signatures of such reconnection make the inter-pretation of the cusp more difficult (e.g. Smith and Lock-wood, 1996). For the measured solar wind speed, the transit time from ACE to the cusp is approximately 48 min. Thus, for the encounter at 20:00, the relevant IMF is a southward field of around −7 nT.
A more detailed presentation of the data in GSE coordi-nates from the half hour period between 19:48 and 20:18 is shown in Fig. 10, with the period between 20:00 and 20:10 shown in Fig. 11. The main results from this encounter are:
19:500 19:52 19:54 19:56 19:58 20: 0 20: 2 20: 4 20: 6 20: 8 20:10 20:12 20:14 20:16 20:18 20:20 20 40 60 80 |B| nT UT 19:500 19:52 19:54 19:56 19:58 20: 0 20: 2 20: 4 20: 6 20: 8 20:10 20:12 20:14 20:16 20:18 20:20 100 200 300 φB (deg) 19:50 19:52 19:54 19:56 19:58 20: 0 20: 2 20: 4 20: 6 20: 8 20:10 20:12 20:14 20:16 20:18 20:20 −50 0 50 θB (deg) 19:50 19:52 19:54 19:56 19:58 20: 0 20: 2 20: 4 20: 6 20: 8 20:10 20:12 20:14 20:16 20:18 20:20 −20 −15 −10 −5 0 5 10 BX nT 19:50 19:52 19:54 19:56 19:58 20: 0 20: 2 20: 4 20: 6 20: 8 20:10 20:12 20:14 20:16 20:18 20:20 −60 −40 −20 0 20 40 BY nT 19:50 19:52 19:54 19:56 19:58 20: 0 20: 2 20: 4 20: 6 20: 8 20:10 20:12 20:14 20:16 20:18 20:20 −80 −60 −40 −20 0 BZ nT
Fig. 10. The three magnetic field components, the angles θ and φ and the field magnitude between 19:50 and 20:20 UT on 13 February 2001.
1. Prior to 19:50, Cluster experiences magnetosheath con-ditions, with waves and other disturbances seen by spacecraft 2–4 prior to spacecraft 1. This is consistent with convecting structures. There is no evidence of an obvious magnetopause crossing prior to cusp entry (this would appear as an abrupt change in the field seen by spacecraft 1, followed by a change at the other three spacecraft).
2. Convecting structures are still evident up to cusp en-try. Examination of the BY and θ plots between 19:57
and 20:00:30 show signals seen first by spacecraft 3 and 4 (green and red), then by spacecraft 4 (blue), and fi-nally by spacecraft 1 (black). Examination of the upper panel of Fig. 8 indicates that this is the expected order for structure as it is swept along the magnetopause, per-haps the consequence of sub-solar reconnection.
How-ever, these convecting structures are less apparent in
BX, which is significantly weaker.
3. Entry into the cusp occurs between 20:00:00 and 20:01:00 UT. It is associated with a significant field ro-tation and a decrease in BY to nearly zero. Cusp entry
also appears to all four spacecraft as a smooth decrease in field magnitude. There is no obvious order: the de-crease does not occur first at spacecraft 1, as would be expected for a magnetopause crossing. Using minimum variance analysis (MVA), we have calculated the local normal at the boundary between the cusp and magne-tosphere. On entry (20:00–20:01), the normal direction in GSE coordinates is (0.96, −0.22, −0.15), with all spacecraft having the same normal to within 5%. The interpretation of this cusp entry is unclear. We believe that the interval between 20:00 and 20:07 does
corre-20: 00 20: 1 20: 2 20: 3 20: 4 20: 5 20: 6 20: 7 20: 8 20: 9 20:10 20 40 60 80 |B| nT UT 20: 00 20: 1 20: 2 20: 3 20: 4 20: 5 20: 6 20: 7 20: 8 20: 9 20:10 100 200 300 φB (deg) 20: 0 20: 1 20: 2 20: 3 20: 4 20: 5 20: 6 20: 7 20: 8 20: 9 20:10 −80 −60 −40 −20 0 θB (deg) 20: 0 20: 1 20: 2 20: 3 20: 4 20: 5 20: 6 20: 7 20: 8 20: 9 20:10 −15 −10 −5 0 5 10 BX nT 20: 0 20: 1 20: 2 20: 3 20: 4 20: 5 20: 6 20: 7 20: 8 20: 9 20:10 −40 −20 0 20 40 BY nT 20: 0 20: 1 20: 2 20: 3 20: 4 20: 5 20: 6 20: 7 20: 8 20: 9 20:10 −80 −60 −40 −20 0 BZ nT
Fig. 11. The three magnetic field components, the angles θ and φ, and the field magnitude between 20:00 and 20:10 UT on 13 February
2001.
spond to the cusp, but the absence of a clear magne-topause entry is puzzling. Instead, entry appears to take place through a transient magnetosheath structure with a significant dawn/dusk field component. Further analysis (including plasma and wave data) is needed to resolve this issue and will be presented elsewhere.
4. The exit from the cusp takes place between 20:07 and 20:08, identified by the increase in the field magnitude and a settling down of θ such that the field now points almost southward, which is the expected magneto-spheric field orientation. Upon exit (20:07–20:08 UT), the normal direction is (1.0,−0.07, −0.03). This is con-sistent with the spacecraft appearing to leave the cusp through its rear (tailward) boundary. The exit from the cusp occurs abruptly for spacecraft 1 (over about 20 s), while it is slower for the others (over about 1 min). We
conclude that the cusp boundary is moving Earthward during this time, with speeds obtained from MVA of 20 km/s (at spacecrafts 2–4), and increasing to 45 km/s (at spacecraft 1). There is a small cusp re-entry expe-rienced by the three trailing spacecraft (2–4), but not by the leading one (spacecraft 1) at around 20:12. This indicates that either the cusp boundary has moved tail-ward at a few km/s, or that a disturbance has detached from the cusp, and convects over the spacecraft (note the delay seen by spacecraft 4 with respect to spacecraft 2 and 3).
5. In the cusp itself, BZ undergoes large amplitude
fluc-tuations, while BXand BY are quieter. While showing
some differences on timescales of 4 s, the fields seen by spacecraft 2–4 are superficially quite similar. These three spacecraft lie in a plane that would be expected to
enter the cusp at roughly the same time (the separation is small: 250 km, and their orientation matches up with the expected curvature of the magnetopause at the entry point). However, while showing a similar general en-velope to spacecraft 2–4, the fields seen by spacecraft 1 are different. We consider the period between 20:05 and 20:08:30. The field components seen by spacecraft 1 are stronger, and they have a different structure, indicating that while the overall cusp shape may remain broadly the same, the internal structure changes on timescales of a few seconds.
The above results only touch on the very rich structure in this cusp encounter. Other crossings that we have looked at are also complex. However, it is clear that for this case with a strong southward IMF, the cusp is a highly dynamic struc-ture, with a complex exit, entry and internal structure that is almost certainly influenced by reconnection elsewhere on the magnetopause (Smith and Lockwood, 1996). It will be im-portant in the future to benchmark these results by looking at quieter times, and IMF conditions when the field is predom-inantly northward.
4 Discussion
We have presented the first Cluster magnetic field observa-tions from the mid- and high-altitude cusp. We have shown that multiple spacecraft measurements permit the identifica-tion of small-scale currents embedded within a larger field-aligned current in the mid-altitude cusp. Analysis of a high-altitude cusp crossing has shown that the cusp magnetic field structure is highly dynamic, changing on a timescale of a few seconds, with large amplitude waves most likely present. Whether or not this is due to the intrinsic unsteadiness of the cusp, its response to different magnetosheath conditions, or a combination of the two will be the subject of further study. The present results have only considered the magnetic field measurements. In order obtain a complete picture, anal-ysis of other data (especially from the plasma instruments PEACE and CIS) will be required. Only with such multi-instrument analyses can the intrinsically unsteady and frag-mented nature of the cusp, so tantalisingly revealed in the present work, be fully understood.
Acknowledgements. Cluster data exploitation at Imperial College is supported by PPARC. We acknowledge use of ACE data from the
Magnetic Field Experiment (MAG: P.I. N. Ness) and the SWEPAM experiment (P.I. D. McComas).
Topical Editor G. Chanteur thanks S. A. Fuselier and another referee for their help in evaluating this paper.
References
Balogh, A., et al.: The Cluster magnetic field investigation, Space Sci. Rev. 71, 5, 1997.
Balogh, A., Carr, C. M., Acu˜na, M. H., et al.: The Cluster magnetic field investigation: overview of in-flight performance and initial results, Ann. Geophysicae, this issue, 2001.
Dunlop, M. W., Cargill, P. J., Stubbs, T. J., and Woolliams, P.: The High Altitude Cusps: Heos 2, J. Geophys. Res., 105, 27 509, 2000.
Eastman, T. E., Boardsen, S. A., Chen, S.-H., and Fung, S. F.: Con-figuration of high-latitude and high-altitude boundary layers, J. Geophys. Res., 105, 23 193, 2000.
Grande, M., et al.: First polar and 1995–034 observations of the midaltitude cusp during a persistent northward IMF condition, Geophys. Res. Lett., 24, 1475, 1997.
Haerendel, G., Pashmann, G., Sckopke, N., and Rosenbauer, H.: The Frontside Boundary Layer of the Magnetosphere and the Problem of Reconnection, J. Geophys. Res., 83, 1978.
Ijima, T.: Field-aligned currents in geospace: substance and sig-nificance, in Magnetosheric Current Systems, AGU Geophysical Monograph 118, 107, 2000.
Kivelson, M. G. and Russell, C. T.: Introduction to space physics, Cambridge University Press, 1995.
Mˇerka, J., Safrankova, J., Nˇemecek, Z., Savin, S., and Skalsky, A.: High altitude cusp: INTERBALL observations, Adv. Space. Res., 25, 7/8, 1425, 2000.
Nˇemecek, Z., Mˇerka, J., and Safrankova, J.: The tilt angle control of the outer cusp position, Geophys. Res. Lett., 27, 77, 2000. Sandahl, I., Popielawska, B., Budnick, E. Y., Fedorov, A., Savin,
S., Safrankova, J., and Nˇemecek, Z.: The cusp as seen from In-terball, in Proc., Cluster-II workshop on Multiscale/Multipoint plasma measurements, ESA SP–449, 39, 2000.
Smith, M. F. and Lockwood, M.: Earth’s magnetospheric cusps, Revs. Geophys., 34, 233, 1996.
Strangeway, R. J., et al.: FAST observations of electromagnetic stresses applied to the polar ionosphere, in Magnetospheric Cur-rent Systems, AGU Geophysical Monograph 118, 21, 2000. Tsyganenko, N. A.: A magnetospheric magnetic field model with a
warped tail current sheet, Planet. Space Sci., 37, 5–20, 1989. Zhou, X. W. and Russell, C. T.: The location of the high latitude
polar cusp and the shape of the surrounding magnetosphere, J. Geophys. Res., 102, 105, 1997.