M A J O R A R T I C L E
A Community-Randomized Evaluation of
the Effect of Intermittent Preventive Treatment
in Infants on Antimalarial Drug Resistance in
Southern Tanzania
Richard J. Pearce,1Rosalynn Ord,1Haprarksh Kaur,1Cecylia Lupala,2Joanna Schellenberg,1,2Kitzito Shirima,2 Fatuma Manzi,2Pedro Alonso,3Marcel Tanner,4Hassan Mshinda,2Cally Roper,1and David Schellenberg1,2 1
London School of Hygiene and Tropical Medicine, London, United Kingdom;2Ifakara Health Institute, Tanzania;3Barcelona Centre for International Health Research, Hospital Clinic, Universitat de Barcelona, Spain; and4Swiss Tropical Institute, Basle, Switzerland
Background. Intermittent preventive treatment in infants (IPTi) is the administration of sulfadoxine-pyrimethamine (SP) at 2, 3, and 9 months of age to prevent malaria. We investigated the influence of IPTi on drug resistance.
Methods. Twenty-four areas were randomly assigned to receive or not receive IPTi. Blood collected during representative household surveys at baseline and 15 and 27 months after implementation was tested for SP and resistance markers.
Results. The frequency of SP in blood was similar in the IPTi and comparison areas at baseline and at 15 months. dhfr and dhps mutations were also similar at baseline and then increased similarly in both arms after 15 months of SP-IPTi. First-line treatment was switched from SP to artemether-lumefantrine before the final survey, when SP positivity fell among infants in comparison areas but increased in IPTi areas. This was accompa-nied by an increase in dhfr but not dhps mutations in IPTi areas (P = .004 and P = .18, respectively).
Conclusions. IPTi did not increase drug pressure or the selection on dhfr and dhps mutants, when SP was the first-line malaria treatment. Introduction of artemether-lumefantrine was followed by an increase in dhfr muta-tions, consistent with weak selection attributable to SP-IPTi, but not by an increase in dhps mutamuta-tions, suggesting afitness cost of this mutation.
Keywords. Malaria; IPTi; sulfadoxine; pyrimethamine; dhfr; dhps; mutations.
Intermittent preventive treatment in infants (IPTi) consists of treatment doses of an antimalarial at the time of routine vaccinations in the first year of life. IPTi can reduce malaria and anemia in young children in malaria-endemic countries [1], but concerns remain about its effect on drug resistance.
IPTi has been associated with increases in resistant parasites among recipients [2–4], although this is not
a consistentfinding [5]. More important, however, is the effect of IPTi on the spread of resistance through the whole population. Models suggest only a small effect at this level [6,7], but this has not been evaluat-ed in thefield. We measured the impact of IPTi with sulfadoxine-pyrimethamine (SP) on population-wide resistance in a setting of high malaria endemicity in southern Tanzania.
There is no established method for the evaluation of the effect of public health interventions on the spread of resistance. It is important to test the effects over as many replicates as possible, to reduce the likelihood of confounding due to an imbalance between interven-tion and comparison arms. The optimal size of each replicate is not known: they should be large enough to ensure that contaminating gene flow between inter-vention and comparison areas does not obscure Received 2 February 2012; accepted 21 September 2012; electronically
pub-lished 5 December 2012.
Correspondence: Cally Roper, PhD, London School of Hygiene and Tropical Med-icine, Keppel St, London, WC1E 7HT, United Kingdom ([email protected]). The Journal of Infectious Diseases 2013;207:848–59
© The Author 2012. Published by Oxford University Press on behalf of the Infectious Diseases Society of America. All rights reserved. For Permissions, please e-mail: [email protected].
selection of resistant parasites but not so large that the evalua-tion becomes unfeasible or the parasite populaevalua-tions in different replicates are so unrelated they are incomparable. This suggests a need for baseline studies of genetic exchange between repli-cates, which we did using neutral microsatellite markers.
The drug recommended for IPTi is SP, a coformulation of competitive inhibitors of the folate biosynthesis enzymes dihy-dropteroate synthase (DHPS; inhibited by sulfadoxine) and di-hydrofolate reductase (DHFR; inhibited by pyrimethamine). Resistance to SP is conferred by substitutions within the active site of target enzymes, as inferred by in vitro studies [8–12], by the predictive association of particular mutations with treatment failure [13–15], and from overrepresentation of mu-tations in recrudescent infections after treatment [16–26]. In both enzymes, increasing numbers of substitutions confer increasing levels of insensitivity to drug, with single- or double-mutant dhfr alleles being mildly resistant while the triple-mutant dhfr allele is highly resistant. The combination of the dhfr triple-mutant N51I + C59R + S108N (CIRN) and the dhps double-mutant A437G + K540E (SGE) predicts failure of SP treatment [13–15]. Drug pressure arising from IPTi-SP can be assessed in a number of ways. First, blood specimens from a representative sample of people living in in-tervention and comparison areas can be tested for sulfadoxine; the proportion of positive blood spots reflects drug pressure in the different populations.
Second, dhfr and dhps resistance mutations can be tracked in intervention and comparison areas. If gene frequencies measured at baseline are similar in the 2 arms, then direct comparison of frequencies at follow-up indicates the differing degrees of selection. Estimation of the selection coefficient of key resistance alleles in intervention and comparison areas provides a measure of the rate of change of gene frequencies.
The third approach is to estimate the linkage disequilibrium between different dhfr and dhps alleles, in particular the dhfr triple-mutant CIRN and the dhps double-mutant SGE. These 2 alleles independently segregate on 2 different chromosomes but can be maintained in linkage disequilibrium by drug selec-tion despite recombinaselec-tion, because of the improved survival of the combined CIRN +SGE genotype.
By using these approaches, we report a community-randomized study that evaluated the extent to which IPTi increased drug pressure and the selection of resistant parasites. METHODS
Study Area
The study was conducted in 5 districts of southern Tanzania [27], with a total population of approximately 900 000 individ-uals, including approximately 23 400 infants. The districts are subdivided into 24 administrative areas, called divisions. IPTi was randomly assigned to 12 divisions [28], leaving 12
divisions as controls, and unblinded IPTi implementation started in all 62 vaccinating health facilities in intervention di-visions in April 2005. Tablets of SP were offered to children attending facilities for routine vaccinations with diphtheria– tetanus toxoid–acellular pertussis, hepatitis B virus, and oral poliovirus vaccine, at approximately 2 and 3 months of age, and a third dose was offered when attending for measles vac-cination, at about 9 months of age. Children weighing <5 kg received a quarter tablet of Fansidar, and those weighing≥5 kg received a half tablet of Fansidar; 1 tablet contains 500 mg of sulfadoxine and 25 mg pyrimethamine. In 2006, a minimum estimate of 47% of neonates aged 6–11 months had received at least 2 doses of IPTi, with a maximum of 76% having re-ceived at least 1 dose in IPTi areas [28].
At study start, first-line treatment for malaria was SP, but this changed in 2006 to artemether-lumefantrine (ALu) which became available after the 2006 survey. Diagnostic facil-ities were only available at approximately 10% of health facilities, so the majority of malarial diagnoses were made presumptively.
Household Surveys
Cross-sectional surveys in a representative cluster sample of households from the 24 divisions were conducted in July– August 2004 (baseline) and July–August 2006 (follow-up). A third survey was conducted during July–November 2007. The baseline [27] and 2006 [28] surveys are described in detail else-where. In brief, all residents in 8 clusters of 30 households were sampled from each division for blood sampling. Each household in a division had an equal chance of inclusion, and no substitute household was included if residents were repeat-edly absent or did not wish to participate. A modular ques-tionnaire was administered using personal digital assistants (PDAs) [29]. Participants of all ages were invited to attend a measuring station located in the middle of the village, where a sample of blood was collected byfinger prick and tested for Plasmodium falciparum malaria parasitemia, using the HRP-II–based Paracheck rapid diagnostic test (Orchid Biomedical Systems, Goa, India). A drop of blood was collected onto Whatman III filter paper. After air drying, filter papers were stored in ziplock plastic bags and shipped to the molecular laboratory for analysis. Sample sizes were amended for the 2006 and 2007 surveys, based on the prevalence of parasitemia and intracluster correlation coefficient of parasitemia in the previous survey. In 2006, this resulted in the random selection of 10 households per cluster for molecular studies. In 2007, sampling was stratified by age on the basis of the prevalence of parasitemia, such that all children aged 2–11 months, 12% of children aged 1–4 years, and 3% of children aged ≥5 years were sampled. This approach was expected to yield similar numbers of positive samples in each age group, and overall estimates of prevalence were weighted during the analysis
according to the sampling fraction. Each survey was powered to estimate the prevalence of dhfr triple-mutant and dhps double-mutant alleles to within 15% of the true absolute prev-alence in each trial arm. The 2006 and 2007 surveys each had 80% power to detect a change of≥10 percentage points in the frequency of dhps double-mutant alleles from baseline.
High-Performance Liquid Chromatography (HPLC) Analyses
The quality of a representative number of tablets of Fansidar was assessed using HPLC as described previously [30]. A simple random sample of filter papers with adsorbed blood samples were analyzed for SP, using HPLC with photodiode array detection. Antimalarial drugs were extracted from the filter paper into methanol, and 20 µL was injected directly onto the HPLC column with gradient elution from 100% solvent A (20 mM ammonium formate; pH 2.7) to 100% solvent B (acetonitrile) over 15–25 minutes at a flow rate of 1.35 mL/minutes and a detector setting of 259 nm. Peak iden-tity was confirmed by measuring the retention time, spiking the sample with commercially available standards, and deter-mining the absorbance spectra by using the photodiode array detector. HPLC equipment and software were from Dionex (Camberley, United Kingdom). The sampling procedure was modified in the 2007 survey to account for the age stratifica-tion, with a simple random sample of 200 individuals per age group selected without considering the treatment arm from which the samples came.
SNP Genotyping
Blood spots from infected individuals were selected for analy-sis, with a maximum of 1 infected individual sampled at random per household. Parasite DNA was extracted using the chelex method [31], and polymerase chain reaction (PCR)–
based sequence-specific oligonucleotide probing (SSOP) at codons 436, 437, and 540 of dhps and codons 50, 51, 59 and 108 of dhfr was performed using methods described previous-ly [31]. Samples taken during 2007 were sequenced using Big Dye V3.1 dye terminator sequencing and ABi 3730 DNA ana-lyzer (Applied Biosystems, Foster City, CA). The same primers were used to preamplify dhfr for SSOP and direct se-quence typing [31] Two additional primers were used in se-quencing dhps [32]. A sample was considered to have a single haplotype when only 1 sequence variant was found at each locus. In mixed genotype infections, majority genotypes were recorded if their hybridization signal was twice that of the mi-nority sequence. One haplotype only was counted from each infection, and mixed infections in which haplotypes could not be resolved were omitted from the frequency calculations.
Microsatellite Analysis
To describe the extent of gene flow between divisions, 6 mi-crosatellite markers, PfG377, PfPk2, PolyA, ARA, TA109, and
TA87, were amplified in baseline survey samples following a protocol previously described [33]. Amplification products were diluted a ratio of 1:100 into Hi Di formamide, run with LIZ-500 size standard on the ABi 3730 DNA analyzer (Applied Biosystems), and analyzed using Genemapper soft-ware (Applied Biosystems).
Multiplicity of infection was determined by counting the number of peaks observed at PolyA, PfPk2, and TA109 and calculating the average number of peaks across the 3 loci. This is a more conservative estimator of multiplicity of infection than taking the largest of the 3 values.
Molecular and HPLC laboratory analyses were conducted with laboratory workers blind to whether samples came from IPTi or comparison areas.
Data Processing and Analytical Methods
Palm m130 PDAs with 8 Mb RAM and running Pendragon Forms 4.0 software were used to enter data in thefield. Auto-mated range, consistency, and completeness checks were per-formed at the time of data entry. Particular attention was paid to the accuracy of dates because age is prone to recall errors.
Molecular and HPLC data analyses were performed in the statistical package R [34]. Analytical methods were those ap-propriate for cluster-randomized trials with a small number of clusters [35], with statistical testing based on the t test, using a summary measure (eg, mean frequency) of the data from each of the 12 intervention and 12 comparison divisions. This adjusts both for the survey and study designs. Weighted t tests were used for comparisons across age strata of the HPLC data, using Bland’s method [36].
Population structure at the unlinked microsatellites for all pairwise comparisons of divisions was determined using the fixation index FST, calculated in Arlequin [37], and Nei’s
stan-dard genetic distance [38], calculated in Phylip [39]. FST calcu-lates the portion of expected heterozygosity that is attributable to population subdivision, whereas Nei’s distance is based on allele frequency differences between populations. Both indices range between 0 and 1, with 0 indicating that populations are identical.
Ethics
The trial (clinical trials registration NCT00152204) was ap-proved by local and national institutional review boards (the Ifakara Health Institute [formerly the IHRDC] and the Na-tional Tanzania Medical Research Co-coordinating Commit-tee). Ethics and research clearance were also obtained from LSHTM and from the Ethics Commission of the Cantons of Basel-Stadt and Basel-Land, Switzerland. During field work, information sheets in Swahili were provided, and written informed consent was sought from the heads of all households.
RESULTS
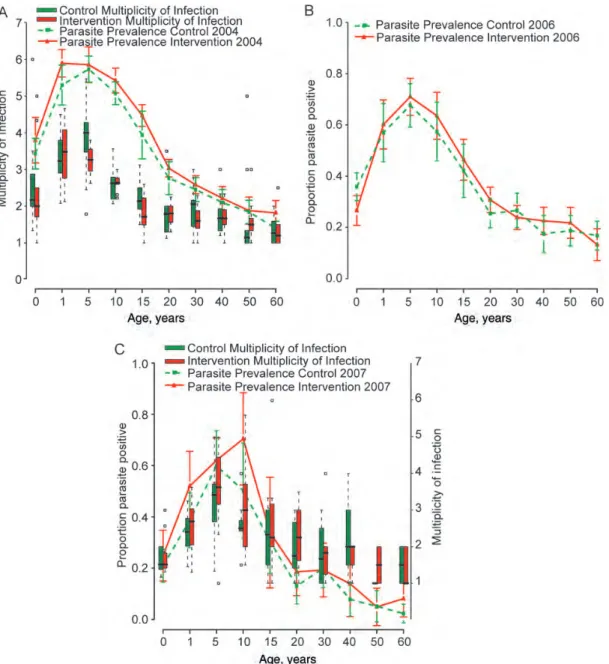
Figure 1shows that parasite prevalence, multiplicity of infec-tion, and the age-pattern of each was comparable in interven-tion and comparison divisions at each survey point. Parasite prevalence fell to a similar extent in both arms during the trial. Heterozygosity, a measure of genetic diversity, was high across the 24 divisions, with mean values ranging from 0.771 to 0.831. Pairwise FSTvalues ranged from <0 to 0.07 (only 5 comparisons were significantly >0), and Nei’s standard genetic distance ranged from 0.031 to 0.139 (data available on
request), indicating a high degree of genetic similarity among divisions.
SP Detection
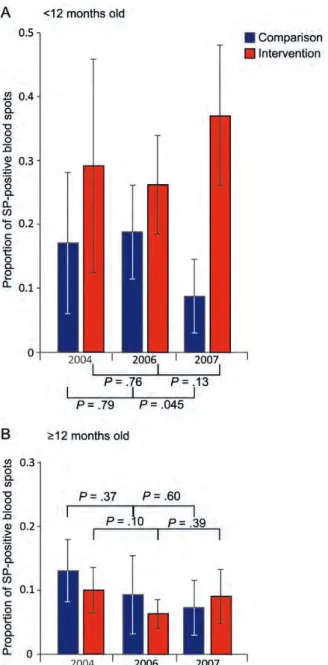
Figure 2 shows the proportion of SP-positive blood spots in comparison and intervention populations, by age. At both baseline and in 2006, there was no evidence of any difference in SP positivity between trial arms in the group aged <1 year (2004, P = .251; 2006, P = .186) or the group aged ≥1 year (2004, P = .34; 2006, P = .38). In 2007, the proportion of SP-positive blood spots was lower in the comparison arm than in
Figure 1. Parasite prevalence among age groups, with 95% confidence intervals, for the baseline 2004 survey (A) and the postintervention surveys in 2006 (B) and 2007 (C). The comparison arm is shown by a dashed green line, and the intervention arm is denoted by a solid red line. The multiplicity of infection was measured in 2004 and 2007 and is shown by the box plots (comparison, green; intervention, red), which specify the median among divisions in each arm, with interquartile ranges and the upper and lower extremes of the distribution. Statistical outliers are indicated by small squares.
the intervention arm in the <1 year group (8.8% [n = 117] vs 37.1% [n = 79]; P = .0003). There was no significant difference in the ≥1 year group (7.3% [n = 218] vs 9.1% [n = 180]; P = .57).
Resistance Alleles and Selection Coefficients
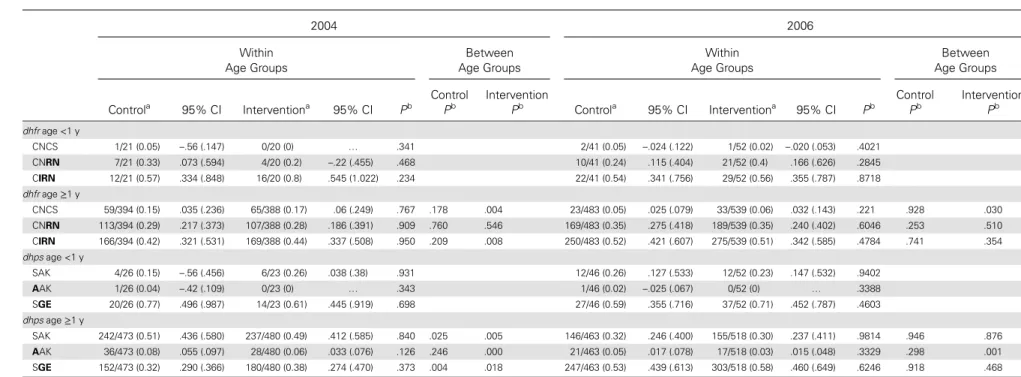
Table 1shows the number of samples typed and included in subsequent analyses and the frequency of the various alleles
identified. Mutations were found at codons 51, 59, and 108 but not codon 164 of dhfr and at codons 436, 437, and 540 of dhps. In 2007, the 581 dhps mutation was found in 0.5% of samples from the comparison arm but was absent from the intervention arm. A previously unidentified S436H substitu-tion was found among 12 of the 394 samples sequenced for dhps in 2007.
The frequencies of the dhfr triple-mutant CIRN allele and the dhps double-mutant SGE haplotypes in each division are shown in Figure3. The general trend was for dhfr mutant fre-quencies to increase over time. The CIRN allele frequency was not different in the 2 study arms in 2004 (P = .89) or 2006 (P = .93), and SGE frequencies were also comparable between arms at these times (2004, P = .52; 2006, P = .54). However, in 2007, the CIRN allele frequency was higher in the intervention than in the comparison arm (P = .004). The frequency of the SGE allele was (nonsignificantly) higher in the intervention arm than in the comparison arm (P = .18).
The corresponding selection coefficients were similar in the 2 arms of the trial between 2004 and 2006 (Table2). However, the 2006–2007 SGE selection coefficient became negative, most markedly in the comparison arm.
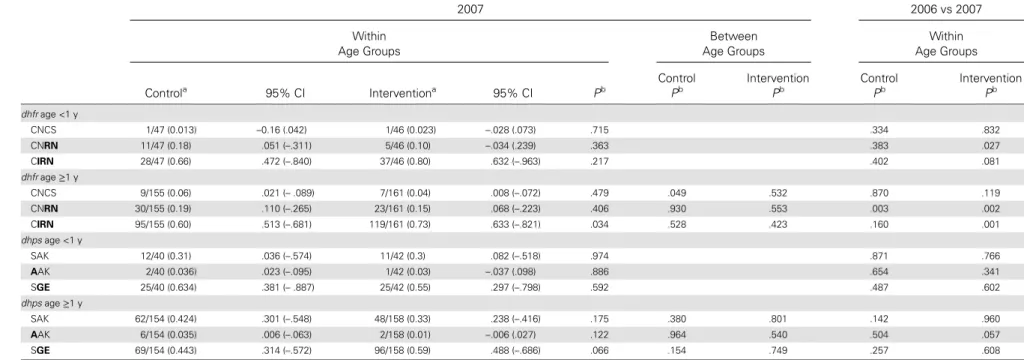
To assess the specific impact of IPTi among infants, we compared resistance allele frequencies in subjects aged <1 year with those among subjects aged >1 year. There was some evi-dence that the frequency of resistance alleles was higher among those aged <1 year than in older age groups across both arms at all time points (Table3). There was no discern-ible effect of IPTi on the frequency of resistance among sub-jects aged <1 year in the intervention arm. Among subsub-jects aged ≥1 year, the only evidence of a difference in resistance allele frequencies was in 2007, when the CIRN allele frequency was 13 percentage points higher in the intervention arm (P = .034).
Linkage Disequilibrium
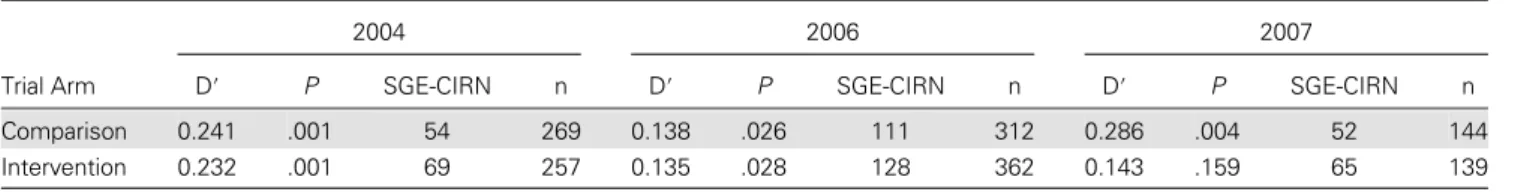
There was strong evidence of linkage disequilibrium between the dhfr triple-mutant CIRN and the dhps double-mutant SGE (Table 4), with a statistically significant association in
both arms at all 3 time points, except for the intervention arm in 2007.
DISCUSSION
We have described the impact of IPTi on the spread of resis-tance to SP at the population level. We monitored SP drug pressure, dhfr and dhps mutation frequencies, selection coeffi-cients, and linkage disequilibrium in the context of a pilot im-plementation of IPTi in a total population of approximately 1 million in southern Tanzania. Representative cross sectional household surveys were performed in 2004, before the intro-duction of IPTi, and again in 2006 and 2007, after 15 and 27
Figure 2. Proportion of sulfadoxine-pyrimethamine (SP)–positive blood spots in control (blue) and intervention (red) arms. SP positivity among children aged <12 months (A) and children aged ≥12 months (B ) are shown for 3 surveys, conducted in 2004, 2006, and 2007. Whiskers denote 95% confidence intervals, and the significance values arising from comparisons of SP positivity rates within the arms of the trial between consecutive time points are indicated.
Table 1. Number of Samples Typed and Included in the Analysis of Drug Resistance Alleles and the Frequencies of All dhfr and dhps Alleles Detected Over the 3 Surveys Survey 2004 2006 2007 DHFR No. samples 2144 2441 850 Typed at all SNPs 1234 1539 513 Mixed 411 424 104
Comparison (n = 415) Intervention (n = 408) Comparison (n = 524) Intervention (n = 591) Comparison (n = 202) Intervention (n = 207)
CIRN 0.435 0.444 0.512 0.517 0.600 0.743 CNRN 0.295 0.284 0.340 0.350 0.196 0.138 CNCS 0.131 0.148 0.052 0.059 0.047 0.036 CICN 0.058 0.063 0.069 0.053 0.15 0.08 CNCN 0.035 0.029 0.006 0.007 0.008 0.006 CICS 0.005 (…) 0.004 (…) (…) (…) CIRS 0.016 (…) (…) 0.002 (…) (…) CNRS 0.025 0.032 0.016 0.012 (…) (…) DHPS No. samples 2144 2441 850 Typed at all SNPs 1199 1458 529 Mixed 197 379 135
Comparison (n = 499) Intervention (n = 503) Comparison (n = 509) Intervention (n = 570) Comparison (n = 194) Intervention (n = 200)
SGE 0.352 0.383 0.529 0.564 0.467 0.570 SAK 0.488 0.487 0.320 0.322 0.402 0.330 SGK 0.021 0.026 0.015 0.014 0.006 0.005 AAK 0.075 0.052 0.045 0.029 0.038 0.012 AAE 0.002 0.004 0.002 0.003 (…) (…) AGE (…) (…) 0.017 0.004 0.012 0.003 CAE (…) (…) (…) 0.002 (…) (…) CAK 0.010 0.008 0.005 0.008 0.013 0.021 FAE (…) 0.003 (…) (…) (…) (…) FAK 0.028 0.024 0.019 0.017 0.011 0.018 FGK (…) 0.002 (…) (…) (…) (…) SAE 0.025 0.010 0.048 0.036 (…) (…) HAKAA na na na na 0.046 0.041 SGEGA na na na na 0.005 (…) Q uantifying Drug Pr essur e During IPTi
•
JID 2013:207 (1 Mar ch)•
853months of IPTi implementation. Malaria transmission, re flect-ed by parasite prevalence, multiplicity of infection, and the age-pattern of each, was comparable in IPTi and comparison areas throughout the study. There was considerable genetic di-versity among parasites across the study area, and gene flow
studies found no evidence of population subdivision between divisions. At baseline, the genetic determinants of SP resis-tance were present at similar frequencies in each study arm.
Between 2004 and 2006, while SP was the first-line treat-ment for malaria infections and the drug used for IPTi, the frequency of the CIRN and SGE alleles increased at a compa-rable rate in both study arms. The overall prevalence of SP was 11%–13% and not different between the comparison and intervention arms. Thus, IPTi had no measurable effect on SP drug pressure over that generated by its widespread use for treatment, suggesting that the number SP doses used for IPTi was balanced by the number of SP treatments for illness epi-sodes in comparison areas. IPTi may therefore be of greater value in areas where access to vaccination-based preventive services is better than access to drugs through curative services.
In late 2006, the national treatment policy with ALu was rolled out, and SP use decreased. However, the proportion of people aged >12 months who were positive for SP had changed little by the time of the 2007 survey, with SP detected in all age strata. There was a statistically significant decrease in detectable SP among individuals aged <12 months living in comparison areas, presumably because these infants were increasingly treated with ALu. In contrast, SP increased in infants where IPTi-SP continued.
The change in SP drug pressure in infants living in IPTi areas was associated with an overall increase in the frequency of the dhfr triple mutation and a corresponding 3-fold diff-erence in the selection coefficient for the CIRN allele. This suggests a population-wide effect on P. falciparum genotypes of an intervention targeting children aged 2–9 months. In contrast, the dhps double-mutant frequencies stabilized in both comparison and intervention divisions following with-drawal of SP asfirst-line therapy, with a suggestion of a de-crease in the comparison arm, in keeping with the notion that the SGE double mutant carries afitness cost [40].
The study has a number of limitations. We were limited to 12 intervention and 12 comparator divisions. Therefore,
Figure 3. Division-specific frequencies of the dhfr triple-mutant CIRN allele (A) and the dhps double-mutant SGE allele (B ) in the comparison (blue) and intervention (red) replicate divisions over time. The bold lines indicate the mean frequency in each treatment arm.
Table 2. Selection Coefficients and Mean Change in CIRN and SGE Allele Frequencies Across Divisions Within Trial Arms Between Consecutive Time Points
Mean Difference in Frequency
Allele, Trial Arm 2004–2006 P s 2006–2007 P s 2004–2007 P s s, 2004–2006–2007
CIRN Comparison 0.077 .955 0.090 0.089 .057 0.044 0.166 .152 0.075 0.077 Intervention 0.073 0.089 0.226 0.146 0.299 0.108 0.105 SGE Comparison 0.177 .938 0.069 −0.062 .278 −0.060 0.115 .316 0.026 0.033 Intervention 0.181 0.067 0.006 −0.002 0.187 0.044 0.047
Table 3. Allele Frequencies in People Under 1 Year Old and in People Older Than 1 Year 2004 2006 Within Age Groups Between Age Groups Within Age Groups Between Age Groups Controla 95% CI Interventiona 95% CI Pb Control Pb Intervention Pb Controla 95% CI Interventiona 95% CI Pb Control Pb Intervention Pb dhfr age <1 y CNCS 1/21 (0.05) –.56 (.147) 0/20 (0) … .341 2/41 (0.05) –.024 (.122) 1/52 (0.02) –.020 (.053) .4021 CNRN 7/21 (0.33) .073 (.594) 4/20 (0.2) –.22 (.455) .468 10/41 (0.24) .115 (.404) 21/52 (0.4) .166 (.626) .2845 CIRN 12/21 (0.57) .334 (.848) 16/20 (0.8) .545 (1.022) .234 22/41 (0.54) .341 (.756) 29/52 (0.56) .355 (.787) .8718 dhfr age ≥1 y CNCS 59/394 (0.15) .035 (.236) 65/388 (0.17) .06 (.249) .767 .178 .004 23/483 (0.05) .025 (.079) 33/539 (0.06) .032 (.143) .221 .928 .030 CNRN 113/394 (0.29) .217 (.373) 107/388 (0.28) .186 (.391) .909 .760 .546 169/483 (0.35) .275 (.418) 189/539 (0.35) .240 (.402) .6046 .253 .510 CIRN 166/394 (0.42) .321 (.531) 169/388 (0.44) .337 (.508) .950 .209 .008 250/483 (0.52) .421 (.607) 275/539 (0.51) .342 (.585) .4784 .741 .354 dhps age <1 y SAK 4/26 (0.15) –.56 (.456) 6/23 (0.26) .038 (.38) .931 12/46 (0.26) .127 (.533) 12/52 (0.23) .147 (.532) .9402 AAK 1/26 (0.04) –.42 (.109) 0/23 (0) … .343 1/46 (0.02) –.025 (.067) 0/52 (0) … .3388 SGE 20/26 (0.77) .496 (.987) 14/23 (0.61) .445 (.919) .698 27/46 (0.59) .355 (.716) 37/52 (0.71) .452 (.787) .4603 dhps age ≥1 y SAK 242/473 (0.51) .436 (.580) 237/480 (0.49) .412 (.585) .840 .025 .005 146/463 (0.32) .246 (.400) 155/518 (0.30) .237 (.411) .9814 .946 .876 AAK 36/473 (0.08) .055 (.097) 28/480 (0.06) .033 (.076) .126 .246 .000 21/463 (0.05) .017 (.078) 17/518 (0.03) .015 (.048) .3329 .298 .001 SGE 152/473 (0.32) .290 (.366) 180/480 (0.38) .274 (.470) .373 .004 .018 247/463 (0.53) .439 (.613) 303/518 (0.58) .460 (.649) .6246 .918 .468 Q uantifying Drug Pr essur e During IPTi
•
JID 2013:207 (1 Mar ch)•
8552007 2006 vs 2007 Within Age Groups Between Age Groups Within Age Groups Controla 95% CI Interventiona 95% CI Pb Control Pb Intervention Pb Control Pb Intervention Pb dhfr age <1 y CNCS 1/47 (0.013) –0.16 (.042) 1/46 (0.023) –.028 (.073) .715 .334 .832 CNRN 11/47 (0.18) .051 (–.311) 5/46 (0.10) –.034 (.239) .363 .383 .027 CIRN 28/47 (0.66) .472 (–.840) 37/46 (0.80) .632 (–.963) .217 .402 .081 dhfr age ≥1 y CNCS 9/155 (0.06) .021 (– .089) 7/161 (0.04) .008 (–.072) .479 .049 .532 .870 .119 CNRN 30/155 (0.19) .110 (–.265) 23/161 (0.15) .068 (–.223) .406 .930 .553 .003 .002 CIRN 95/155 (0.60) .513 (–.681) 119/161 (0.73) .633 (–.821) .034 .528 .423 .160 .001 dhps age <1 y SAK 12/40 (0.31) .036 (–.574) 11/42 (0.3) .082 (–.518) .974 .871 .766 AAK 2/40 (0.036) .023 (–.095) 1/42 (0.03) –.037 (.098) .886 .654 .341 SGE 25/40 (0.634) .381 (– .887) 25/42 (0.55) .297 (–.798) .592 .487 .602 dhps age ≥1 y SAK 62/154 (0.424) .301 (–.548) 48/158 (0.33) .238 (–.416) .175 .380 .801 .142 .960 AAK 6/154 (0.035) .006 (–.063) 2/158 (0.01) –.006 (.027) .122 .964 .540 .504 .057 SGE 69/154 (0.443) .314 (–.572) 96/158 (0.59) .488 (–.686) .066 .154 .749 .257 .608 a
Data are proportion (%) of subjects. b
Calculated by the t test.
Table 3 continued. 856
•
JID 2013:207 (1 Mar ch)•
P ear ce et aldespite restricted randomization, there is still potential for un-recognized confounders to render the study arms different in important respects. Because the study arms were comparable in terms of transmission intensity, baseline SP resistance markers, and SP drug pressure, and because care was taken to select representative samples of households during the surveys, there should be increased confidence in the validity of the results. We used counting of haplotypes among single and majority infections to generate simple estimates of haplotype frequency. While there are computationally sophisticated methods of incorporating mixed infections, these require thresholds of detection of minor alleles to be standard across assays for different loci, if systematic bias is to be avoided. We did not use these measures because this could not be guaran-teed across the large number of replicate assays performed during the course of this study. Second, a large number of sig-nificance tests were carried out and some of the differences may have arisen by chance. Nevertheless, adjustment of P values using the Bonferroni correction does not materially affect our results or conclusions. Third, follow-up continued for <2 years after the introduction of IPTi, and estimates of IPTi coverage were between 47% and 76% [28]. More pro-nounced effects may have been documented with longer follow-up or higher levels of coverage. Fourth, the use of HRP-II–based rapid diagnostic tests means that, because the HRP-II antigen persists after treatment, an individual may have been identified as parasite positive for >2 weeks after the infection had been effectively treated [41]. This resulted in a proportion of RDT-positive samples being PCR negative, re-ducing the number of samples contributing to analyses and the statistical power of the evaluation. However, both the geo-graphical scale and the significant differences in selection pres-sures and haplotype frequencies between the study arms add plausibility to the evaluation. These results and conclusions are specific to SP in eastern Africa. The fitness costs of the SGE allele may be different in western Africa, where an alter-native dhps allele is found [42]. In addition, the increase in frequency of resistance mutations is not linear, and this study was conducted when the baseline level of resistance was already high. The results may be different in settings with lower baseline resistance.
This study was conceived to evaluate the effect of IPTi-SP on the spread of SP resistance and the risk that IPTi-SP might undermine SP treatment efficacy. We have shown that IPTi-SP did not exacerbate the spread of resistance when delivered alongside SP forfirst-line malaria treatment. However, malaria treatment in many settings now depends on ACTs. When ACTs were introduced into the study area, the frequency of the dhfr triple mutant continued to climb, but the frequency of the dhps double mutant appeared to decrease. As treatment failure occurs primarily when dhfr triple is found in combina-tion with dhps double, we conclude that IPTi-SP is unlikely to undermine SP treatment efficacy.
The World Health Organization has recommended that IPTi-SP be considered in areas of moderate or intense malaria transmission [43], but not if the frequency of the 540 muta-tion—a marker of the quintuple mutation—is ≥50%. Many countries fulfilling the intensity criterion fail the resistance cri-terion [44]. Our study suggests that quintuple-mutation fre-quencies may fall once ACTs are deployed, and it draws attention to the need to monitor molecular markers of SP re-sistance where IPTi-SP may otherwise be useful for malaria control.
Notes
Acknowledgments We are grateful to the people of Mtwara and Lindi, for their participation in the study; and to Onome Akpogheneta, Eloise Thompson, and Naiela Malik, for assisting with the processing of samples for the HPLC analyses.
Financial support. This work was supported by the Bill and Melinda Gates Foundation directly and through the IPTi Consortium (http://www. ipti-malaria.org).
Potential conflicts of interest. M. T. is a member of the scientific advi-sory board of the Novartis Institute for Tropical Diseases, Singapore, and a member of the external board of UBS Optimus Foundation, Switzerland. All other authors report no potential conflicts.
All authors have submitted the ICMJE Form for Disclosure of Potential Conflicts of Interest. Conflicts that the editors consider relevant to the content of the manuscript have been disclosed
References
1. Aponte JJ, Schellenberg D, Egan A, et al. Efficacy and safety of inter-mittent preventive treatment with sulfadoxine-pyrimethamine for malaria in African infants: a pooled analysis of six randomised, placebo-controlled trials. Lancet2009; 374:1533–42.
Table 4. Linkage Disequilibrium Between CIRN and SGE Alleles Across the 3 Time Points
2004 2006 2007
Trial Arm D′ P SGE-CIRN n D′ P SGE-CIRN n D′ P SGE-CIRN n
Comparison 0.241 .001 54 269 0.138 .026 111 312 0.286 .004 52 144
Intervention 0.232 .001 69 257 0.135 .028 128 362 0.143 .159 65 139
Abbreviations: n, total number of samples genotyped; SGE-CIRN, number of samples with the SGE-CIRN genotype.
2. Cisse B, Sokhna C, Boulanger D, et al. Seasonal intermittent preven-tive treatment with artesunate and sulfadoxine-pyrimethamine for prevention of malaria in Senegalese children: a randomised, placebo-controlled, double-blind trial. Lancet2006; 367:659–67.
3. Marks F, von Kalckreuth V, Kobbe R, et al. Parasitological rebound effect and emergence of pyrimethamine resistance in Plasmodium fal-ciparum after single-dose sulfadoxine-pyrimethamine. J Infect Dis 2005; 192:1962–5.
4. Mockenhaupt FP, Reither K, Zanger P, et al. Intermittent preventive treatment in infants as a means of malaria control: a randomized, double-blind, placebo-controlled trial in northern Ghana. Antimicrob Agents Chemother2007; 51:3273–81.
5. Mayor A, Serra-Casas E, Sanz S, et al. Molecular markers of resistance to sulfadoxine-pyrimethamine during intermittent preventive treat-ment for malaria in Mozambican infants. J Infect Dis 2008; 197:1737–42.
6. Alexander N, Sutherland C, Roper C, Cisse B, Schellenberg D. Model-ling the impact of intermittent preventive treatment for malaria on selection pressure for drug resistance. Malar J2007; 6:9.
7. O’Meara WP, Smith DL, McKenzie FE. Potential impact of intermit-tent preventive treatment (IPT) on spread of drug-resistant malaria. PLoS Med2006; 3:e141.
8. Triglia T, Wang P, Sims PF, Hyde JE, Cowman AF. Allelic exchange at the endogenous genomic locus in Plasmodium falciparum proves the role of dihydropteroate synthase in sulfadoxine-resistant malaria. EMBO J1998; 17:3807–15.
9. Triglia T, Menting JG, Wilson C, Cowman AF. Mutations in dihy-dropteroate synthase are responsible for sulfone and sulfonamide re-sistance in Plasmodium falciparum. Proc Natl Acad Sci U S A 1997; 94:13944–9.
10. Wang P, Lee CS, Bayoumi R, et al. Resistance to antifolates in Plasmo-dium falciparum monitored by sequence analysis of dihydropteroate synthetase and dihydrofolate reductase alleles in a large number of field samples of diverse origins. Mol Biochem Parasitol 1997; 89:161–77.
11. Wu Y, Kirkman LA, Wellems TE. Transformation of Plasmodium fal-ciparum malaria parasites by homologous integration of plasmids that confer resistance to pyrimethamine. Proc Natl Acad Sci U S A1996; 93:1130–4.
12. Zolg JW, Plitt JR, Chen GX, Palmer S. Point mutations in the dihydro-folate reductase-thymidylate synthase gene as the molecular basis for pyrimethamine resistance in Plasmodium falciparum. Mol Biochem Parasitol1989; 36:253–62.
13. Kublin JG, Dzinjalamala FK, Kamwendo DD, et al. Molecular markers for failure of sulfadoxine-pyrimethamine and chlorproguanil-dapsone treatment of Plasmodium falciparum malaria. J Infect Dis 2002; 185:380–8.
14. Omar SA, Adagu IS, Warhurst DC. Can pretreatment screening for dhps and dhfr point mutations in Plasmodium falciparum infections be used to predict sulfadoxine-pyrimethamine treatment failure? Trans R Soc Trop Med Hyg2001; 95:315–9.
15. Staedke SG, Sendagire H, Lamola S, Kamya MR, Dorsey G, Rosenthal PJ. Relationship between age, molecular markers, and response to sul-phadoxine-pyrimethamine treatment in Kampala, Uganda. Trop Med Int Health2004; 9:624–9.
16. Basco LK, Tahar R, Keundjian A, Ringwald P. Sequence variations in the genes encoding dihydropteroate synthase and dihydrofolate reductase and clinical response to sulfadoxine-pyrimethamine in patients with acute uncomplicated falciparum malaria. J Infect Dis2000; 182:624–8. 17. Basco LK, Tahar R, Ringwald P. Molecular basis of in vivo resistance
to sulfadoxine-pyrimethamine in African adult patients infected with Plasmodium falciparum malaria parasites. Antimicrob Agents Chemo-ther1998; 42:1811–4.
18. Cortese JF, Plowe CV. Antifolate resistance due to new and known Plasmodium falciparum dihydrofolate reductase mutations expressed in yeast. Mol Biochem Parasitol1998; 94:205–14.
19. Curtis J, Duraisingh MT, Warhurst DC. In vivo selection for a specific genotype of dihydropteroate synthetase of Plasmodium falciparum by pyrimethamine-sulfadoxine but not chlorproguanil-dapsone treat-ment. J Infect Dis1998; 177:1429–33.
20. Doumbo OK, Kayentao K, Djimde A, et al. Rapid selection of Plasmo-dium falciparum dihydrofolate reductase mutants by pyrimethamine prophylaxis. J Infect Dis2000; 182:993–6.
21. Edoh D, Mshinda H, Jenkins J, Burger M. Pyrimethamine-resistant Plasmodium falciparum parasites among Tanzanian children: a facili-ty-based study using the polymerase chain reaction. Am J Trop Med Hyg1997; 57:342–7.
22. Jelinek T, Kilian AH, Curtis J, et al. Plasmodium falciparum: selection of serine 108 of dihydrofolate reductase during treatment of uncom-plicated malaria with co-trimoxazole in Ugandan children. Am J Trop Med Hyg1999; 61:125–30.
23. Jelinek T, Kilian AH, Kabagambe G, von Sonnenburg F. Plasmodium falciparum resistance to sulfadoxine/pyrimethamine in Uganda: correlation with polymorphisms in the dihydrofolate reductase and dihydropteroate synthetase genes. Am J Trop Med Hyg 1999; 61: 463–6.
24. Jelinek T, Ronn AM, Curtis J, et al. High prevalence of mutations in the dihydrofolate reductase gene of Plasmodium falciparum in isolates from Tanzania without evidence of an association to clinical sulfadox-ine/pyrimethamine resistance. Trop Med Int Health1997; 2:1075–9. 25. Khan B, Omar S, Kanyara JN, et al. Antifolate drug resistance and
point mutations in Plasmodium falciparum in Kenya. Trans R Soc Trop Med Hyg1997; 91:456–60.
26. Nzila AM, Mberu EK, Sulo J, et al. Towards an understanding of the mechanism of pyrimethamine-sulfadoxine resistance in Plasmodium falciparum: genotyping of dihydrofolate reductase and dihydropteroate synthase of Kenyan parasites. Antimicrob Agents Chemother 2000; 44:991–6.
27. Armstrong Schellenberg JR, Mrisho M, Manzi F, et al. Health and sur-vival of young children in southern Tanzania. BMC Public Health 2008; 8:194.
28. Armstrong Schellenberg JR, Shirima K, Maokola W, et al. Community effectiveness of intermittent preventive treatment for infants (IPTi) in rural southern Tanzania. Am J Trop Med Hyg2010; 82:772–81. 29. Shirima K, Mukasa O, Schellenberg JA, et al. The use of personal
digital assistants for data entry at the point of collection in a large household survey in southern Tanzania. Emerg Themes Epidemiol 2007; 4:5.
30. Kaur H, Goodman C, Thompson E, et al. A nationwide survey of the quality of antimalarials in retail outlets in Tanzania. PLoS One2008; 3:e3403.
31. Pearce RJ, Drakeley C, Chandramohan D, Mosha F, Roper C. Molecu-lar determination of point mutation haplotypes in the dihydrofolate reductase and dihydropteroate synthase of Plasmodium falciparum in three districts of northern Tanzania. Antimicrob Agents Chemother 2003; 47:1347–54.
32. Sutherland CJ, Fifer H, Pearce RJ, et al. Novel pfdhps haplotypes among imported cases of Plasmodium falciparum malaria in the UK. Antimicrob Agents Chemother2009; 8:3405–10.
33. Anderson TJ, Su XZ, Bockarie M, Lagog M, Day KP. Twelve microsat-ellite markers for characterization of Plasmodium falciparum from finger-prick blood samples. Parasitology 1999; 119 (Pt 2):113–25. 34. R Development Core Team. R: a language and environment for
statis-tical computing. Vienna, Austria: R Foundation for Statisstatis-tical Com-puting,2011.
35. Hayes RJ, Moulton LH. Cluster randomised trials. London: Chapman & Hall,2009.
36. Bland JM, Kerry SM. Statistics notes. Weighted comparison of means. BMJ1998; 316:129.
37. Excoffier L, Laval G, Schneider S. Arlequin (version 3.0): An integrat-ed software package for population genetics data analysis. Evol Bioin-form Online2005; 1:47–50.
38. Nei M, Roychoudhury AK. Sampling variances of heterozygosity and genetic distance. Genetics1974; 76:379–90.
39. Felsenstein J. PHYLIP—Phylogeny Inference Package (Version 3.2). Cladistics1989; 5:164–166.
40. Raman J, Sharp B, Kleinschmidt I, et al. Differential effect of regional drug pressure on dihydrofolate reductase and dihydropteroate synthe-tase mutations in southern Mozambique. Am J Trop Med Hyg2008; 78:256–61.
41. Moody A. Rapid diagnostic tests for malaria parasites. Clin Microbiol Rev2002; 15:66–78.
42. Pearce RJ, Pota H, Evehe MS, et al. Multiple origins and regional dis-persal of resistant dhps in African Plasmodium falciparum malaria. PLoS Med2009; 6:e1000055.
43. World Health Organization. Report of the Technical Consultation on Intermittent Preventive Treatment in Infants (IPTi), Technical Expert Group on Preventive Chemotherapy. Geneva: World Health Organiza-tion2009:1–11.
44. Naidoo I, Roper C. Drug resistance maps to guide intermittent pre-ventive treatment of malaria in African infants. Parasitology 2011; 138:1469–79.