Artificial intelligence and machine learning approaches
to energy demand-side response: A systematic review
The MIT Faculty has made this article openly available. Please share
how this access benefits you. Your story matters.
Citation
Antonopoulos, Ioannis et al. "Artificial intelligence and machine
learning approaches to energy demand-side response: A
systematic review." Renewable and Sustainable Energy Reviews 130
(September 2020): 109899 © 2020 The Authors
As Published
http://dx.doi.org/10.1016/j.rser.2020.109899
Publisher
Elsevier BV
Version
Final published version
Citable link
https://hdl.handle.net/1721.1/130282
Terms of Use
Creative Commons Attribution 4.0 International license
Renewable and Sustainable Energy Reviews 130 (2020) 109899
Available online 10 June 2020
1364-0321/© 2020 The Authors. Published by Elsevier Ltd. This is an open access article under the CC BY license (http://creativecommons.org/licenses/by/4.0/).
Artificial intelligence and machine learning approaches to energy
demand-side response: A systematic review
Ioannis Antonopoulos
a,*, Valentin Robu
a,b, Benoit Couraud
a, Desen Kirli
c, Sonam Norbu
a,
Aristides Kiprakis
c, David Flynn
a, Sergio Elizondo-Gonzalez
d, Steve Wattam
eaSmart System Research Group, Heriot-Watt University, Edinburgh, UK
bCenter for Collective Intelligence, MIT Sloan School of Management, MIT, Cambridge, USA cSchool of Engineering, University of Edinburgh, Edinburgh, UK
dOffice of Gas and Electricity Markets (Ofgem), Glasgow, UK eUpside Energy, Manchester, UK
A R T I C L E I N F O Keywords:
Artificial intelligence Machine learning Artificial neural networks Nature-inspired intelligence Multi-agent systems Demand response Power systems
A B S T R A C T
Recent years have seen an increasing interest in Demand Response (DR) as a means to provide flexibility, and hence improve the reliability of energy systems in a cost-effective way. Yet, the high complexity of the tasks associated with DR, combined with their use of large-scale data and the frequent need for near real-time de-cisions, means that Artificial Intelligence (AI) and Machine Learning (ML) — a branch of AI — have recently emerged as key technologies for enabling demand-side response. AI methods can be used to tackle various challenges, ranging from selecting the optimal set of consumers to respond, learning their attributes and pref-erences, dynamic pricing, scheduling and control of devices, learning how to incentivise participants in the DR schemes and how to reward them in a fair and economically efficient way. This work provides an overview of AI methods utilised for DR applications, based on a systematic review of over 160 papers, 40 companies and commercial initiatives, and 21 large-scale projects. The papers are classified with regards to both the AI/ML algorithm(s) used and the application area in energy DR. Next, commercial initiatives are presented (including both start-ups and established companies) and large-scale innovation projects, where AI methods have been used for energy DR. The paper concludes with a discussion of advantages and potential limitations of reviewed AI techniques for different DR tasks, and outlines directions for future research in this fast-growing area.
1. Introduction
The growing trend of Renewable Energy Resources (RES), and their rapid development in recent years, poses key challenges for power sys-tem operators. To accommodate this new energy generation mix, energy systems are forced to undergo a rapid transformation. The majority of RES are characterised by variability and intermittency, making it diffi-cult to predict their power output (i.e. they depend on solar irradiation or wind speed). These attributes make more challenging the operation and management of power systems because more flexibility is needed to safeguard their normal operation and stability [1]. The main approaches for providing flexibility are the integration of fast-acting supply, demand side management, and energy storage services [2].
In addition, power systems operation is entering the digital era. New technologies, such as Internet-of-Things (IoT), real-time monitoring and control, peer-to-peer energy and smart contracts [3], as well as cyber-security of energy assets can result in power systems which are more efficient, secure, reliable, resilient, and sustainable [4]. Moreover, several countries (both in the EU and worldwide) have set ambitious targets for mass deployment of advanced metering infrastructure (AMI) [5]; for example, in the UK, the Office for Gas and Electricity Markets (Ofgem) has stated a target of 53 million electricity and gas smart meters to be installed by 2020 [6].
The massive amount of data generated by this infrastructure (IoT, AMI) call for automated ways to analyse the resulting data. Additionally, the shift to more active, decentralised, and complex power systems [7], creates tasks which can quickly become unmanageable for human
* Corresponding author. School of Engineering and Physical Sciences, Earl Mountbatten Building, Heriot-Watt University, EH14 4AS, Edinburgh, UK.
E-mail addresses: [email protected] (I. Antonopoulos), [email protected] (V. Robu), [email protected] (B. Couraud), [email protected] (D. Kirli), sn51@hw. ac.uk (S. Norbu), [email protected] (A. Kiprakis), [email protected] (D. Flynn), [email protected] (S. Elizondo-Gonzalez), stevew@ upsideenergy.co.uk (S. Wattam).
Contents lists available at ScienceDirect
Renewable and Sustainable Energy Reviews
journal homepage: http://www.elsevier.com/locate/rser
https://doi.org/10.1016/j.rser.2020.109899
operators. AI approaches have been identified as a key tool for addressing these challenges in power systems. AI can be used to forecast power demand and generation, optimise maintenance and use of energy assets, understand better energy usage patterns, as well as provide better stability and efficiency of the power system. AI can also alleviate the load on humans by assisting and partially automating the decision-making, as well as automating the scheduling and control of the multitude of devices used.
1.1. Motivation and scope of the review
Artificial Intelligence (AI) approaches have been utilised across a range of applications in power systems, but only recently have begun attracting significant research interest in the field of demand-side response. Demand response (DR) has been identified as one of the promising approaches for providing demand flexibility to the power system; thus, increasing the scale and scope of DR programmes is of key importance to many system operators. This enhanced function of DR schemes requires a framework which is automated and able to adjust in a dynamic environment and learn (e.g. consumers’ preferences). This framework can be created with the assistance of AI techniques; in fact, it is increasingly apparent that AI can contribute greatly in the future success of DR schemes by automating the process, while learning the preferences of end-use consumers.
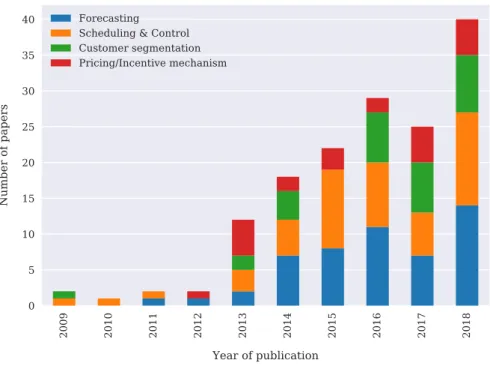
The rising interest in AI-based solutions in the DR sector is well illustrated by the sharp increase of research interest in this domain. The number of scientific publications on the subject has seen an order of magnitude increase (around 15 times), between 2012 and 2018, as shown in Fig. 1. This trend has intensified the need for a systematic review to summarise the AI algorithms used for the various DR appli-cation areas. In fact, most of these works — while providing valuable contributions — tend to focus on exploring only a specific AI/ML tech-nique and application domain. In our view, the rapid development of the field highlights the need for a comprehensive review that traces the
evolution of the field, and acts as a guide for the most promising AI techniques used in specific sub-areas of DR, based on the existing body of knowledge reported so far in existing publications.
Against this background, the aim of our paper is to provide a sys-tematic review of the various AI data-driven approaches for DR appli-cations. The goal of our review is three-fold:
� First, we aim to provide a comprehensive overview of the AI tech-niques underpinning this area, as well as the main specific applica-tions/tasks in energy DR to which these techniques have been applied. Therefore, offering a broad perspective of the field’s evo-lution and potential future research paths.
� Second, we see our review serving as a useful guide for researchers and practitioners in the field. More specifically, this means informing them, for example, which AI techniques have been found to work best for their specific DR problem or application area (or at least which techniques have been mainly used by prior research in the energy DR space). This includes a systematic discussion of the ad-vantages and drawbacks of using a specific AI technique in each application domain.
� Third, we wanted to go one step beyond looking only at scientific papers and give some insights into the start-ups and more established companies applying these techniques, as well as to some of the industrially funded research projects in this area. As this is a very active field, which has seen considerable interest and investment, our review identifies no less than 40 companies/commercial initia-tives and 21 large-scale projects.
To the best of our knowledge, this is the largest and most compre-hensive review to date of the area of AI application in energy demand- side response. More specifically, it includes 161 studies/papers (sum-marised in Table 1 of the Appendix), 40 companies and commercial ventures (summarised in Table 2) , and 21 large-scale research projects (summarised in Table 3).
Nomenclature
AIS Artificial Immune System AI Artificial Intelligence
AMI Advanced Metering Infrastructure ANN Artificial Neural Networks BRP Balance Responsible Party CNN Convolutional Neural Network DER Distributed Energy Resources DR Demand-Side Response DSO Distribution System Operator EV Electric Vehicle
FCR Frequency Containment Reserve FF-DNN Feed-Forward Deep Neural Network FQI Fitted Q-iteration
FRR Frequency Restoration Reserve GA Genetic Algorithm
GBDT Gradient Boosting Decision Tree GMM Gaussian Mixture Model GP Gaussian Process
HEMS Home Energy Management System HMM Hidden Markov Model
HVAC Heating, Ventilation and Air Conditioning IoT Internet of Things
kNN k-Nearest Neighbour LSA Latent Semantic Analysis LSTM Long Short-Term Memory MAS Multi-agent Systems MCTS Monte Carlo Tree Search MDP Markov Decision Process ML Machine Learning
NSGA Non-dominated Sorting Genetic Algorithm PCA Principal Component Analysis
PSO Particle Swarm Optimisation R-DNN Recurrent Deep Neural Network RES Renewable Energy Sources RL Reinforcement Learning RR Replacement Reserve RTP Real Time Pricing SOM Self-Organising Map STLF Short Term Load Forecasting SVM Support Vector Machine SVR Support Vector Regression TCL Thermostatically Controlled Load ToU Time of Use
TSO Transmission System Operator VPP Virtual Power Plant
1.2. Related reviews
There are numerous papers which have reviewed the energy demand response literature. In a more general setting, Siano [8] investigated the potential benefits of DR in smart grids, along with smart technologies, control, monitoring and communication systems, while Haider et al. [9] focused on the developments in DR systems, load scheduling techniques and communication technologies for DR. O’Connell et al. [10] examined the long-term and less intuitive impacts of DR, such as its effect on electricity market prices and its impact on consumers. There has also been work that has surveyed the economic impact of DR [11], whereas Dehghanpour and Afsharnia [12] examined the technical aspect of DR for frequency control. Moreover, Vardakas et al. [13] revised various optimisation models for the optimal control of DR strategies, along with DR pricing schemes.
More specifically, regarding AI approaches for DR there is the work of Shareef et al. [14] where the authors have reviewed literature that utilise AI techniques for the development of schedule controller in a home energy management system (HEMS) which incorporates a DR tool. Dusparic et al. [15] focused on the comparison and evaluation of a number of self-organising intelligent algorithms for residential demand response, Yi Wang et al. [16] on load profiling in terms of clustering techniques, and V�azquez-Canteli and Nagy [17] focused only on the application of reinforcement learning for DR. Furthermore, Raza and Khosravi [18,19] surveyed AI based load forecast modelling work, focusing mainly on artificial neural networks (ANNs), Merabet et al. [20] reviewed the application of multi-agent systems (MAS) in smart grid technologies, including DR, and there has also been work which examines smart meter data analytics in applications for DR programmes [21]. Finally, Wang et al. [22] focus on the emerging concept of inte-grated demand response, integrating various energy types and vectors (not just electricity, but also natural gas, heat), while Lu et al. [23] focus on the aggregation of thermal inertia, especially from district heating networks. In contrast, our review focuses mostly on electrical demand, discussing more in-depth the AI techniques that can enable this process. It is noted that, while these aforementioned reviews (which look at AI technologies for DR applications) have been very valuable, they tend to be smaller and narrower in scope. They often focus either on a specific AI technique such as reinforcement learning [17], or on a specific
application setting, such as home energy management systems [14]. By contrast, the purpose of this paper is to provide a more comprehensive and holistic view of the AI techniques used in DR schemes, which sup-port power system operation. We argue that a systematic review of this scale and scope is needed and useful to highlight potential research gaps and point future research paths in this rapidly growing area.
1.3. Literature search strategy
The methodology utilised to find the relevant literature for review is displayed in Fig. 2. The main tool used for identifying relevant literature has been Scopus1 search engine, which is the largest abstract and
cita-tion database of peer-reviewed literature.2 The queries used in the
search engine are the following:
� “Artificial Intelligence” AND “Demand Response" � “Machine Learning” AND “Demand Response" � “Neural Networks” AND “Demand Response"
All the results returned from the Scopus’ queries have been carefully reviewed and filtered. The work included in this review are the papers where AI approaches have explicitly been used for demand-side response applications and are not just part of the wider energy domain.
1.4. Structure of the review
The remainder of this paper is structured as follows. First, Section 2
provides the fundamental background for our review, by introducing DR and its relationship to the electricity grid and energy markets. The subsequent two sections show the classifications of the reviewed liter-ature, along with providing basic AI concepts and an initial discussion.
Fig. 1. Evolution of AI methods used for DR research.
1 https://www.scopus.com/home.uri.
2 By contrast to Scopus, other well-known scientific databases such as ISI Web
of Science cover mostly journals, and provide less coverage of conference proceedings and other dissemination venues popular in AI/ML area, while other databases such as IEEExplore and ACM Digital Library cover mostly publisher- specific sources.
In section 3 the reviewed papers are categorised based on the type of AI algorithm(s) that is utilised, while in section 4 these papers are classified based on the DR application area of the AI techniques. Next, section 5
presents an overview of some of the key commercial use cases and industrially funded research projects, where AI approaches have been employed to perform DR. section 6 outlines which groups of AI tech-niques have been applied for each DR application area and focuses on the discussion of the strengths, limitations, and the potential implica-tions of using these specific AI approaches for the respective DR appli-cation areas. Moreover, the main findings of the study are discussed, along with a presentation of potential directions for future research. Finally, section 7 concludes this review paper.
2. Demand response operation and market structure
The traditional model of the electric grid feeds electricity to the end consumers through a unidirectional power flow. This flow is supplied by high voltage generators, which are centrally controlled. With the development of markets for grid services and the growing proportion of DER in the energy mix, demand side management and especially demand
response have emerged as smart solutions to reliably and efficiently
manage the electric grid. However, in contrast to traditional power grids, a DR model requires a bidirectional communication mechanism and smart algorithms to process the generated data. Consequently, smart metering devices are really important for DR models, and they are one of the key components in a smart grid [24]. Additionally, the data pro-duced can be utilised by AI-based solutions to further facilitate DR programmes.
The focus of this section is to introduce and present DR services, as well as describe how they fit in the current electricity market structure.
2.1. Demand response
Energy demand response in broad terms can be considered as one of the mechanisms within demand side management [25] and possible with ongoing smart grid activities. In this paper, with the term Demand
Response we are specifically referring to the changes in electricity usage
by the end-use customers (industrial, commercial, or domestic). The customers commit to change their normal consumption patterns by temporarily using on-site standby generated energy, or
reducing/shifting their electricity consumption away from periods with low generation capacity in response to a signal from a system operator, or a service provider (i.e. aggregator) [25]. We acknowledge that DR is a broader term (i.e. including thermal energy, gas, etc.), but the focus in this paper is on electrical power systems. There are numerous types of DR programmes, and their most frequently used classification is based on which party initiates the demand reduction [8]. As displayed in
Fig. 3, DR schemes can be partitioned into two classes [9,26,27].
Fig. 2. Search methodology for finding relevant literature.
�Price-based DR programmes. In this setting the price of electricity changes over different time periods, with the purpose of motivating end-use consumers to vary their energy consumption patterns. Schemes that fall under this category are time of use (ToU), critical- peak price (CPP), and real-time price (RTP) [10].
�Incentive-based (or Contract-based) DR schemes. This type of schemes incentivises end-use consumers to reduce their electricity consumption upon request offers or according to a contractual agreement. Examples of this kind of programmes are direct-load controls (DLCs), interruptible tariffs, and demand-bidding pro-grammes [28].
Each of these control strategies require to design the incentives or contracts that are proposed to the consumers, while taking into account the consumers’ behaviours and preferences. To achieve this goal, DR solutions extensively use AI-based solutions, as is shown in Section 3.
In the next subsection, the main principles of electricity markets are described, and we explain how DR is used as a key tool to maintain the integrity of electricity grids.
2.2. Electricity markets and their relationship with demand response
Electricity markets are split between retail markets, in which elec-tricity retailers contract the supply of elecelec-tricity with the end-users, and
wholesale markets, in which retailers, suppliers, producers, grid
opera-tors and third parties as aggregaopera-tors interact to allow retailers to supply their customers while maintaining the integrity of the grid. The wholesale electricity market is split into the energy market, the capacity
market, and the ancillary services market, all of which are designed to
provide economic incentives to different stakeholders to contribute to the energy supply and to the grid operation and integrity. Demand-side response is associated with the energy and ancillary services markets. Depending on the country, contracts between the market stakeholders can be done through bilateral trades (over the counter (OTC)) or through an organized market (exchanges, pool auction with price clearing). In both cases, the products can be traded in the spot market (day ahead and/or intra-day), or in the TSO’s managed spot market for ancillary services markets.
Once a resource supplier commits to provide a certain amount of energy into the grid, compliance is expected; otherwise there is a penalty incurred. Thus, it is of great importance for DR aggregators to make sure that end-users commit and provide the power flexibility. Below, we briefly describe the different stakeholders that interact through elec-tricity markets and are related to DR mechanisms.
2.2.1. Electricity markets stakeholders
The main stakeholders in an electricity market are the following: �Grid operators: the Transmission System Operator (TSO) is a
facili-tator of the markets who ensures that every trade meets the grid constraints. Also, TSOs are usually operating ancillary services markets. TSOs and Distribution System Operators (DSOs) can buy or sell products in all markets.
�Retailers and suppliers: they participate both in the retail and wholesale market, and they make sure the quantity of energy pur-chased on the wholesale market will balance the consumption of their end-users in their portfolio. To achieve this balance, they can either have a sub-contract with balance responsible parties (BRPs) or manage their portfolio themselves. They can propose particular contracts to the end-customers as flat tariffs or DR programmes. When proposing DR programmes, the challenge for suppliers is to assess how these programmes will affect their portfolio’s consump-tion. Therefore, AI based tools reviewed in this paper are important for suppliers to provide solutions to reduce their losses due to port-folio imbalance.
� End-customers, who buy electricity from a supplier. When they sub-scribe to a DR program, they can either respond manually to a request or a price, or automatically through a home energy man-agement system. AI methods reviewed in this paper also address the challenges faced by end-customers’ HEMS.
� Balance Responsible Parties: they are responsible for balancing the portfolio of their customers (retailers/suppliers). They purchase electricity production or consumption in the wholesale market. � Producers: they produce electricity and propose their production at a
particular price on the wholesale markets. Their products can either be only energy and/or grid services as frequency response. � Aggregators and service providers: they aggregate end-customers or
small producers in order to reach the minimum capacity allowed to provide flexibility products in the energy and ancillary services market. Hence, they have direct contracts with end-customers, and offer their aggregated flexibility to suppliers or BRPs in the wholesale market. As for the retailers/suppliers, they must ensure that end- customers will commit to the flexibility that was traded in the wholesale market. Hence AI tools reviewed in this paper apply particularly to aggregators in order to minimise the difference be-tween the traded and actual flexibility.
The end of this subsection describes the different markets listed previously and specify how DR products can participate to these markets.
2.2.2. Capacity markets
In these long-term markets, the regulators ensure that the production capacity for the following years will meet the evolution of the demand. DR products are rarely exchanged within these markets.
2.2.3. Energy markets
These are the main markets that allow retailers to buy electricity from electricity producers. In these markets, retailers or suppliers are usually required to maintain a balanced portfolio at every market time interval, with as much electricity consumption as electricity production, in order to maintain the frequency of the grid at its nominal level. DR is a particular product exchanged in this market in order to allow suppliers to adjust their demand and maintain balance at every time interval.
2.2.4. Ancillary services markets
Electricity can be considered as a product carried by the electric grid that must satisfy contractual characteristics and requirements. The electric grid operator is responsible to make sure these requirements are met, in exchange for remuneration. Electric grid regulation can be summarised as the control of the grid frequency, of the voltage at each node of the grid, of the power quality (harmonics, flickers, etc.), and also the control of downtime minutes per customer per year. To ensure that these controls are well provided, the System Operator makes sure that a portion of producers and consumers contribute to these services, either by providing market-based incentives, or by setting up mandatory requirements.
These services are called ancillary services. Specific ancillary services markets can be distinguished depending on the type of product that is required. For example, the Australian Energy Market Operator currently facilitates eight separate markets that can be classified into frequency control ancillary services markets, network control ancillary services markets or into the system restart ancillary services markets category [29]. In most countries, to contribute to the ancillary market managed by the TSO, it is first necessary that the resource (a generator, a battery or load) is certified by the system operator [30]. Demand response can mainly contribute to two of these services, which are frequency control, at a nation scale, and voltage control, at a local level. Indeed, although DR is mostly associated with the frequency control in current practice, it could also provide local voltage support as it involves assets that are potentially available at every node of the grid.
1. Frequency Control. For the effective operation of the power grid, system operators (SOs) are required to control the power system frequency between a range of specific acceptable values. In the majority of the cases, this range has a central value of either 50Hz or 60Hz, depending on the national power system. In order to maintain the system frequency between the acceptable boundaries, the active power generated and/or consumed needs to be controlled to keep demand and supply balanced at all times. When demand is higher than generation, the system frequency decreases, and vice versa. This type of control is achieved by keeping a particular volume of active power as reserve, usually called frequency control reserve [31].
In general, based on the Continental European synchronous area3
framework [32] (former UCTE), as can be seen in Fig. 4, there are three levels of control used to balance the demand and supply [31]: (a) Frequency Containment Reserve (FCR), also called primary
fre-quency control is a local automatic control that changes the active power production and the consumption of controllable loads to restore the balance between power supply and demand [33], with a maximum activation time of 30 s. This level was introduced to control the frequency in the event of large gener-ation or load outages. Both the supply and demand side partici-pate in this control with the use of self-regulating equipment. For comparison purposes, in the US market this frequency response corresponds to the Regulation response provided by the automatic governor of the turbines and the automatic generation control [34,35]. Most of the FCR is currently provided by gas turbines, hydro power plants, and storage as batteries or flywheels. How-ever, these technologies also have a negative impact on the environment [36]. In many cases, DR solutions are both the most cost-effective and environmentally friendly technology to pro-vide this service, if well-coordinated.
(b) Automatic Frequency Restoration Reserve (aFRR), also called sec-ondary frequency control is a centralised automatic control that fine-tunes the active power production of the generating assets to reinstate the frequency and the interchanges with other systems to their target range after an imbalance event. Secondary fre-quency control is used in all large interconnected systems and the activation time generally ranges between 30 s and 15 min (depending on the specific requirements of the interconnected system). This regulation is provided in the US by the Spinning
Reserve and Regulation response.
(c) Manual Frequency Restoration Reserve (mFRR) and Replacement
Reserve (RR), also called tertiary reserve involves the manual
changes in the dispatching and commitment of generating units. This reserve can be used to replace secondary reserve when the secondary reserve is not enough to regulate the frequency back to its nominal value. mFRR response can be below 15 min, whereas RR activation time varies from 15 min up to hours. The purpose of this type of control includes the recovery of the primary and secondary frequency control reserves, the management of con-gestions in the transmission network, and the restoration of fre-quency to its intended value when secondary control has not been successful. In the US market, the tertiary response corresponds to
Non-Spinning Reserve and Replacement Reserve.
Different countries have different power systems, resulting to different implementations, and also diverse descriptions for the reserves related with each type of frequency control [31]. For example, in the UK the SO (National Grid) has an obligation to control the system frequency at 50 Hz �0:4%(49.8 Hz – 50.2 Hz) for operational limits [37]. More-over, in the UK and Sweden there is no reserve defined for secondary frequency control, and there is a division of the primary frequency
control reserves in various categories.
Providing frequency control becomes more challenging due to the higher penetration of intermittent renewable energy sources in the power generation mix, resulting in lower inertia in the system [38,39], and the introduction of new types of loads with higher variability (e.g. EVs) [40]. This fact calls for research and use of novel techniques and flexibility, including DR at the end-user level, which requires AI-based solutions to increase this flexibility provision.
2. Voltage Control. Along with frequency, voltage is a contractual characteristic which the system operators must ensure to confine within certain bounds set by the regulator. However, unlike fre-quency, which is mainly addressed at the transmission grid level, voltage is a challenge faced by TSOs and DSOs. The voltage drop across a line of an impedance z ¼ r þ jx is due to the consumption or production of an apparent power S ¼ P þ jQ, and is given in Equation
(1) below: ΔV
V � rP þ xQ
V2 (1)
where V is the average between the voltage at both ends of the line. Hence, a bus’s voltage fluctuates continuously depending on the power that flows through the lines that are connected to this bus. Voltage control consists in the action of different mechanisms that ensure that the voltage stays within contractual boundaries at every bus of the grid. According to (1), the transmission grid and the dis-tribution grid must be differentiated. Indeed, for the transmission grid, the resistance of the lines is small compared to their reactance. Thus, the voltage drop is mainly due to the transit of reactive power. Hence, voltage control at the TSOs level is mainly realised by in-jection or consumption of reactive power. This control can be done by generators, synchronous condensers, capacitors or flexible AC Transmission Systems [41]. On the distribution grid side on the other hand, active power and reactive power are both responsible for voltage drops. Hence, the growing proportion of DERs creates chal-lenges in voltage profile management. While previously voltage was decreasing closer to the loads, the high penetration of DERs, such as rooftop solar panels, can increase the voltage locally by producing variable active power. To control the voltage at the distribution level, DSOs currently use tap changer mechanisms in transformers. However, although primary substations, which connect distribution grids to transmission grids, are often equipped with online tap changer mechanisms, secondary substations are usually only equip-ped with de-energized tap changers, which require the disconnection of the feeding line before adjusting the voltage. Given the volatility of distributed generation and EVs charging power at the low voltage level, new services are needed at the distribution grid side to main-tain the voltage, within acceptable limits, while minimising load and generation curtailment. This is where smart solutions for residential demand-side response could prove to be very useful in practice and would make it possible for the DSO to integrate more DER and EVs in the system, without costly grid reinforcements [42].
To our knowledge, no spot market has yet been implemented for voltage control at the transmission grid level, because of the need for very local solutions (mostly reactive power injection) [43]. In some countries (including most of the countries in the European Union), the MVAR service (Voltage and Reactive power control) is a mandatory service that can be contracted through bilateral or tendering trades and settled at regulated prices. At the distribution grid level, many local markets are currently under test to provide local support to the grid, including voltage support [44]. Even though open markets for contracting voltage support are not as well-structured and adopted as those for frequency response, con-tracting such services will likely still be needed in the next decades.
The evolution of power systems, driven by an increasing penetration of DER, calls for new solutions to address the technical challenges of a smart grid (mainly frequency and local voltage regulation). DR is one of these solutions. The installation of smart meters and the increasing adoption of IoT devices at home lay the foundations for smart DR stra-tegies. On top of that, these strategies will rely on the implementation of smart algorithms based on AI solutions to achieve an efficient regulation of the demand without severally affecting the end-users comfort.
In the subsequent section (Section 3) we provide a comprehensive review and discussion of the AI solutions that have been proposed and investigated so far by the research community for automating DR. Next, Section 4 reviews and provides a discussion of specific DR services and areas where AI/ML techniques have been applied.
3. AI approaches/techniques in demand response
AI is a multidisciplinary domain employing techniques and insights from various fields, such as computer science, neuroscience, economics, information theory, statistics, psychology, control theory and optimi-sation. The term artificial intelligence is referring to the study and design of intelligent entities (agents) [45]. These intelligent agents are systems that observe their environments and act towards achieving goals. In this work, the adopted definition of an agent is the one pre-sented in the seminal AI work of Russell and Norvig [45].
“An agent is anything that can be viewed as perceiving its environment
through sensors and acting upon that environment through actuators”
Hence AI-enabled agents can range from machines truly capable of reasoning to search algorithms used to play board games. Since the birth of AI in the 1950s various approaches have been applied to create
thinking machines. These approaches include symbolic reasoning [46], logic-based [47], knowledge-based systems [48], soft computing [49], and statistical learning [50,51]. The focus of this paper is on the
non-symbolic, soft computing, data-driven paradigm of AI. Furthermore, to
present a more holistic view in this review the AI approaches are studied both in the single-agent and the multi-agent setting. The various AI techniques used for DR and their classification can be seen in Fig. 5, whereas Fig. 6 displays the proportion of the reviewed literature that has utilised a particular category of AI techniques.
3.1. Machine learning and statistical methods
As we enter the big data and the IoT era, there is a great need for automated analysis of the “data tsunami” that is being continuously created. Machine learning includes a set of methods that try to learn from data, and it is a core subset of AI. This group of AI techniques envelopes methods that can identify patterns in the data in an automatic way, and then use these patterns to predict, and techniques to perform other ways of decision making in an uncertain environment [52]. Ma-chine learning is a multi-disciplinary domain that draws concepts from various domains, primarily computer science, statistics, mathematics, and engineering. The main types of machine learning, as stated in Murphy [52], are supervised learning, unsupervised learning, and
reinforcement learning. 3.1.1. Supervised learning
In the supervised learning setting, the goal is to learn a mapping be-tween the input vector x and the outputs y, provided that there is an existing labelled set of input-output pairs D ¼ fðxi;yiÞgKi¼1. This set of data is called training set, and the inputs xi can be something as simple
as a real number to a complex structured object (e.g. an image, a time- series, a graph, etc.). The outputs yi in general can be of any type; the
two most common cases are when yi is a categorical variable in which
case we have a classification problem, and when it is a real-valued scalar variable where we have a regression problem.
Supervised learning tries to tackle an inductive problem, as from a finite set D we need to find a function f which will give an output for the whole spectrum of possible inputs. In simpler terms, the end goal is to
Fig. 4. Schematic approach of frequency control mechanisms based on the Continental European synchronous area framework. The main terminology refers to the
find a mapping that will generalise well in data that the algorithm has not encountered before. The set of unseen data which is used to calculate how well the algorithm generalises is called test set and should not include datapoints which are part of the training set. In cases where a more/less flexible approach than the optimal is used, resulting in a learning algorithm that does not generalise well in unseen data, we say that the algorithm overfits/underfits the data.
In DR, supervised learning techniques have been primarily applied to forecast the demand and electricity prices, by employing kernel-based, tree-based methods, and linear regression models. ANNs – trained in a supervised fashion – are also extensively used for forecasting but will be discussed in their respective section because they are heavily utilised in research. Kernel-based methods create representations of the input data to a new feature space, and subsequently find an appropriate hy-pothesis in this feature space [53]; popular kernel-based techniques include support vector machines (SVM) and Gaussian processes (GPs). Support Vector Regression (SVR) has been used in Giovanelli et al. [54], Pal and kumar [55] for price forecasting, whereas Yang et al. [56] Zhou et al. [57,58] employ SVR for STLF, even for non-aggregated loads. The regression is obtained by solving the dual form of an optimisation problem as defined in Durcker et al. [59], and using Equation (2) to determine the regression function pðxÞ, with β and β* the Lagrange
multipliers, x the inputs for the forecast, b a primal variable and Kðxi;xjÞ a Kernel function, often chosen as the Gaussian Radial Basis Kernel function (Kðxi;xjÞ ¼e ðxi xjÞ2 σ2 ). pðxÞ ¼X N i¼1 βi β*i � Kðx; xiÞ þb (2)
Gaussian process regression models have been used to determine a
probabilistic baseline estimation in Rajgopal [60] and Weng et al. [61], as well as for forecasting the consumption of controllable appliances in Tang et al. [62]. GPs have the advantage of being probabilistic models. Probabilistic approaches can potentially lead to better informed fore-casts for DR; they output an estimate of the uncertainty in the pre-dictions of the model – not just point estimates. Thus, prior knowledge can be included in the learning algorithm and subsequently domain knowledge can be incorporated in the model [52].
Unlike kernel-based methods, linear regression is a simple tool, easily implementable, which offers a good interpretability of how the inputs affect the output [52]. These attributes explain why it has been used across various domains. Even though linear regressions are often employed as a baseline algorithm by researchers to compare their pro-posed algorithms [54,56,58,63,64], they have also been used as the main modelling technique in MacDougall et al. [65] to forecast the flexibility of Virtual Power Plants (VPP), in Dehghanpour et al. [66] to determine the aggregated power of price-sensitive loads at each hour of the day, in Klaassen et al. [67] to forecast the aggregated power for heating, as a function of the temperature, the time of the day, the type of day and the price, and in Grabner et al. [68] where multivariate linear regression is used for daily peak loads estimation. In the DR space, for STLF, the output of the regression is the power of the considered load
(thermal load or building) at time t (Pt 2 ½0;24�), while the inputs or
fea-tures can be time-related (hour, day, type of day), the temperature (T), the electricity price p, and/or a product of these inputs (e.g. hour � T,
hour � p) to reflect the interactions between the inputs. A generic
formulation can be found in Equation (3) below: 2 4P⋮1 P24 3 5 ¼ X i2inputs 2 4 ai1;1 ⋯ ai1;24 ⋮ ⋮ ai24;1 ⋯ ai24;24 3 5 2 4I⋮i1 Ii24 3 5 þ 2 4P⋮01 P024 3 5 (3)
where Pj is the power consumption forecast for time t ¼ j. The vectors
½Iij�represent the inputs or features, where i corresponds to one type of feature (temperature, type of day, …). For example, if there are three features considered, the temperature (i ¼ T), the type of day (i ¼ d) and the product of the price and the hour (i ¼ p⋅h), IT11 is the temperature at
time t ¼ 11, Id11 is the type of day, and Ip⋅h11 is the product of the price at
t ¼ 11. The terms P0j correspond to baseline consumption or offsets, and
the aik;l coefficients are the linear coefficients for each of the features,
that are computed and updated to minimise an error function (residual sum of squares for example).
Moreover, there are also a few papers that have utilised Gaussian Copulas, primarily for load forecasting, in DR. Tavakoli Bina and Ahmadi [69] applied this technique for the prediction of EVs’ charging demand for day-ahead DR strategies, Bina and Ahmadi [70] for the day-ahead estimation of the aggregate power demand of particular household appliances, and Bina and Ahmadi [71] for non-controllable load forecasting in day-ahead DR. Besides DR, there is also work applying Gaussian copulas in the, more general, power system setting. E. g. in PV power forecasting [72,73], in short-term wind power fore-casting [74], and in the forecasting of inflexible loads [73].
Tree-based methods have also been used extensively in DR for load
forecasting [56–58,75,76] and price forecasting [54], where Giovanelli et al. [54] include a comparison with other methods (Linear regression, SVR, Gradient boosting decision tree). Yeng et al. [56] use regression trees to model the energy consumption of cooling systems and compares the outputs with SVR methods. Behl et al. [76] use multiple regression trees to predict the power consumption of a building as a function of the temperature, humidity, wind, time of day, type of day, schedule, lighting level, water temperature and historic power consumption. Zhou et al. [57,58] use classification and regression tree (CART) algorithms for short term load forecasting. Regression trees are hierarchical, non-parametric methods that segment the feature space (e.g. time of day, type of day, temperature) into a number of simple regions and subsequently fit a simple model in each one [77]. Regression trees are interpretable, scalable, handle missing data well, but on the other hand they can be prone to overfitting, and are generally unstable [52,54]. However, regression trees have been reported to provide accurate re-sults even for complex prediction tasks, such as 48 h ahead predictions of aggregated demand with time step of 15 min [75].
Another commonly used approach, found in the review, for load forecasting in DR is ensemble learning. Ensemble learning is based on the idea of constructing a prediction model through a combination of multiple simpler base models (weak learners). Cheung et al. [78] pro-pose a variation of ensemble learning called Temporal Ensemble Learning
(TEL) that partitions the dataset by temporal features and forecasts
demand in specific time ranges per day. The ensemble of these generated forecasts, with kernel regression as the base model, is the model that yielded the best results in this paper. Yang et al. [56] apply methods based on voting or stacking strategy to combine weak learners based on regression trees and SVM, to estimate the energy consumption of buildings that have an energy management system (EMS) which re-sponds to DR signals, and Giovanelli et al. [54] use Gradient boosting decision tree (GBDT) to build an additive regression model, with the use of regression trees as the weak learner. This model is used to predict the prices in the FCR market. Ensemble learning approaches can potentially improve the forecasting accuracy (compared to the base models); such
as in work of Cheung et al. [78], where ensemble learning techniques achieved higher accuracy for short term (1-h) load forecasts compared to the linear regression and SVR approaches.
Besides forecasting, supervised learning models have been utilised for other tasks in DR as well. Goubko et al. [79] apply a Bayesian learning framework to estimate the consumer’s comfort level function, Liyan Jia et al. [80] an online learning algorithm (called piecewise linear
stochastic approximation) to solve the task of day-ahead dynamic pricing
for an electricity retailer, and Shoji et al. [81] adapt a Bayesian network to an EMS, with the purpose of learning the residents’ behaviour and controlling the appliances – under varying electricity prices. Moreover, Albert and Rajagopal [82] employ AdaBoost [83] to ensemble learn (binary) classifiers using features generated using spectral clustering. These classifiers are used to predict certain DR user characteristics.
3.1.2. Unsupervised learning
In this case of unsupervised learning methods only the inputs are given D ¼ fxigKi¼1, where K is the number of datapoints, and the system attempts to detect patterns in the data that could be of interest. Compared to supervised learning, this is not such a well-defined problem due to the fact that the patterns needed to be detected are not known beforehand, and because there is a lack of obvious error metrics to be used. On the other hand, it can be applied to a wider spectrum of cases as it does not require labelled data, which can be difficult or expensive to acquire. In DR this is advantageous due to the lack of labelled data. The usual examples of unsupervised learning are clustering the data into groups, dimensionality reduction by discovering latent factors, learning graph structure, and matrix completion.
In DR the dominant use of unsupervised algorithms has been for clustering purposes; where you create groups of objects (e.g. load pro-files) in a way that objects within the same cluster are similar to one another, and dissimilar to the objects in other clusters. The various clustering algorithms have been applied to segment the consumers and find typical shapes of load profiles. In turn, this grouping can be used (among others) to identify potential households for DR schemes, select consumers for DR events, and compensate consumers for participation in DR programmes.
Clustering algorithms can be classified in hard and soft; in hard clustering each item can belong only in one cluster, whereas in soft clustering each item can belong to multiple clusters. The K-means al-gorithm has been employed in the majority of cases and with various distance metrics [57,68,84–89]. K-means clustering is a distance-based method with the purpose of predicting K centroids (points which are the centre of a cluster) and a label cðiÞfor each data point in the dataset. A
data point is considered to belong in the kth cluster if the distance
be-tween the vector and the kth centroid is the smallest among all centroids.
K-means finds the best centroids by iteratively alternating between (1) assigning data points to clusters based on the current estimate of cen-troids, and (2) choosing centroids based on the current assignment of data points to clusters, until the assignments do not change [52]. In DR, K-means is mainly used to group individual households based on monitored load data, which are usually grouped by weekdays and averaged over a period of several weeks. The features used for clustering can include the important components from a Principal Component Analysis (PCA) [84,87,90] (or Self-Organising Maps (SOM) [89]), the daily load shapes directly – in which case the dimension of the consid-ered space will be the size of the load profiles (e.g. 24 for hourly in-tervals monitoring) – [57,91], and/or particular characteristics from the households, such as the average and peak daily consumption [85], and pricing information [86,88]. Cao et al. [84] compares the clustering of 4000 households over 18 months from the Irish CER dataset, using K-means, SOM, and hierarchical clustering methods with different dis-tance computations based on the 17 most significant PCA components. Koolen et al. [87] aim to cluster households into two groups (k ¼ 2), one more suited for Time of Use tariffs, and one more suited for Real Time
Pricing. They use spectral relaxation clustering with PCA to find 9 ei-genvectors that define the space for the k-mean clustering. Finally, Grabner et al. [68] use k-means for substations’ load profile clustering, with dynamic time warping algorithm to measure the distance between time series (instead of Euclidean distance).
Further clustering algorithms used for grouping households’ load profiles include soft clustering algorithms based on fuzzy clustering techniques [92,93], a density based spatial clustering algorithm [94], GMM [85,95], hierarchical clustering [84,91,96], sparse coding [96], and spectral clustering with a multi-scale similarity metric [97].
Two major challenges in unsupervised clustering cluster analysis are the estimation of the optimal number of clusters [98], and the validation of clustering structures [52]. In the DR literature the selected number of clusters is between 2 and 16, and the selection approaches include indices (e.g. Bayesian information criterion (BIC) [85], Dunn index (DI) [89], Davies-Bouldin index (DBI) [89,97], mean silhouette index (MSI) [89]), exploratory techniques [87,92,94], methods based on matrix perturbation theory [97], and iterative methods which increase the number of clusters K and perform a criteria-based comparison (depending on the application) for each K, while making sure to avoid over-fitting [62,84,86,87,91]. Indeed Tang et al. [62,91], Kwac et al. [91] use an adaptive k-means approach to find the best number of clusters of households, and Cao et al. [84] limits the number of clusters to 14 in order to avoid over-fitting. Moreover, bootstrapping techniques have been used to check the reliability of the clusters and test the results’ robustness [95]. Waczowicz et al. [99] propose an automatic frame-work, based on a ranking method, to compare and select the hyper-parameter values for DR clustering purposes.
Besides consumers’ segmentation, unsupervised techniques have also been utilised to detect the presence of heating appliances in a household [100], infer the dynamic elasticities curves [92], and detect the occupancy of a household [58,82] – where Albert and Rajagopal [82] use spectral clustering to cluster a collection of HMMs into classes of similar statistical properties. This information can be very valuable to aggregators, so that they can assess the flexibility of their assets.
3.1.3. Reinforcement learning
Learning from interaction is a fundamental idea in almost every learning paradigm. One of the most interesting computational ap-proaches to learning from interaction is Reinforcement Learning (RL). RL is an approach which explicitly considers the whole problem of an agent focused on goal-oriented learning while interacting with an uncertain environment [101]. It is a distinct paradigm from supervised and un-supervised learning which considers the trade-off between exploration and exploitation. Trial-and-error type of search as well as delayed reward are the two most characteristic aspects of RL. The problem of RL is formalised using the concept of Markov Decision Processes (MDPs). In MDPs at each sequential, discrete time step t the agent receives a rep-resentation of the environment’s state (St2 S), selects an action (At2
A ðsÞ) based on the state, and finds itself in the state of the subsequent
time step Stþ1 where it receives a numerical reward (Rt2 R ⊂ R) –
because of its action At [101].
The RL framework has been applied to a number of domains with the most important being robotics [102,103], resource management in computer clusters [104], playing video games from pixel input [105], automated ML frameworks [106]. In the DR field, RL has been widely applied to the tasks of scheduling and control of the various units (e.g. domestic appliances, EVs), while taking into account consumers’ pref-erences (via interaction with them). RL has been presented as a data-driven alternative to model-based controllers for DR, both at the consumer level (as part of an EMS), and at the service provider level. There is also research where RL framework has been used to learn the
DR pricing mechanism for service providers [107–109] and develop a demand elasticity model for an aggregation of consumers [110].
The online nature4 of various RL methods makes it appealing for DR
due to the low volume of many existing DR-related data sets. Accord-ingly, it has been heavily applied and various solution methods of the RL framework have been used. The solution methods to RL can be arranged in two different classes; tabular methods where the spaces of possible states and actions are limited enough to allow value functions to be represented as tables, and approximate methods which can be applied to problems with arbitrarily large state spaces [101].
In DR, the most common tabular method applied is Q-learning [66,
107–112]. Q-learning [113] is a temporal-difference, model-free5 RL
technique which directly approximates the optimal action-value func-tion, independently of the policy6 being followed [101]. In this case the learned expected discounted reward QðSt;AtÞthat the agent receives for executing action At at state St and following policy π thereafter
(action-value function) is defined as follows:
QðSt;AtÞ← QðSt;AtÞ þα½Rtþ1þγ max
a QðStþ1;aÞ QðSt;AtÞ� (4)
where α2 ½0; 1� is the learning rate, γ is the discount factor, a 2 A , Rt the actual reward obtained for getting from state St to Stþ1, and
maxaQðstþ1;aÞ is the maximum reward the agent can expect from being
in state Stþ1.
Using Equation (4), the agent updates his table of expected rewards (for state-action pairs), which will then allow him to find the optimal action at future times. In DR applications, Q-learning has been used to help the service provider company (aggregator) provide the optimal sequence of retail electricity prices to consumers [107–109]. In this case, the agent is the aggregator, the action is the price incentives sequence that is proposed to the customers, while the state corresponds to the energy demand from the customers, and the reward is a function of the aggregator’s profit and the cost incurred to the customers. Q-learning is also frequently used at the HEMS level to optimise the scheduling of appliances by considering the cost and comfort for the users as a reward function [111,112]. In O’Neill et al. [112], the authors consider pre-specified disutility functions for the customers’ dissatisfaction on job scheduling, but Wen et al. [111] address this limitation. Under this context, a state is composed of a price sequence from the retailer or aggregator, a vector that reflects the user’s consumption of specific appliances over time, and sometimes the priority of the considered de-vice. The action from the HEMS is to switch on or turn off the considered devices at time t, and the reward is computed based on the satisfaction (or dissatisfaction) of the customers — quantified usually by the time delay in the actual switching of an appliance, or by directly modelling the end-user’s discomfort function [66,114]. Further, tabular methods are employed in Jain et al. [115] as a multi-armed bandit mechanism which involves learning to act in only one situation (single state), as well as in Ahmed and Bouffard [116] where the problem is formulated as a bandit problem and they apply Monte Carlo methods to learn the value of actions for a given policy.
In contrast to tabular methods, the approximate RL methods used for DR are not online algorithms, but batch or mini-batch methods. In online algorithms the input data are obtained sequentially while the learning algorithm executes, whereas in batch algorithms the entire dataset used for learning is readily available [101]. Ruelens et al. [117,118] Claes-sens et al. [119], Patyn et al. [120] use Fitted Q-iteration (FQI) at the end-user level (HEMS) to allow the HEMS to determine an optimal control sequence (policy) of thermal appliances for each time step of the
4 Learning happens at each time step, as data becomes available in a
sequential order.
5 There is no need for a model of the environment.
6 It is defined as the mapping from states to probabilities of selecting each
day based on day-ahead pricing signals. The aim for the HEMS is to minimise the daily cost of electricity demand. FQI algorithm estimates the state-action value function (expected reward QðSt;AtÞ) offline, using a batch of historical data, and approximates it using either linear regression or ANNs. A further use case of FQI at the HEMS level is the construction of an optimal day-ahead load profile, which is subsequently sold in the market. The objective in this use case is to increase con-sumers’ profit and minimise the deviation between the day-ahead load profile proposed in the market and the actual load profile. Medved et al. [121] propose another variant of the Q-learning algorithm, where action-value functions are parametrised using an ANN, called deep Q-learning [122], whereas Bahrami et al. [123] use an actor-critic online learning method [101].
In addition to the aforementioned centralised, single-agent methods, other multi-agent extensions of these have been reported in the litera-ture. These alternative learning methods are mainly employed to address the limitations of centralised approaches in terms of computa-tional power needed — by distributing the workload among the participating agents —, scalability, reliability of the system, as well as the data privacy of consumers. Hurtado et al. [114] propose a decen-tralised and cooperative RL method which extends the Q-learning al-gorithm to the multi-agent setting by incorporating the optimal policies and the actions of the other agents. Cooperation between agents has been considered in Golpayegani et al. [124] too, through the use of a collaborative and parallel MCTS, where it is used to enable EVs to actively influence the planning process and resolve their conflicts via negotiation in a DR scenario; MCTS can be considered as a form of RL algorithm [125]. On the other hand, there are papers that address the problem without collaboration among the agents, and a decentralised Q-learning is used [126], as well as W-learning [127]. Multi-agent ap-proaches diminish the need for complex, computationally intensive al-gorithms compared to centralised methods, in exchange for increased collaboration and communication overhead among the agents. For a more detailed search of RL methods in DR the reader can refer to the work of V�azquez-Canteli and Nagy [17].
3.2. Nature-inspired algorithmics
Natural and biological systems have always been a key source where scientists draw inspiration from, to design novel computational ap-proaches. In the context of AI, nature-inspired algorithms have been utilised for searching and planning purposes, i.e. to find the sequences of actions needed to reach an agent’s goals [45]. The nature-inspired al-gorithms found in the DR literature are often meta-heuristics motivated from evolution, biological swarms, or physical processes. The term
meta-heuristics refers to the class of stochastic algorithms with
random-ization and local search, and is used to denote the set of iterative pro-cesses which augment heuristic procedures, via intelligent learning strategies for the exploration and exploitation of the search space, with the goal to efficiently discover near-optimal solutions [128].
In DR, nature-inspired algorithms have been primarily used to schedule loads or appliances at the consumer level (algorithm embedded in HEMS) or help aggregators and retailers to optimise the pricing of their customers who offer DR services. Since meta-heuristics are able to find solutions in a reasonable timeframe, they have been heavily utilised under the DR context, where the scheduling task can be computationally expensive.
3.2.1. Evolutionary algorithms
Evolutionary algorithms, or Evolutionary Computation (EC), is a heuristic-based approach which uses methods inspired by biological evolution, by mirroring computationally some of its core principles, such as reproduction, mutation, recombination, and selection. The ar-chitecture of an EC algorithm includes three main steps. The first step is the initialisation step, where a set of possible solutions is chosen — most of the time randomly. The second step is the evolutionary iterations with
two operational steps, namely, fitness evaluation and selection and
popu-lation reproduction and variation. The fitness evaluation consists in
evaluating the objective functions obtained for all the individuals of the initialisation population, while the selection criteria allow to select the individuals that performed best in order to determine a new population using reproduction (crossover, replacement) and variation (mutation) methods. Then, this new population is re-evaluated, and a new iteration is realised until the evaluation of the optimisation function on an indi-vidual meets a termination criteria. Evolutionary learning algorithms are a family of algorithms which include genetic algorithms (GA), evolutionary programming (EP), evolutionary strategies (ES), genetic programming (GP), learning classifier systems (LCS), differential evo-lution (DE), and estimation of distribution algorithm (EDA) [129]. Strengths of evolutionary algorithms are the fact that no gradient in-formation is needed, they can be implemented in a parallel manner, and are highly exploratory. Compared to traditional optimisation/search approaches, this enables evolutionary computation to be used for opti-misation and search in problem domains where the structure cannot be well characterised in advance (e.g. optimising an unknown function that describes a user’s utility for energy consumption, or predicting future power market prices). On the other hand, evolutionary methods have inherent drawbacks in convergence, interpretability, can have unpre-dictable results, and there is no guarantee of finding the optimal solu-tions [130]. Because of their advantages, EC algorithms been used in a variety of fields [131,132].
In the literature on energy DR the prevailing method from the evolutionary computation is genetic algorithms [130–134]; GA is a model which abstracts the biological evolution process as described in Charles Darwin’s theory of natural selection [135]. At the HEMS level, GAs are used to find the optimal switching time of each appliances. In this case, a population’s individual xi is constituted by a set of binary values (xi ¼ fxi1;xi2;…;xiJg) stating if the corresponding appliance is on or off at the considered time j [136,137], as explained below. For retailers’ or aggregators’ price scheme optimisation, GA usually consider individuals that consist in a set of prices pi ¼ fpi1;pi2;…;piJg, with pij the price for the
jth period of the day [130,134,138–140]. These prices are the first
generated randomly within the constraints, and the sets that produce the best outputs will then generate a next generation of prices. The objective function used to compute the output is usually a cost or benefit function, which aims at maximising the aggregator’s profit. Then, each approach has its own replacement, crossover and mutation methods between the different prices’ sets of one population. Finally, GA have also been used to train a neural network [141], and find the optimal parameters of an SVR model [55].
Furthermore, variations of the GA have been used in the multi- objective setting by primarily utilising the Non-dominated Sorting Ge-netic Algorithm II (NSGA II) [142]. The NSGA-II is an evolutionary al-gorithm that employs an elitist strategy to discover Pareto-optimal solutions for multi-objective problems, while being efficient in handling various constraints [143]. In DR it has been widely applied in the multi-objective scheduling of loads [144–148].
Other evolutionary algorithms which have used in the DR setting are the population-based differential evolution algorithm [140], which can be though as an further extension to GA with explicit updating equations [130], a differential Evolutionary Algorithm (EA) for the multi-objective management of lithium-ion battery storage in a datacenter for DR [149], and a bi-level evolutionary algorithm (EA) to determine a retailer’s optimal power pricing in the face of DR strategies of consumers trying to minimise their electricity expenses [134].
3.2.2. Swarm artificial intelligence
The term swarm intelligence refers to a subdomain of AI related to the intelligent behaviour of biological swarms and how simulating these biological behaviours can be used to solve various tasks [150]. Swarm Intelligence algorithms most commonly found in the literature are