arXiv:astro-ph/0402623v1 26 Feb 2004
Astronomy & Astrophysicsmanuscript no. resume February 2, 2008
(DOI: will be inserted by hand later)
XMM-Newton
observations of the giant H
region N 11 in the LMC
⋆
Y. Naz´e
⋆⋆1, I.I. Antokhin
⋆⋆⋆1,2, G. Rauw
†1, Y.-H. Chu
3, E. Gosset
†1, and J.-M. Vreux
11 Institut d’Astrophysique et de G´eophysique; Universit´e de Li`ege; All´ee du 6 Aoˆut 17, Bat. B5c; B 4000 - Li`ege; Belgium 2 Astronomy and Astrophysics Group; Department of Physics and Astronomy; Kelvin Building, University of Glasgow;
Glasgow G12 8QQ; United Kingdom
3 Astronomy Department; University of Illinois at Urbana-Champaign; 1002 West Green Street; Urbana, IL 61801; USA
Received 6 November 2003 / Accepted 21 January 2004
Abstract. Using the sensitive XMM-Newton observatory, we have observed the giant H region N 11 in the LMC for ∼30 ks. We have detected several large areas of soft diffuse X-ray emission along with 37 point sources. One of the most interesting results is the possible association of a faint X-ray source with BSDL 188, a small extended object of uncertain nature. The OB associations in the field-of-view (LH9, LH10 and LH13) are all detected with XMM-Newton, but they appear very different from one another. The diffuse soft X-ray emission associated with LH9 peaks near HD 32228, a dense cluster of massive stars. The combined emission of all individual massive stars of LH9 and of the superbubble they have created is not sufficient to explain the high level of emission observed: hidden SNRs, colliding-wind binaries and the numerous pre-main sequence stars of the cluster are most likely the cause of this discrepancy. The superbubble may also be leaking some hot gas in the ISM since faint, soft emission can be observed to the south of the cluster. The X-ray emission from LH10 consists of three pointlike sources and a soft extended emission of low intensity. The two brightest point sources are clearly associated with the fastest expanding bubbles blown by hot stars in the SW part of the cluster. The total X-ray emission from LH10 is rather soft, although it presents a higher temperature than the other soft emissions of the field. The discrepancy between the combined emission of the stars and the observed luminosity is here less severe than for LH9 and could be explained in terms of hot gas filling the wind-blown bubbles. On the other hand, the case of LH13 is different: it does not harbour any extended emission and its X-ray emission could most probably be explained by the Sk −66◦
41 cluster alone.
Finally, our XMM-Newton observation included simultaneous observations with the OM camera that provide us with unique UV photometry of more than 6000 sources and enable the discovery of the UV emission from the SNR N11L.
Key words.ISM: individual objects: LMC N11 – Magellanic Clouds – Galaxies: star clusters – Ultraviolet: stars – X-rays: general
1. Introduction
Massive stars are known to deeply influence the structure and dynamics of their environment. Their fast stellar winds com-bined with their huge mass-loss rates and their powerful ex-plosion as supernovae (SNe) can shape the interstellar medium (ISM), creating various structures from small wind-blown bub-bles around single stars to large superbubbub-bles around OB as-sociations. This collective action can best be understood by studying nearby H regions, with embedded OB associations containing hundreds of massive stars. In this context, we have
Send offprint requests to: Y. Naz´e e-mail: naze@astro.ulg.ac.be ⋆ Based on observations collected with XMM-Newton, an ESA
Science Mission with instruments and contributions directly funded by ESA Member States and the USA (NASA).
⋆⋆ Research Fellow FNRS (Belgium)
⋆⋆⋆ On leave from Sternberg Astronomical Institute, Moscow
University, Russia
†
Research Associate FNRS (Belgium)
chosen to study the N 11 complex (Henize 1956) in the Large Magellanic Cloud (LMC).
N 11 is the second largest H region in the LMC after 30 Doradus, and it may constitute a more evolved version of this latter nebula (Walborn & Parker 1992). It harbors several asso-ciations of massive stars: LH9, LH10, LH13 and LH14 (Lucke & Hodge 1970). Its structure is complex and reflects the in-teractions between the stars and their environment. The central cluster, LH9, is surrounded by a filamentary shell of ∼120 pc in diameter. The combined action of stellar winds and supernova explosions from the members of the cluster has carved a hollow cavity in the surrounding ISM, thereby creating the shell which is also called a superbubble. The hot shocked winds/ejecta that fill this cavity emit X-rays (Mac Low et al. 1998) and provide the pressure to drive the superbubble shell expansion. Only su-pernovae outside the superbubble can produce distinct super-nova remnants (SNRs) such as N11L at the western edge of the N11 complex (Williams et al. 1999).
Fig. 1. Three colour image of the N 11 region as seen by the combined EPIC cameras. The red, green and blue colours correspond
respectively to the 0.4 − 1.0 keV, 1.0 − 2.0 keV and 2.0 − 10.0 keV energy bands. Note that this image is based on a pn event list that was filtered using #XMMEA EP and 0 ≤ pattern ≤ 12. This event list was only used for aesthetic reasons in the aim of creating Figs. 1 & 2, not for any scientific analysis.
The action of LH9 on its surroundings has also triggered a burst of star formation at the periphery (Rosado et al. 1996), leading to the birth of the three other OB associations. Situated to the north of LH9, LH10 is still embedded in its natal cloud but its most massive components have already begun to blow bubbles around them (Naz´e et al. 2001). The stellar popula-tion of LH9 and LH10 has been studied by Parker et al. (1992, hereafter PGMW) and Walborn et al. (1999). To the east of LH9 lies LH13, which appears to contain two tight clusters, Sk
−66◦41 and HNT (Heydari-Malayeri et al. 2000). However, the ages and radial velocities indicate that the ≤ 5 Myr old cluster Sk −66◦41 is associated with the surrounding H region and the ∼100 Myr old cluster HNT is unrelated and most proba-bly just a line-of-sight object (Heydari-Malayeri et al. 2000). Situated at the northeast outskirts of N 11, LH14 is the least studied of the four OB associations; the existence of a few mas-sive stars in LH14 has been illustrated in a photometric study by Heydari-Malayeri et al. (1987).
In summary, the N 11 complex harbours a variety of phe-nomena associated with massive stars (e.g. bubbles and super-bubbles), and even contains a SNR. All these objects should be associated with some hot gas. N 11 thus provides an interest-ing target for deep X-ray observations. A ROSAT investigation only permitted to detect some X-ray emission (Mac Low et al. 1998, Dunne et al. 2001), but the unprecedented sensitivity of XMM-Newton enables us to study this region in more details.
In the following sections, we will first describe the observa-tions and the X-ray sources detected in the field. Next, we will focus on the main components of N 11: the SNR, the superbub-ble, LH10 and LH13. Finally, we will conclude in Section 6.
2. Observations
2.1. X-ray data
N 11 was observed with XMM-Newton (Jansen et al. 2001) in the framework of the guaranteed time of the Optical Monitor Consortium during revolution 325, on 17 Sept. 2001, for ap-proximately 30 ks. The two EPIC MOS cameras (Turner et al. 2001) were used in full window mode, and the EPIC pn instru-ment (Str¨uder et al. 2001) was operated in extended full frame mode. A thick filter was added to reject optical light. These in-struments are sensitive to radiation in the 0.4-10.0 keV range, and the on-axis spatial resolution of XMM-Newton is about 5′′. We used the Science Analysis System (SAS) software ver-sion 5.4.1. to reduce the EPIC data. These data were first processed through the pipeline chains, and then filtered. For EPIC MOS, only events with a pattern between 0 and 12 and passing through the #XMMEA EM filter were considered. For EPIC pn, we kept events with flag=0 and a pattern between 0 and 4. To check for contamination by low energy protons,
Fig. 3. Optical Monitor (OM) image of N 11 through the UV
filter UVM2. Note that the FOV is smaller than the EPIC FOV. At the rightmost side of the image, the SNR N11L can be seen as a faint diffuse ring. Diffuse halos around bright stars are arte-facts.
we have further examined the light curve at high energies (Pulse Invariant channel number>10000, ∼E>10 keV, and with pattern=0). No background flares were detected. The resulting useful exposure times are 32.5 ks, 32.5 ks, and 25.4 ks for EPIC MOS1, MOS2 and pn, respectively. Further analysis was per-formed using the SAS version 5.4.1. and the FTOOLS tasks. The spectra were analysed and fitted within XSPEC v11.0.1.
Figures 1 and 2 show images of the field from the combined EPIC data. Figure 1 provides a three colour image, in which numerous point sources and diffuse, soft emissions are clearly seen. Figure 2 gives the identification of the point sources de-tected in the field (see Sect. 3).
2.2. Optical Monitor data
During the X-ray observation, the field was also observed through two UV filters (UVW1 and UVM2) and the visible (V) filter of the Optical Monitor (OM) onboard XMM-Newton (Mason et al. 2001). The exposure times were 1 ks, 3 ks, and 1 ks for the UVW1, UVM2, and V filters, respectively. The coverage of the full OM field necessitated five consecutive posures. The OM is a 30 cm optical and UV telescope with ex-tremely sensitive detectors. It is working in a photon-counting mode, analogous to the way the X-ray detectors work. The data obtained with the OM are thus quite different from the ‘stan-dard’ ground-based data, and present particular features, like fixed ‘modulo-8’ noise and significant coincidence losses even for relatively faint objects (Mason et al. 2001). Further compli-cations follow from the fact that the OM Point Spread Function (PSF) depends on the source brightness1.
We used SAS tasks omatt and ommosaic to create astro-metrically corrected composite images of the full field-of-view (FOV). An example of such a composite image is shown in Fig. 3 for the UVM2 filter. Note that it does not completely cover the entire EPIC FOV. A first estimate of the sky coordinates was obtained using the nominal pointing position of the telescope, and this may result in a systematic shift of our sky coordinates relative to the ideal ones by up to 4′′.
1 Note that the algorithm used to derive the photometry can only
handle a single PSF. However, the errors due to this approximation are certainly smaller than those due to the crowdeness of the field.
Naz´e et al.: XMM-Newton observations of the giant H region N 11 in the LMC 3
Fig. 2. Combined EPIC image of N 11 in the energy range 0.4 − 10 keV. The detected sources are labelled. The image has been
binned by a factor of 50, to obtain a pixel size of 2.5′′.
Fig. 4. Color-magnitude and color-color diagrams for all OM sources. Large dots with error bars correspond to the closest
counterparts of the X-ray sources (see text).
Because of the particular features of the OM and of the extremely crowded nature of the field, the SAS tasks were un-able to fully process the data and generate accurate photometry. For this reason, the photometric reduction was done with the daophot program in the PSF fitting mode. The sources were first detected using the sextractor task. The resulting list of stars was cleaned of spurious identifications, and some miss-ing sources were added: a total of 6250 sources were then de-tected in this field. Next, photometry was derived for these stars using PSF-fitting. The zero point was determined by select-ing relatively isolated stars and performselect-ing aperture photom-etry with an aperture radius of 3′′. After the PSF magnitudes were adjusted to this zero point, they were scaled to the default aperture (6′′) using information about the OM PSF from the SAS current calibration file OM PSF1DRB 0006.CCF. Next, the empirical coincidence loss correction was applied and fi-nally, instrumental V magnitudes were converted to the stan-dard V magnitudes. These transformations are based on the
UVW1−VOM color and were derived by the OM calibration
team from simulations of the color transformations, using OM instrumental response curves and several spectral libraries:
V = VOM − 0.0165 − 0.0059 ∗ (UVW1−VOM) − 0.0009 ∗
(UVW1−VOM)2. In V, UVW1 and UVM2, the zero points of
the OM are set to 17.9633, 17.2965 and 15.8098, respectively. The corresponding simulated magnitudes of Vega are equal to U(Vega)=0.025 mag and V(Vega)=0.03 mag (for more details about the OM calibration, see Antokhin et al., in preparation).
To get a reliable astrometric solution for the OM sources, we used the GSC 2.2 catalog. We first made a tangential projec-tion of all GSC sources to create a linear scale approximately resembling the scale of the OM. Then, we manually cross-identified a few tens of the brighter stars from GSC and OM plots, and used the IRAF’s tasks geomap to compute a non-linear polynomial transformation from the OM coordinate sys-tem to the GSC tangential one. Using this first approximation to cross-identify more sources, we then compute a more pre-cise transformation (rms=0.22′′), which gives reliable results for the GSC 2.2 catalog, the 2MASS All Sky Catalog of Point Sources and the USNO B1.0 catalog in the whole field. Note however that the transformation is less precise at the edges, so that we used an adaptive radius to get the actual GSC, 2MASS or USNO counterpart to the OM sources.
The OM astrometry and photometry of the >6000 sources detected in N 11 are presented in an electronic table that can be retrieved from the Centre de Donn´ees Astronomiques de Strasbourg (CDS). In this table, the first column gives the OM number of the source; the second and third columns show the OM xy coordinates; the next seven columns provide the J2000
right ascension and declination of the sources; columns 11 to 16 present the OM magnitudes in each filter, together with their error; column 17 is ‘y’ if the source has a 2MASS entry2; columns 18 to 23 yield the name and distance to the counterpart from the GSC, USNO B1.0, and PGMW catalogs, respectively. Color-magnitude and color-color diagrams of all OM sources are shown in Fig. 4. These diagrams show a well marked main-sequence in both cases. Our V photometry is one magnitude deeper than PGMW and appears complete down to V=20 mag, which corresponds to an early A-type star on the main sequence, whereas the brightest stars rather have an O3V type. The color-magnitude diagrams of LH9, LH10, and the whole field are very similar, as was shown in classical UBV photometry by PGMW.
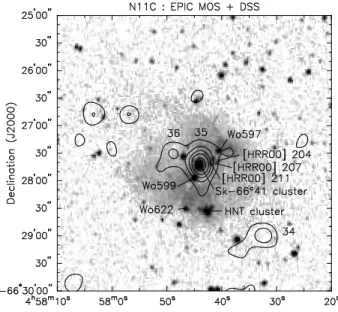
Fig. 5. X-ray contours overlaid on a DSS image of N 11. The
combined X-ray data of both EPIC MOS have been binned to obtain pixels of 2.5′′, and then smoothed by convolution with a gaussian (σ = 3 px). The contours are at levels 0.35, 0.5, 0.8, and 2 cts pixel−2. N11B (containing LH10) is the bright
nebula just northeast of the center, while N11C (LH13) and N11D (LH14) are the two easternmost nebulae of the field.
3. X-ray sources in the field
3.1. List of sources
The X-ray data of N 11 reveal several point sources and ex-tended emissions, as can be seen in Fig. 1. The latter category will be extensively discussed in Sect. 4, and we will focus here only on the point sources.
To search for discrete X-ray sources, we have applied the detection metatask edetect chain simultaneously to the data from the three EPIC cameras. We used three energy bands: 0.4 − 1.0 keV, 1.0 − 2.0 keV and 2.0 − 10.0 keV. We elimi-nated the false detections mainly due to structures in the diffuse emissions by rejecting the extended sources, the sources with a logarithmic likelihood < 5 in one detector and/or a combined logarithmic likelihood for the three detectors < 30. This proce-dure left 37 point sources in the field. Their positions are shown in Fig. 2 and their properties are presented in Table 1, in order of increasing right ascension. Their background-subtracted and vignetting-corrected count rates in each of the EPIC cameras
2 2MASS designations are not included since they are simply the
are also indicated, together with Hardness Ratios (HRs) cal-culated from EPIC pn data. These HRs are defined as HR1 = (M−S )/(M+S ) and HR2 = (H − M)/(H + M), where S , M, and H correspond to the count rates in the 0.4 − 1.0, 1.0 − 2.0 and 2.0 − 10.0 keV bands, respectively. Note that the SAS detection tasks do not apply a correction for out-of-time events or dead times. For the EPIC pn data used in extended full frame mode, this implies an overestimate of the exposure time (and thus an underestimation of the count rates) by 2.3%. Since this amount is well within the errors, we choose not to correct the pn count-rates provided by edetect chain. Finally, a few sources asso-ciated with the LH10 cluster were excluded by the selection criteria defined above. They are thus not included in Table 1 but will be extensively discussed in Sect. 4.4.
3.2. Identification
We have compared our source list to the ROSAT detections in the same field. Six catalogs are available: Haberl & Pietsch (1999, [HP99]), Sasaki et al. (2000, [SHP2000]), the WGA cat-alog (White et al. 2000, 1WGA) and three catcat-alogs from the ROSAT teams (ROSAT consortium 2000a, 1RXH; ROSAT con-sortium 2000b, 2RXP; and Voges et al. 1999 & 2000, 1RXS). The source detection algorithms used in the last four catalogs were most probably confused by the presence of diffuse emis-sions and generated a lot of false detections. They should thus be taken more cautiously than the first two and are only given here for information. The cross-correlations between XMM-Newton and ROSAT source names are presented in Table 2. For completeness, the positional error on the ROSAT detections and their separation from the XMM-Newton sources are also listed in the last two columns of the Table. Generally, the sources’ positions agree within the errors. There seems to be no bright transient source in the field of N 11.
To search for optical counterparts, we have cross-correlated our source list with the Simbad catalog, the USNO B1.0 cata-log, the 2MASS All-Sky Catalog of Point Source and the GSC 2.2 catalog. We have defined a candidate counterpart as an
ob-ject lying less than 5′′(the FWHM of the XMM-Newton PSF)
from the X-ray source. 21 X-ray sources may possess such visible counterparts, and we give the latter in the right-hand side of Table 1, together with the separation between the X-ray sources and these objects, and some basic informations about them. Fig. 5 presents X-ray contours overlaid on a DSS im-age of the field. Note that the LH14 cluster is not included in
the XMM FOV. Our 5′′ criterion failed to associate XMMU
J045744.1−662741 (source #35) with Sk −66◦41, due to the
low precision of the coordinates of this object in the catalog of Sanduleak (1970)3. However, as there is little doubt about
this identification (see Sect. 5), it was added to Table 1. We also note that XMMU J045538.8−662549 (source #21) is quite close to a bright Cepheid (see below).
Counterparts were also identified from the OM data. Using our astrometric solution for the OM sources (see Sect. 2.2),
3 Note that if we use the coordinates found in the USNO, GSC,
and 2MASS catalogs, the X-ray source is less than 1.′′
2 away from the cluster core.
we correlated the OM source list with the X-ray one. Table 3 gives the photometry of the OM counterpart(s) found within 5′′ of our ray sources. The optical counterparts of the X-ray sources can be compared with field sources in the color-magnitude and color-color diagrams presented in Fig. 4. Even if the OM filter combination used in our observation is not op-timal for classification purposes (see Royer et al. 2000), the colors apparently favor a stellar origin for most of these coun-terparts. The majority lies within the main sequence of the clus-ters, but the counterpart of XMMU J045501.8−663123 (source #10) is a rather bright red star lying clearly outside the main sequence. Only a very small number of these OM counterparts may possibly be quasars at low redshift, but quasars at high redshift are highly improbable.
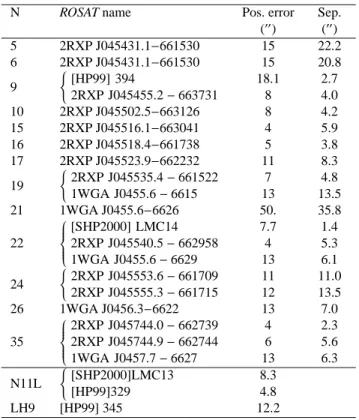
Table 2. X-ray sources previously detected in the field. The
number in the first column refers to our internal number-ing scheme (see Table 1). Identifications with the 2RXP and 1WGA catalogs have only an indicative value. When there were two entries with the same name in the 1WGA catalog, we kept only the source detected with the smallest off-axis an-gle, as recommended by the WGA team. The second part of the Table deals with the diffuse extended emissions. Several spurious X-ray sources were detected in the 2RXP and 1WGA catalogs at their position, and we will not list them here.
N ROSAT name Pos. error Sep.
(′′ ) (′′ ) 5 2RXP J045431.1−661530 15 22.2 6 2RXP J045431.1−661530 15 20.8 9 ( [HP99] 394 2RXP J045455.2 − 663731 18.1 8 2.7 4.0 10 2RXP J045502.5−663126 8 4.2 15 2RXP J045516.1−663041 4 5.9 16 2RXP J045518.4−661738 5 3.8 17 2RXP J045523.9−662232 11 8.3 19 ( 2RXP J045535.4 − 661522 1WGA J0455.6 − 6615 7 13 4.8 13.5 21 1WGA J0455.6−6626 50. 35.8 22 [SHP2000] LMC14 2RXP J045540.5 − 662958 1WGA J0455.6 − 6629 7.7 4 13 1.4 5.3 6.1 24 ( 2RXP J045553.6 − 661709 2RXP J045555.3 − 661715 11 12 11.0 13.5 26 1WGA J0456.3−6622 13 7.0 35 2RXP J045744.0 − 662739 2RXP J045744.9 − 662744 1WGA J0457.7 − 6627 4 6 13 2.3 5.6 6.3 N11L ( [SHP2000]LMC13 [HP99]329 8.3 4.8 LH9 [HP99] 345 12.2 3.3. Variability
We have analysed the lightcurves of the 6 brightest point sources (i.e. with at least 50 cts in EPIC MOS and 100 cts in EPIC pn in the 0.4 − 10.0 keV range). The count rates in
N az ´e et al .: X M M -N ew to n o b se rv at io n s o f th e g ia n t H r eg io n N 1 1 in th e L M C 5
Table 1. Coordinates of the detected X-ray point sources with their individual count rates for each of the three detectors, in the 0.4 − 10 keV range. A missing value means the source is in a gap or out of the field-of-view for this particular detector. The Hardness Ratios (HRs) were evaluated on the EPIC pn data. The right-hand side of the table shows the results of the correlation with the GSC 2.2 catalog, the 2MASS All-Sky Catalog of Point Sources, and the USNO B1.0 catalog. In these last columns, Nr represents the number of counterparts in the correlation region, while d corresponds to the distance between the X-ray source and its counterpart, if unique.
N Name CR MOS1 CR MOS2 CR pn HR1 HR2 GSC 2.2 2MASS USNO B1.0
10−3cts s−1 10−3cts s−1 10−3cts s−1 Nr d(”) R B Nr d(”) J H K Nr d(”) B1 R1 B2 R2 I 1 XMMU J045349.8−661928 9.9±1.6 0.44±0.14 -0.07±0.19 1 2.9 18.6 0 1 3.7 18.4 18.9 2 XMMU J045404.6−661657 9.1±1.5 0.26±0.14 -0.41±0.25 1 3.4 17.9 0 1 2.1 17.2 18.1 16.9 17.1 3 XMMU J045423.4−663349 2.4±0.7 1.1±0.5 3.9±1.0 0.30±0.25 -0.22±0.34 1 3.4 13.8 0 1 3.8 18.5 18.1 18.6 4 XMMU J045427.5−662522a 2.2±0.6 1.9±0.5 0 0 2 5 XMMU J045429.4−661510 15.6±2.2 0.32±0.14 -0.05±0.17 0 0 0 6 XMMU J045434.2−661537 2.9±0.9 4.7±1.2 -0.12±0.29 0.35±0.28 0 0 1 2.9 18.6 20.1 18.6 7 XMMU J045446.4−662004 5.9±0.7 7.4±0.8 16.8±1.4 0.51±0.09 0.18±0.08 1 1.0 18.2 17.9 0 4 8 XMMU J045448.9−663120 1.7±0.5 2.3±0.5 6.5±0.9 0.27±0.18 0.14±0.14 0 0 0 9 XMMU J045454.6−663733 2.4±0.7 1.9±0.7 7.5±1.3 0.19±0.28 0.42±0.17 0 0 1 4.1 18.4 20.5 18.2 17.7 10 XMMU J045501.8−663123 0.8±0.3 1.1±0.3 5.3±0.7 -0.27±0.12 -0.86±0.24g 1 1.7 14.4 1 1.8 13.9 13.5 13.4 2 11 XMMU J045502.0−663147 1.7±0.4 1.4±0.3 3.1±0.7 0.64±0.29e 0.00±0.21 1 0.3 17.5 0 0 12 XMMU J045502.2−663349 0.9±0.4 1.1±0.4 3.1±0.8 0.22±0.53e 0.57±0.21 1 3.0 18.0 0 1 2.8 17.5 18.1 13 XMMU J045509.0−663018 1.9±0.4 3.9±0.6 1.00±0.09e 0.43±0.13 1 0.9 17.3 1 1.4 16.0 15.2 15.3 1 1.7 16.7 15.8 16.7 14 XMMU J045513.4−663225 1.9±0.4 1.4±0.3 3.6±0.7 0.52±0.38e 0.43±0.16 0 0 1 4.2 17.4 15.7 17.8 15 XMMU J045515.1−663039 2.2±0.5 3.4±0.9 4.6±0.7 0.77±0.21e 0.08±0.14 0 0 0 16 XMMU J045517.8−661736 3.5±0.6 4.6±0.7 8.6±1.0 0.45±0.14 0.01±0.13 0 0 0 17 XMMU J045524.6−662224 1.7±0.3 2.3±0.3 4.7±0.7 0.77±0.16 -0.23±0.14 0 0 0 18 XMMU J045533.8−663015 0.7±0.2 0.6±0.2 1.4±0.4 0.89±0.21e, f 0 0 0 19 XMMU J045534.9−661525b 3.2±0.5 4.8±0.7 12.6±1.2 -0.72±0.06 -1.00±0.28g 1 1.0 11.5 1 1.2 9.2 8.7 8.7 1 1.0 11.4 10.1 10.9 10.1 9.8 20 XMMU J045536.4−662526 0.6±0.2 1.0±0.2 2.6±0.4 1.00±0.12e 0.21±0.16 0 0 1 4.4 20.2 17.4 21 XMMU J045538.8−662549 1.1±0.2 1.4±0.2 2.3±0.6 1.00±0.15e -0.05±0.26 0 0 0 22 XMMU J045539.6−662959 5.6±0.5 5.6±0.5 17.4±1.1 0.14±0.08 -0.02±0.07 1 2.9 16.4 0 2 23 XMMU J045554.7−662715 1.8±0.3 1.9±0.3 5.6±0.6 0.48±0.15 -0.06±0.11 0 0 0 24 XMMU J045555.0−661701 0.9±0.3 0.9±0.4 4.4±0.8 -0.35±0.14 -0.31±0.34 0 1 0.8 15.1 14.5 14.2 0 25 XMMU J045619.2−662631 0.9±0.2 0.9±0.3 2.0±0.5 0.46±0.39e 0.04±0.22 0 0 0 26 XMMU J045624.3−662205 2.8±0.4 3.0±0.4 8.0±0.8 0.06±0.12 -0.17±0.10 0 0 0 27 XMMU J045629.7−662701c 0.5±0.2 0.7±0.3 2.0±0.5 0.49±0.49e 0.30±0.21 0 0 2 28 XMMU J045632.2−661908 0.8±0.3 0.4±0.3 2.4±0.6 1.00±0.31e 0.05±0.24 0 0 0 29 XMMU J045637.1−661828 0.7±0.3 1.4±0.4 4.5±0.7 0.25±0.25 0.22±0.16 0 0 1 2.9 16.9 15.0 17.2 30 XMMU J045706.7−662705 0.8±0.4 1.1±0.3 3.4±0.7 0.41±0.25 -0.16±0.21 1 3.5 16.3 0 2 31 XMMU J045727.9−662234 1.3±0.4 1.5±0.4 4.8±0.9 0.67±0.27e 0.49±0.13 0 0 0 32 XMMU J045728.1−663302 2.8±0.5 8.1±1.2 1.00±0.41e 0.57±0.11 1 2.5 16.4 0 0 33 XMMU J045729.2−662256 1.1±0.4 1.5±0.4 2.7±0.7 1.00±0.25e 0.41±0.23 0 0 0 34 XMMU J045732.2−662856 1.5±0.4 0.7±0.3 3.9±0.9 0.27±0.31 0.24±0.22 0 0 0 35 XMMU J045744.1−662741d 3.9±0.6 2.5±0.5 10.4±1.2 -0.15±0.11 -1.00±0.14g 1 0.9 11.8 1 1.2 11.9 12.0 11.9 1 0.9 12.1 13.0 12.7 13.1 13.3 36 XMMU J045749.2−662726 1.6±0.4 0.5±0.3 3.1±1.0 0.00±0.39 0.28±0.35 0 0 0 37 XMMU J045749.2−662210 1.4±0.4 5.1±1.0 0.56±0.26 0.28±0.17 0 0 0
aThis source corresponds to BSDL 188 (see Fig. 7 and Sect. 3.5). An infrared source, IRAS 04543−6629, is situated at 4.′′1 from the X-ray source, and may be coincident with it.
bThis source corresponds to HD 268670 (B=11.3,V=10.49, spectral type K0). cPGMW 2088 (B=18.6, V=18.8) lies at 1.′′9 from this source.
dThis source corresponds to the tight cluster HD 268743 (Sk−66◦41, B=11.6, V=11.7, combined spectral type O3V((f*))+OB)
eFor this source, the count rate in the soft band is, within the errors, close to zero. fFor this source, the count rate in the medium band is, within the errors, close to zero. gFor this source, the count rate in the hard band is, within the errors, close to zero.
each bin were background-subtracted using annuli around the sources or close-by circles for the background estimation re-gions. The effective bin lengths were calculated by taking into account the ‘good time intervals’ defined in Sect. 2. The result-ing lightcurves were analysed usresult-ing Kolmogorov-Smirnov and
χ2 tests. We also ran a modified probability of variability test (Sana et al. 2004) on the event lists of these sources. In the N 11 field, no source was found significantly variable over the time of our observation.
Table 3. Photometry of the OM counterparts lying within 5′′
from X-ray sources. The number in the first column refers to our internal numbering scheme (see Table 1).
N V±σV UVW1±σUVW1 UVM2±σUVM2 Sep.
(mag) (mag) (mag) (′′
) 10 15.57 ± 0.04 17.56 ± 0.07 19.24 ± 0.26 1.7 11 19.34 ± 0.18 19.20 ± 0.15 18.78 ± 0.25 1.8 13 17.72 ± 0.06 19.43 ± 0.15 20.02 ± 0.34 1.0 14 19.76 ± 0.19 19.30 ± 0.16 19.22 ± 0.21 4.4 17 ( 19.84 ± 0.17 20.00 ± 0.16 19.38 ± 0.22 19.43 ± 0.19 18.86 ± 0.17 18.56 ± 0.18 2.8 3.7 20 17.25 ± 0.06 16.23 ± 0.03 16.04 ± 0.03 4.4 22 19.27 ± 0.13 18.34 ± 0.13 19.00 ± 0.15 0.2 27 ( 19.20 ± 0.13 19.44 ± 0.20 19.28 ± 0.18 19.23 ± 0.19 19.73 ± 0.28 18.89 ± 0.17 1.8 4.5 28 18.98 ± 0.13 19.74 ± 0.21 19.90 ± 0.32 3.6 30 16.54 ± 0.05 14.89 ± 0.03 14.60 ± 0.02 3.7 3.4. Spectral properties
We have also extracted4the spectra of these brightest sources.
We have generated response matrix files (rmf) and ancillary re-sponse files (arf) using the SAS tasks rmfgen and arfgen. The spectra were binned to reach a minimum of 10 cts per channel. Finally, we analysed the background-corrected spectra within XSPEC. Due to strong noise at very low and very high ener-gies, we have discarded bins below 0.4 keV or above 10 keV. We have fitted the spectra with an absorbed mekal model or an absorbed power-law. For each source, we have fitted separately EPIC MOS1+2 and EPIC pn data, but as they gave similar re-sults – within the errors – we finally fitted all three instruments at the same time and we list the parameters of the best-fit mod-els in Table 4.
3.5. Individual sources
– XMMU J045427.5−662522 (source # 4):
One of the most interesting discoveries in this field is the X-ray emission associated with a small ellipsoidal object west of N11 L, roughly 28′′×24′′in size. This extended object correponds to BSDL 188, also known in Simbad as MSX
4 To ensure a correct determination of the X-ray properties of the
sources, all extractions (spectra, lightcurves) were made in detector coordinates.
LMC 1241, which is classified as an emission nebula plus association in Bica et al. (1999). But this object also corre-lates well with an IR source (IRAS 04543−6630, or LEDA 89996, or QDOT B0454225−662949) classified as a nearby galaxy of radial velocity ∼ 7100 − 8500 km s−1(Lawrence et al. 1999, LEDA database). At that position, two extended objects are also listed in the 2MASS Extended Sources
Catalog: 2MASX 04542820−6625275 (radius=29′′) and
2MASX 04542184−6625310 (radius=15′′). Since Bica et
al. (1999) did only an imaging survey without any spectro-scopic information, the BSDL 188 “nebula” probably cor-responds to this galaxy. Unfortunately, it lies outside the OM field-of-view and we thus cannot provide any infor-mation on the UV emission of this object. We note how-ever that the X-ray source is not exactly centered on the ex-tended object, but is slightly off-axis. We also remark that the X-ray source is not extended, as far as the resolution of XMM-Newton can tell. Deeper investigations of this pe-culiar source are needed to better understand the nature of the extended object and the underlying mechanisms of the X-ray emission.
– XMMU J045446.4−662004 and XMMU
J045517.8−661736 (i.e. our sources # 7 and # 16): Their poor fit by a mekal model, large hardness ratios, rather large N(H) (3−5×1021 cm−2), and Γ ∼ 1.7 − 1.8
suggest that these sources are actually extragalactic background objects. Approximately one third of the point sources detected in this field possess large HRs, and probably do not belong to the LMC.
– XMMU J045534.9−661525 = HD 268670 (source # 19):
This low-mass foreground K0 star is clearly detected in our observation, with an X-ray flux of ∼2×10⁻¹⁴ergs s−1cm−2. No significant X-ray variability was found for this source. The X-ray spectrum of this object is well fitted by an op-tically thin thermal plasma model but not by a power law, in agreement with the idea of this being a coronal emission from a late-type star.
– XMMU J045538.8−662549 (source # 21):
This source is 21′′away from a Cepheid star of type G2Iab. X-ray emission from Cepheids has never been detected (e.g. Evans et al. 2002), and it is not clear that the X-ray source is physically associated with the Cepheid. If it is the case, then a companion would most probably be responsi-ble for the X-ray emission.
Fig. 6. Regions of extraction for each diffuse source.
Circles of radius 30′′ centered on point sources XMMU
J045619.2−662631 (source #25), XMMU J045624.3−662205 (source #26), and XMMU J045629.7−662701 (source #27) were excluded from the extractions. The northern extended emission was cut in two parts, since it lies on two different EPIC pn CCDs.
Naz´e et al.: XMM-Newton observations of the giant H region N 11 in the LMC 7
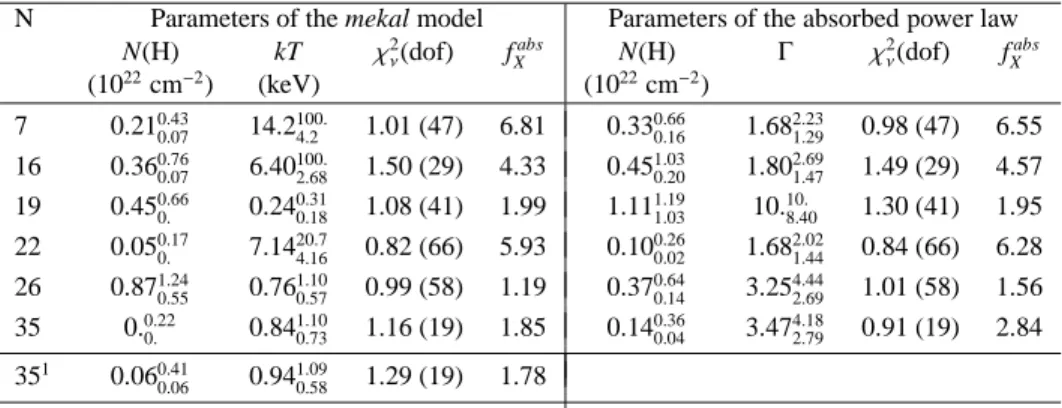
Table 4. Parameters of the spectral fits for the brightest point sources. Stated errors correspond to the 90 % confidence level.
The global metallicity was set to 0.3 Z⊙, as appropriate for the LMC, for all sources except XMMU J045534.9−661525 (source # 19), for which we adopt solar abundances since it corresponds to a foreground star. Absorbed fluxes are given in the spectral range 0.4 − 10 keV and in units 10−14ergs cm−2s−1. The results correspond to a simultaneous fit of all EPIC spectra available. A constrained fit for XMMU J045744.1−662741 is also listed below.
N Parameters of the mekal model Parameters of the absorbed power law
N(H) kT χ2 ν(dof) fXabs N(H) Γ χ 2 ν(dof) fXabs (1022cm−2) (keV) (1022cm−2) 7 0.210.43 0.07 14.2 100. 4.2 1.01 (47) 6.81 0.33 0.66 0.16 1.68 2.23 1.29 0.98 (47) 6.55 16 0.360.76 0.07 6.40 100. 2.68 1.50 (29) 4.33 0.45 1.03 0.20 1.80 2.69 1.47 1.49 (29) 4.57 19 0.450.66 0. 0.24 0.31 0.18 1.08 (41) 1.99 1.11 1.19 1.03 10. 10. 8.40 1.30 (41) 1.95 22 0.050.17 0. 7.14 20.7 4.16 0.82 (66) 5.93 0.10 0.26 0.02 1.68 2.02 1.44 0.84 (66) 6.28 26 0.871.24 0.55 0.76 1.10 0.57 0.99 (58) 1.19 0.37 0.64 0.14 3.25 4.44 2.69 1.01 (58) 1.56 35 0.0.22 0. 0.84 1.10 0.73 1.16 (19) 1.85 0.14 0.36 0.04 3.47 4.18 2.79 0.91 (19) 2.84 351 0.060.41 0.06 0.94 1.09 0.58 1.29 (19) 1.78 1N(H) constrained to the interval 0.06 − 0.6 × 1022cm−2(see Sect. 4.1).
Table 5. Parameters of the spectral fits for the extended sources. Stated errors correspond to the 90 % confidence level. The
global metallicity was set to 0.3 Z⊙for all sources. Fluxes are given in the spectral range 0.4 − 10 keV, and in units 10−14ergs cm−2s−1. Unabsorbed fluxes are corrected for the fitted N(H). The results correspond to a simultaneous fit of all EPIC spectra, except for the NE source, for which only a pn spectrum was available. Constrained fits are also listed below when the fitted N(H) was outside the ‘allowed’ range (see Sect. 4.1). Note that solutions with χ2>2 were not included.
Source Parameters of the mekal model Parameters of the absorbed power law
N(H) kT χ2 ν(dof) fXabs f unabs X N(H) Γ χ 2 ν(dof) fXabs f unabs X (1022cm−2) (keV) (1022cm−2) N11L 0.430.46 0.40 0.15 0.16 0.15 1.63 (162) 23.1 459. plume N of N11L 0.680.73 0.64 0.15 0.18 0.14 1.29 (175) 11.0 755. 0.72 0.92 0.57 7.38 8.76 6.37 1.79 (175) 11.2 1500. LH9 0.410.45 0.37 0.18 0.18 0.17 1.54 (419) 45.9 663. LH10 0.050.17 0. 0.59 0.66 0.52 1.39 (35) 4.56 5.56 NE 0.360.44 0.10 0.22 0.29 0.19 1.05 (45) 4.56 34.0 NW 0.260.35 0.20 0.23 0.25 0.20 1.36 (154) 9.29 40.8 LH91 0.200.20 0.18 0.23 0.23 0.22 1.74 (419) 45.0 100. LH102 0.100.18 0.10 0.58 0.63 0.51 1.41 (35) 4.49 6.51 1N(H) constrained to the interval 0.06 − 0.2 × 1022cm−2(see Sect. 4.1). 2N(H) constrained to the interval 0.1 − 0.8 × 1022cm−2(see Sect. 4.1).
4. Diffuse emissions
Soft diffuse emission is seen throughout the field (see Fig. 1). The brightest and most compact diffuse X-ray emission region corresponds to the SNR N11L. Extended diffuse X-ray emis-sion covers LH9, LH10 and a region to the north of these clus-ters (see Figs. 5 and 6). The emission associated with N11L, LH9 and LH10 will be discussed more extensively in Sects. 4.2, 4.3, and 4.4, respectively. The last region of diffuse emission, which will be called N11-North, is projected around XMMU J045624.3−662205 (i.e. source # 26), but may not be physi-cally connected to this source. This extended X-ray emission is confined by faint Hα filaments. It is bisected by a north-south oriented ridge of low X-ray surface brightness coincident
with an Hα filament; the low X-ray surface brightness is thus probably caused by a higher absorption column density pro-vided by the filament. Meaburn et al. (1989) and Mac Low et al. (1998) studied the kinematics of N11 and revealed the ex-istence of expanding motions in the Hα line at the position of the eastern part of N11-North (hereafter called ‘NE’, see Fig. 6), while they detected no line splitting further north. The X-ray emission may thus be the result of shocked expanding gas. Unfortunately, nothing is known on the kinematics of the west-ern part of N11-North (hereafter called ‘NW’, see Fig. 6).
To study these diffuse X-ray emission regions quantita-tively, we have chosen the extraction regions shown in Fig. 6. Nearby source-free regions were used as background for N11L
Fig. 7. Close-up on N11L (DSS+EPIC MOS, as for Fig. 3).
Contours have been drawn at levels of 0.35, 0.5, 0.65, 0.8, 1, 1.5, 2, 2.5, and 3 cts pixel−2. Note that a CCD gap (∼10′′in width) is present just east of the SNR. It crosses the field in the NNE-SSW direction, and can be located easily since it cor-responds to a region of apparently lower X-ray emission. The X-ray point sources present in the field are labeled.
and the extended X-ray emission to its north, but there is no emission-free region near the other sources. Due to fluorescent features in the instrumental background that change with the position on the detector (see e.g. Lumb 2002), we cannot use the background spectrum from a region lying too far away from our diffuse sources for background subtraction. We thus de-cided to use blank sky event lists provided by Dr Andrew Read (Birmingham University). Since no blank sky files are available for the THICK filter, we have used the event lists associated with the MEDIUM filter. We note that there is only a slight dif-ference between the THIN and MEDIUM filters in these blank sky files for the regions considered. We also checked that us-ing the MEDIUM blank sky for N11L and the extended X-ray emission to its north gives the same results as with a neigh-bouring background region. We thus have extracted blank sky spectra over the same detector regions as occupied by the dif-fuse emissions, then scaled these spectra to correctly subtract the fluorescence lines of the detector (this was only necessary once, for the MOS2 spectrum of LH9). To generate rmf and arf matrices, we used the SAS tasks rmfgen and arfgen using a detector map of the region to account for the source extension. Note that as these extended emission regions cover generally more than one CCD, the response matrices are still to be taken with caution in SAS v5.4.1. The spectra were then binned to reach a minimum of 20 cts per channel. As we did for point sources, we discarded noisy bins: below 0.4 keV and above 2 keV when the blank sky files were used or above 10 keV for N11L and the extended X-ray emission to its north. We list the parameters of the best-fit models in Table 5. Note that they are consistent with ROSAT determinations (Mac Low et al. 1998), but our new results have much smaller error bars.
4.1. Hydrogen Columns
One parameter of the spectral models, the hydrogen col-umn, can be estimated using H /CO surveys, nebular emis-sion, and stellar photometry. Rohlfs et al.5 (1984) measured
N(H ) of 1.8 − 2.4×1021 cm−2 in our XMM field-of-view,
while Schwering & Israel (1991) quoted 5.6×1020cm−2for the
Galactic absorption column. The contribution of H2 can also
be estimated using the strength of the12CO line (Israel et al.
1993) and a conversion factor N(H2)/I(12CO) of 1.3−1.7×10²⁰
cm−2 K−1 km−1 s. Israel et al. (1993) measured I(12CO) up to
18 K km s−1for N11B and 14 K km s−1 for N11C. They also 5 Note that Williams et al. (1999) wrongly quoted the value from
that paper, but this error did not affect their analysis since they finally used the H data from a high-resolution ATCA H survey.
gave values in the range 7 − 21 K km s−1 in the X MM field.
The minimum absorption column towards N 11 is thus 6×10²⁰
cm−2, while the maximum column could reach up to 1×1022 cm−2.
E(B−V) measurements (PGMW, Walborn et al. 1999) and Balmer decrements (Caplan & Deharveng 1986, Heydari-Malayeri & Testor 1985, Heydari-Heydari-Malayeri et al. 1987) pro-vide a second, independent estimate of N(H). With a galactic extinction of 0 − 0.15 mag towards the LMC (Oestreicher et al. 1995), gas-to-dust ratios of 5.8×1021 cm−2 mag−1 for the Galaxy (Bohlin et al. 1978) and 2.4 ×1022 cm−2mag−1for the LMC (Fitzpatrick 1986), we get the following reasonable esti-mates of N(H): 0.3−2×1021cm−2for LH9, 1−8×1021cm−2for LH10, 0.6 − 6×1021cm−2for LH13 or in general 0.3 − 8×10²¹
cm−2for sources actually belonging to N11. Combining all the
constraints derived in this section, we fitted again the spectra when necessary (see Table 5).
4.2. The SNR N11L
N11L is an optically faint nebula of diameter ∼15 pc at the westernmost part of N 11. It looks like a small filamentary bub-ble with a northeastern extension. With an age of 104yr, this SNR expands with a mean velocity of ∼200 km s−1(Williams et
al. 1999). The nonthermal radio emission of N11L is generally coincident with the Hα emission, but additional radio emission appears to the north of the main shell. ROSAT observations showed a rather faint X-ray source, compared to other LMC SNRs of similar size. It was cataloged as [SHP2000] LMC 13 or [HP99] 329. In our XMM-Newton observations (see Fig. 7), the X-ray emission is revealed in more details. It peaks more or less at the center of the shell, where the Hα (and radio) emis-sion are lower. The X-ray emisemis-sion is not completely confined to the Hα bubble: some X-ray emission is present just north of that bubble, where radio emission is also enhanced. In addition, we discovered UV emission from N11L in the data from the OM telescope. The UV morphology of the SNR is very similar to the one in the Hα line (see Fig. 8).
The X-ray spectra of N11L are well fitted by a simple ab-sorbed mekal model. The parameters from the best fit are given in Table 5, but another solution, with a slightly larger χ2, also exists, as can be seen in Fig. 9. Note that non-equilibrium mod-els (nei or gnei) do not give good fits to these data.
The ROSAT data suggested the presence of a large ‘plume’ of diffuse emission extending at least 5′ (or ∼70 pc at an LMC distance of 50 kpc) from the nebula. (Williams et al. 1999). This northern extension of diffuse X-ray emission is now clearly detected in the EPIC data of N 11. Compared to N11L, the spectral fit of this X-ray plume shows a similar tem-perature but a larger extinction. Note that its spectrum can also be fitted by a power-law, but that in this case the exponent Γ is exceptionally large. The physical relationship between N11L and the X-ray plume to its north is not clear. N11L may con-tribute to some of the hot gas in the plume region, but cannot be responsible for all of it, as the sound-crossing time (> 5 × 10⁵yr
for cS ∼100 km s−1) of this X-ray plume is much larger than the
Naz´e et al.: XMM-Newton observations of the giant H region N 11 in the LMC 9
Fig. 8. The SNR N11L at different wavelengths: left, DSS red image; middle, image acquired through the OM UVW1 filter
(λ0=2298 Å and ∆(λ)=439 Å) and right, image made in the OM UVM2 filter (λ0=2905 Å and ∆(λ)=620 Å).
Fig. 9. Left: The X-ray spectrum of N11L, shown along with the best fit absorbed mekal model, with N(H) = 0.43 × 1022 cm−2
and kT = 0.15 keV (see Table 5). The upper data ( dark grey) come from the EPIC pn camera, the lower ones from EPIC MOS (black for MOS1 data and light grey for MOS2). Right: ∆χ2contours for the mekal model: contours for 2D confidence levels of 68%, 90% and 99% are drawn. The cross indicates the model used in the fit of the left panel.
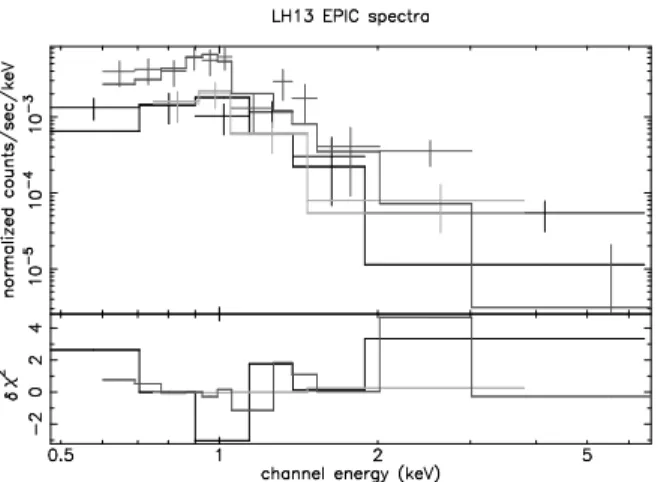
Fig. 10. The X-ray spectrum of the diffuse emission associated
with LH9, shown along with the best fit absorbed mekal model. EPIC pn data are shown in dark grey, EPIC MOS1 in black and EPIC MOS2 in light grey.
4.3. LH9
The X-ray emission inside the central shell surrounding LH9 is thought to correspond to hot, shocked gas within a superbub-ble blown by the cluster stars. The kinematics of this region is complex, with several velocity components along our line-of-sight. However, Rosado et al. (1996) found a general radial expansion velocity of ∼45 km s−1for this structure. The X-ray
emission peaks near HD 32228 (WC4+OB), where the most violent and complex gas motions are found.
This brightest emission region, roughly 80′′ in radius
around HD32228, fitted by the model derived for the whole region (see Table 5 and Fig. 10), presents an unabsorbed (i.e. corrected for the fitted N(H)) luminosity of ∼ 2 − 12×1035erg s−1 in the 0.1 − 2. keV range (ROSAT range). In this region,
15 (massive) stars were classified by Walborn et al. (1999) and 18 others by PGMW6. The contribution of the WC4 star to the
X-ray flux has been roughly estimated, since the X-ray emis-sion from WC stars is still under debate. Ignace & Oskinova (1999) have found that (binary) WC stars have X-ray luminosi-ties of ∼1.4×1032erg s−1. Pollock et al. (1995) measured X-ray
luminosities of ∼1×1032erg s−1(WR38) or lower for Galactic
(binary) WC4 stars, whereas following Oskinova et al. (2003), there has been up to now no conclusive detection of any sin-gle WC star. We adopt the highest value as an upper limit. For the other stars, we use LunabsX (0.1 − 2.)/LBOLempirical
relation-ships (Bergh ¨ofer et al. 1997) to estimate their X-ray luminosi-ties from the stellar photometric data published by PGMW and Walborn et al. (1999) and the bolometric corrections provided by Humphreys & McElroy (1984). For the massive star popula-tion surrounding HD32228, we then expect a total unabsorbed X-ray luminosity of ∼ 1.7 × 1033 erg s−1 in the 0.1 − 2. keV
range. This is at least 100 times lower than observed.
For the whole cluster (i.e. in the same region as the one shown in Fig. 6), the discrepancy is even larger, with a pre-dicted unabsorbed X-ray luminosity of ∼3×1033erg s−1 in the 0.1 − 2. keV energy range, for observations of 8 − 48×1035erg s−1. In addition, we have to consider the role of the metallic-6 [W99] 30, 89, 44 (the WC4 star), 62, 21, 84, 50, 41, 51, 68, 61,
72, 36, 87, 75, and PGMW 1052, 1110, 1125, 1160, 1194, 1200, 1239, 1288, 1292, 1303, 1310, 1321, 1342, 1343, 1350, 1357, 1365, 1377
ity of the LMC. A lower metallicity Z implies weaker winds, thus less X-ray emission will be produced, but the absorp-tion by the wind is also lower in this case. Using ROSAT data of Galactic O stars, Kudritzki et al. (1996) found that LX ∝( ˙M/v∞)−0.38×L1.34BOL, i.e. LX ∝Z∼0.3if we use the
depen-dences of ˙M and v∞on Z from Vink et al. (2001) and the rela-tionship between ˙M and LBOLfrom Howarth & Prinja (1989).
Our predictions of the stellar X-ray luminosity may thus be slightly overestimated, reinforcing the discrepancy with the ob-servations. An additional source of X-ray emission is clearly needed.
Shocked gas within the superbubble was suggested as the probable cause for this excess X-ray emission. Using the Weaver et al. (1977) model, Dunne et al. (2001) predicted an X-ray emission of ∼9×1034 erg s−1 for the superbubble
sur-rounding LH9. This reduces the discrepancy, but does not solve totally the conflict between observations and theoretical predic-tions.
With an age of only 3.5 Myr (Walborn et al. 1999), LH9 most probably still contains a lot of Pre-Main Sequence (PMS) stars. With the development of recent X-ray observatories, it is now a common occurrence to serendipitously detect PMS objects in the field of OB clusters (e.g. Rauw et al. 2002, 2003). Actually, the Classical and Weak Line T Tauri stars can present X-ray luminosities up to 1031 erg s−1. At the distance of the
LMC, these objects would not be resolved as individual sources and could therefore mimic a diffuse emission. Using an IMF
slope Γ of −1.6 (PGMW), we find that ∼ 104 PMS stars of
masses in the 0.2 − 2 M⊙range might be lurking in the cluster, thus contributing to the X-ray luminosity for a maximum 1035 erg s−1.
Another source of X-ray emission may come from a so-called ‘cluster wind’. For the Arches cluster, Cant´o et al. (2000) have estimated that stars may constitute only 10% of the X-ray emission, the hot intracluster gas being responsible for the rest. A similar process might be at work in LH9, result-ing in another increase of the X-ray luminosity. Off-center su-pernova explosions hitting the swept-up shell and/or collid-ing wind binaries in the cluster may also provide additional sources of X-ray emission. More observations are needed to determine the importance of these two processes: the presence of these supernovae could be revealed by e.g. observations of high-velocity UV absorptions (Chu & Mac Low 1990) whereas high-resolution spectroscopy of the binaries present in the clus-ter could enable to find the signatures of colliding winds inclus-ter- inter-actions.
Finally, we may note that soft X-ray emission is also present to the south of LH9 (see Fig. 1). This might indicate hot gas leaking out of the superbubble.
4.4. LH 10
With an age of ∼1Myr (Walborn et al. 1999), LH10 is the youngest cluster of N 11. Embedded in the bright nebula N11B, it contains several O3 stars, indicating that even the most mas-sive stars have remained intact and that no SN explosions should have occurred in this cluster yet. In this pristine
en-Fig. 11. HST WFPC2 image of N11B (see Naz´e et al. 2001)
superposed onto X-ray contours (same contours as in Fig. 7). The most important stars are labelled with their PGMW num-ber. Naz´e et al. (2001) found expanding regions near PGMW 3204/3209, PGMW 3120, PGMW 3070, and also possibly around PGMW 3160.
Fig. 12. The X-ray spectrum of the diffuse emission
associ-ated with LH10, shown along with the best fit absorbed mekal model. EPIC MOS1 are shown in black and EPIC MOS2 in light grey.
vironment, the stars did not yet have the time to blow a su-perbubble surrounding the entire cluster. Nevertheless, Naz´e et al. (2001) showed that smaller wind-blown bubbles around individual stars or small groups of stars are present, e.g. near PGMW 3209 and around PGMW 3070.
In this field, three X-ray sources have been de-tected: XMMU J045643.0−662504, 045646.1−662447, and 045648.3−662400 (see Fig. 11). The brightest one corresponds to the area near PGMW 3070 (O6V), a second source is close to PGMW 3120 (O5.5((f*)) ) and a last one is located to the north of these stars but is without any bright counterpart. Very faint diffuse emission is also detected near the optical pair PGMW 3209 (O3III(f*)+OB) and PGMW 3204 (O6-7V). All these correlate well with the positions of wind-blown bubbles found by Naz´e et al. (2001). Soft, extended emission is also present all over the cluster (see Fig. 1).
To investigate deeper the origin of these X-ray emissions, we focused on a region of radius 13′′centered on PGMW 3070. Using the models derived for the whole region encompassing LH10 (see Table 5 and Fig. 12), we found that this region pos-sesses an unabsorbed luminosity of ∼ 3.3 − 3.9×1033erg s−1
in the 0.1 − 2. keV range. On the other hand, following the same procedure as for LH9, we predicted an unabsorbed X-ray luminosity of ∼ 8×1032erg s−1 for all stars with known
spec-tral types in this small region (PGMW 3058, 3070, 3090, and 3073), i.e. a factor 4 below the observed value. For the whole LH10 (i.e. the same region as that shown in Fig. 6), the
emis-Naz´e et al.: XMM-Newton observations of the giant H region N 11 in the LMC 11 sion predicted is 5×1033 erg s−1, while the observed value is
∼2.2 − 2.6×1034erg s−1. The discrepancy is thus similar.
Without doubt, there is a source of X-ray emission in addi-tion to the massive stars themselves. Unlike LH9, hidden SNRs are very unlikely to contribute, since LH10 is much younger and even its most massive stars have not yet evolved. In addi-tion, the youth of LH10 implies that most PMS stars are still in their protostellar stages, where their X-ray emission is strongly attenuated by their parental molecular cloud. However, we note that the X-ray peaks are in regions where bubble expansion and some high-velocity motions have been discovered (Rosado et al. 1996, Naz´e et al. 2001): hot shocked gas may thus be an ad-ditional source of X-rays. But the peak emission also appears harder than the surrounding soft emissions (see Fig. 1). While there is certainly soft, extended emission in LH10 - maybe as-sociated with shocked winds inside a wind-blown bubble -, this is unlikely the only source of X-rays. A cluster wind and col-liding winds in binaries may also be partly responsible for the enhancement of the emission. The contributions of these differ-ent sources of X-rays should be disdiffer-entangled by future X-ray observations, ideally done with a high resolution and a high sensitivity, altogether.
5. LH 13
LH13 is situated to the east of LH9 and LH10. It is embedded in N11C, one of the bright nebular components of N 11, and con-sists of two compact stellar clusters, Sk −66◦41 and HNT, and several field stars. The ages of Sk −66◦41 and HNT have been estimated to ≤ 5 Myr and 100 Myr, respectively, suggesting a non-association between the two clusters (Heydari-Malayeri et al. 2000). The same authors proposed that the O stars surround-ing Sk −66◦41 may have been ejected from the cluster by dy-namical interactions.
Two X-ray sources are detected in LH13. The brightest one, XMMU J045744.1−662741 (source # 35) corresponds to
Sk −66◦41, while a fainter source, XMMU J045749.2−662726
(source # 36), does not seem to have any obvious counter-part (see Fig. 13). The HNT cluster is not detected: this is not totally surprising since the brightest stars in HNT are of spectral type later than A0 and they should thus emit less X-rays (if any). Predicting the X-ray luminosity of Sk −66◦41 is not easy, since only its global properties are known: spec-tral type (O3V ((f*))+OB, Heydari-Malayeri et al. 2000), V magnitude (11.72 mag, Heydari-Malayeri et al. 1987), extinc-tion (E(B−V)=0.11 − 0.22 mag, Caplan & Deharveng 1985, Heydari-Malayeri et al. 1987). Using the same relations as be-fore, we predict an unabsorbed luminosity up to 3×1033erg s−1
in the 0.1 − 2. keV energy range. This is slightly lower than the observed value LunabsX ∼7.5 × 1033erg s−1for the mekal
mod-els. The situation here is thus very different from LH9 since no large excess emission is detected. However, we note that the spectrum7 of this source is very noisy (see Fig. 14), and that
7 To avoid contamination from the nearby XMMU
J045749.2−662726 (source #36), we had to extract the spectra in a small region some 17.′′
5 in radius. A correction to the encircled energy loss is made via the option modelee = yes of the arfgen task.
Fig. 13. Close-up on the LH 13 cluster embedded in the N11C
nebula (same contours as in Fig. 7). X-ray point sources present in this field are labeled. The main clusters and early-type stars (Heydari-Malayeri et al. 2000) are also shown.
a deeper X-ray observation is needed in order to pinpoint the physical properties of the source. A detailed spectroscopic in-vestigation of the content of the cluster is also crucial to better estimate the expected X-ray emission.
It may seem quite strange that in the dense medium of N11C, the powerful massive stars in Sk −66◦41 have not blown any bubble. The observations of Rosado et al. (1996) do not show any expansion with v > 10 km s−1or expanding regions
of sizes > 2.2 pc. Using the Weaver et al. (1977) model, a density of 20 cm−3 (Heydari-Malayeri et al. 1987) and
typi-cal parameters of an O3V star, this lack of detection implies that either the bubble has R = 37 pc, corresponding to about 2.5′, and t = 2.2 Myr (so that v = 10 km s−1) or that the dy-namical timescale t is unrealistically short (t << 1 Myr) so that the bubble’s radius has not reached 1.1 pc yet. Using the former and more realistic physical parameters, we can deter-mine the expected X-ray luminosity of the hypothetical bub-ble, and we find ∼4×1035 erg s−1 (Chu et al. 1995), which is
clearly ruled out by our observations: the modest X-ray lumi-nosity of LH 13 is thus most probably due to the stars of Sk
−66◦41 alone. However, we may note that the extinction in N11C is not uniform, and may be rather large in some regions: Heydari-Malayeri et al. (1987) have actually detected extinc-tions E(B−V) up to 0.9 mag. Extended regions of hot gas with modest X-ray emission might thus be present in N11C, but the large extinction would prevent us from detecting them in our observation.
6. Conclusion
We report in this paper the observations by the XMM-Newton satellite of the giant H region N 11 situated in the LMC. In this field, we have detected large areas of soft diffuse X-ray
Fig. 14. The X-ray spectrum of source #35, which corresponds
to Sk −66◦41, shown along with the best fit absorbed mekal model. EPIC pn data are shown in dark grey, EPIC MOS1 in black and EPIC MOS2 in light grey.
emission and 37 point sources, one of which is apparently as-sociated with a small and poorly known extended object, BSDL 188.
N 11 harbours a wealth of phenomena associated with mas-sive stars: it contains a SNR, N11L, and four OB associations at different stages of evolution and interaction with their sur-roundings (LH9, LH10, LH13 and LH14). All are detected in the XMM-Newton data, except for LH14, which is unfortu-nately outside of the XMM-Newton FOV. The stars from LH9, the largest cluster of N 11, have blown a superbubble which is detected in X-rays as a large soft X-ray emission. It peaks near HD 32228, a dense cluster containing a WR star and sev-eral OB stars, and it is rather well confined within the Hα fila-ments delineating the superbubble. The combined emission of all individual massive stars of LH9 can not explain the high level of emission observed, nor can the contribution from the hot shocked gas of the superbubble as predicted by the Weaver et al. (1977) model. Hidden SNRs, colliding-wind binaries and the often neglected pre-main sequence stars most probably pro-vide additional X-ray emission. It is probably a combination of all these effects that will resolve the discrepancy, since an es-timation of the contribution of the latter alone has been shown insufficient to explain the whole X-ray emission. Moreover, we do not exclude that the superbubble is leaking some hot gas since faint, soft emission is detected to the south of the cluster. The action of LH9 on its surroundings has probably trig-gered the formation of a second cluster, LH10. The X-ray emis-sion from this younger cluster consists of three rather pointlike sources, in addition to a soft extended emission of reduced in-tensity. The two brightest sources are not centered on the most powerful stars of the cluster, i.e. the young O3 stars, but seem associated with the expanding bubbles blown by stars in the SW part of LH10 (Naz´e et al. 2001). The total X-ray emission of LH10 is four times larger than the total emission from its stellar components. Since the cluster is still very young, the ex-cess emission can probably not be attributed to hidden SNRs
or active T Tauri stars, but it probably originates from the hot gas filling the wind-blown bubbles. To completely understand the X-ray emission from these two clusters, disentangling the individual contributions (extended sources vs. a simple accu-mulation of non-resolved point sources) is of the utmost im-portance. However, this is not feasible in a reasonable amount of time with the current X-ray observatories, but N 11 will be a perfect target for the next generation of X-ray satellites.
In contrast, the X-ray emission from LH13 does not show any extended emission and could be well explained by the stars of the Sk −66◦41 cluster alone. To the west of the field, the SNR N11L shows hot gas outside the optical bubble, which is associated with an additional radio emission. The spectra of the SNR and of the extended X-ray plume to its north are similar, though with a larger absorbing column for the latter. For the first time, the SNR was also detected in the ultraviolet, and it presents at these wavelengths a morphology very similar to the optical one.
Note that the high excitation blob N11A is not detected in our observation, but this is not completely surprising since at least the theoretically expected X-ray flux from the stellar pop-ulation embedded in this nebula (Heydari-Malayeri et al. 2001) is very small.
During our X-ray observation, the OM camera onboard XMM-Newton has provided unique UV photometry of more than 6000 sources. This photometry is available to the scien-tific community through CDS.
Acknowledgements. Y.N. thanks Micha¨el De Becker and Hugues
Sana for their help and valuable discussion on the sources’ variabil-ity, and also Dr H. Dickel for a helpful discussion about CO obser-vations. I.I.A. acknowledges support from the Russian Foundation for Basic Research through the grant No 02-02-17524. We ac-knowledge support from the PRODEX XMM-OM and Integral Projects and through contracts P4/05 and P5/36 ‘Pˆole d’Attraction Interuniversitaire’ (Belgium). This publication makes use of data products from USNO B1.0, the Two Micron All Sky Survey and the Guide Star Catalog-II. The authors are grateful to an anonymous ref-eree for valuable comments that helped to improve our manuscript.
References
Bergh¨ofer, T.W., Schmitt, J.H.M.M., Danner, R., & Cassinelli, J.P. 1997, A&A, 322, 167
Bica, E.L.D., Schmitt, H.R., Dutra, C.M., & Oliveira, H.L. 1999, AJ, 117, 238
Bohlin, R.C., Savage, B.D., & Drake, J.F. 1978, ApJ, 224, 132 Cant´o, J., Raga, A.C., & Rodr´ıguez, L.F. 2000, ApJ, 536, 896 Caplan, J., & Deharveng, L. 1985, A&AS, 62, 63
Caplan, J., & Deharveng, L. 1986, A&A, 155, 297 Chu, Y.-H., & Mac Low, M.-M. 1990, ApJ, 365, 510
Chu, Y.-H., Chang, H.-W., Su, Y.-L., & Mac Low, M.-M. 1995, ApJ, 450, 157
Cohen, R.S., Dame, T.M., Garay, G., Montani, J., Rubio, M., & Thaddeus, P. 1988, ApJ, 331, L95
Dunne, B.C., Points, S.D., & Chu, Y.-H. 2001, ApJS, 136, 119 Evans, N.R., Sasselov, D.D., & Short, C.I. 2002, ApJ, 567, 1121 Fitzpatrick, E.L. 1986, AJ, 92, 1068
Haberl, F., & Pietsch, W. 1999, A&AS, 139, 277 ([HP99]) Henize, K.G. 1956, ApJS, 2, 315
Naz´e et al.: XMM-Newton observations of the giant H region N 11 in the LMC 13 Heydari-Malayeri, M., Niemela, V.S., & Testor, G. 1987, A&A, 184,
300
Heydari-Malayeri, M., Royer, P., Rauw, G., & Walborn, N.R. 2000, A&A, 361, 877
Heydari-Malayeri, M., Charmandaris, V., Deharveng, L., Rosa, M.R., Schaerer, D., & Zinnecker, H. 2001, A&A, 372, 527
Howarth, I.D., & Prinja, R.K. 1989, ApJS, 69, 527 Humphreys, R.M., & McElroy, D.B. 1984, ApJ, 284, 565 Ignace, R., & Oskinova, L. M. 1999, A&A, 348, L45
Israel, F.P., Johansson, L.E.B., Lequeux, J., et al. 1993, A&A, 276, 25 Kudritzki, R.P., Palsa, R., Feldmeier, A., Puls, J., & Pauldrach, A.W.A. 1996, in ‘R¨ontgenstrahlung from the Universe’, eds. Zimmermann, Tr¨umper, & Yorke, MPE Report 263, 9
Jansen, F., Lumb, D., Altieri, B., et al. 2001, A&A, 365, L1
Lawrence, A., Rowan-Robinson, M., Ellis, R.S., et al. 1999, MNRAS, 308, 897
Lucke, P. B., & Hodge, P. W. 1970, AJ, 75, 171
Lumb, D. 2002, ‘EPIC background files’, XMM-SOC-CAL-TN-0016 Mac Low, M.-M., Chang, T.H., Chu, Y.-H., Points, S.D., Smith, R.C.,
& Wakker, B.P. 1998, ApJ, 493, 260
Mason, K.O., Breeveld, A., Much, R., et al. 2001, A&A, 365, L36 Meaburn, J., Solomos, N., Laspias, V., & Goudis, C. 1989, A&A, 225,
497
Naz´e, Y., Chu, Y.-H., Points, S. D., Danforth, C.W., Rosado, M., & Chen, C.-H. R. 2001, AJ, 122, 921
Oestreicher, M.O., Gochermann, J., & Schmidt-Kaler, T. 1995, A&AS, 112, 495
Oskinova, L.M., Ignace, R., Hamann, W.-R., Pollock, A.M.T., & Brown, J. C. 2003, A&A, 402, 755
Parker, J. W., Garmany, C. D., Massey, P., & Walborn, N. R. 1992, AJ, 103, 1205 (PGMW)
Pollock, A.M.T., Haberl, F., & Corcoran, M.F. 1995, IAUS 163, 512 Rauw, G., Naz´e, Y., Gosset, E., et al. 2002, A&A, 395, 499
Rauw, G., De Becker, M., Gosset, E., Pittard, J.M., & Stevens, I.R. 2003, A&A, 407, 925
Rohlfs, K., Kreitschmann, J., Feitzinger, J.V., & Siegman, B.C. 1984, A&A, 137, 343
Rosado, M., Laval, A., Le Coarer, E., et al. 1996, A&A, 308, 588
ROSAT Consortium 2000a, ROSAT News 71, ”The ROSAT Source
Catalog of Pointed Observations with the High Resolution Imager (1RXH) (3rd Release)”
ROSAT Consortium 2000b, ROSAT News 72, ”The Second ROSAT
Source Catalog of Pointed Observations (2RXP)”
Royer, P., Manfroid, J., Gosset, E., & Vreux, J.-M. 2000, A&AS, 145, 351
Sana, H., Stevens, I.R., Gosset, E., Rauw, G., & Vreux, J.-M. 2004, MNRAS, in press
Sanduleak, N. 1970, Contr. Cerro-Tololo Obs., 89, 1
Sasaki, M., Haberl, F., & Pietsch, W. 2000, A&AS, 143, 391 ([SHP2000])
Schwering, P.B.W., & Israel, F.P. 1991, A&A, 246, 231 Str¨uder, L., Briel, U., & Dennerl, K. et al. 2001, A&A, 365, L18 Turner, M.J.L., Abbey, A., Arnaud, M., et al. 2001, A&A, 365, L27 Vink, J.S., de Koter, A., & Lamers, H.J.G.L.M. 2001, A&A, 369, 574 Voges, W., Aschenbach, B., Boller, Th., et al. 1999, A&A, 349, 389
(1RXS catalog)
Voges, W., Aschenbach, B., Boller, Th., et al. 2000, ROSAT All-Sky Survey Faint source Catalogue (RASS-FSC), Max-Planck-Institut f¨ur extraterrestrische Physik, Garching
Walborn, N.R., & Parker, J.W. 1992, ApJ, 399, L87
Walborn, N.R., Drissen, L., Parker, J.W., Saha, A., MacKenty, J.W., & White, R.L. 1999, AJ, 118, 1684
Weaver, R., McCray, R., Castor, J., Shapiro, P., & Moore, R. 1977, ApJ, 218, 377
White, N.E., Giommi, P., & Angelini, L. 2000, The WGACAT ver-sion of the ROSAT PSPC Catalogue, Rev. 1, Laboratory for High Energy Astrophysics (LHEA/NASA), Greenbelt
Williams, R.M., Chu, Y.-H., Dickel, J.R., Smith, R.C., Milne, D.K., & Winkler, P.F. 1999, ApJ, 514, 798