MIT LIBRARIES DUPL
Digitized
by
the
Internet
Archive
in
2011
with
funding
from
MIT
Libraries
DEWEY
Massachusetts
Institute
of
Technology
Department
of
Econonnics
Working
Paper
Series
Bidding
for Industrial Plants:
Does
Winning a
"Million
Dollar Plant"
Increase Welfare?
Michael Greenstone
Enrico
Moretti
Working
Paper 04-39
November, 2004
RoomE52-251
50
Memorial
Drive
Cambridge,
MA
02142
This
paper
can be
downloaded
without charge
from
the SocialScience
Research
Network
Paper
CollectionatMASSACHUSETTS
INSTITUTEIOF
TECHNOLOGY
Bidding
forIndustrial Plants:Does
Winning
a
'MillionDollar
Plant'Increase
Welfare?
Michael Greenstone
MIT, American
Bar Foundation and
NBER
Enrico
MorettiUniversity
of
California,Berkeley
and
NBER
November
2004
We
thank AlbertoAbadie, Michael Ash, HalCole,David
Card,Gordon
Dahl,Thomas
Davidoff, Michael Davidson,Rajeev Dehejia, Stefano Delia Vigna.Mark Duggan,
Jinyong Hahn, RobertHaveman, Vernon
Henderson, Ali Hortacsu,
Matthew
Kahn,Tom
Kane, Brian Knight, Alan Krueger, SteveLevitt,Boyan
Jovanovic,
David
Lee,ThereseMcGuire,
Derek
Neal,Matthew
Neidell.Aviv
Nevo,
John Quigley,KarlScholz,
Chad
Syverson,Duncan
Thomas
and seminar participants at Berkeley,Brown,
Chicago,Columbia, Illinois, Michigan,
NYU,
NBER
Summer
Institute. Rice. Stanford,UCLA,
Wharton, and Wisconsinforveryhelpful discussions.Adina
Allen,Ben
Bolitzer.JustinGallagher,Genevieve
Pham-Kanter,
Yan
Lee,Sam
Schulhofer-Wohl, AntoineSt-Pierre, and WilliamYoung
provided outstandingresearch assistance. Greenstone
acknowledges
generous funding fromtheAmerican Bar
Foundation.Bidding
forIndustrialPlants:Does Winning
a'MillionDollarPlant*IncreaseWelfare?
Abstract
Increasingly,localgovernments
compete by
offering substantial subsidiesto industrial plants tolocate within their jurisdictions. This paper uses a novel research design to estimate the local
consequences ofsuccessfully bidding for an industrial plant, relativeto biddingand losing, on labor
earnings, public finances, and property values.
Each
issue of Ihe corporate real estatejournal SiteSelection includesanarticle titled
"The
Million DollarPlant" that reports thecountywhere
a large plantchosetolocate(i.e.,the 'winner'), as well asthe
one
ortwo
runner-upcounties(i.e.,the'losers').We
usethese revealed rankings of profit-maximizing firms to form a counterfactual for
what would
havehappened
in thewinningcountiesintheabsenceofthe plant opening.We
find that the plantopeningannouncement
is associated witha1.5%
trend break in laborearnings inthenew
plant's industry in winningcounties, as well as increasedearningsinthesame
industryincountiesthatneighborthewinner.Further, thereis
modest
evidenceof increased expendituresforlocalservices,suchas public education.Property values
may
provide asummary
measure
ofthe netchangeinwelfare,becausethecostsandbenefitsofattracting aplantshould becapitalized into the priceofland. Ifthewinners andlosersare
homogeneous,
asimplemodel
suggeststhatanyrentsshould bebid away.We
findapositive,relativetrend break of approximately 1.1-1.7%in propertyvalues. Sincethe winners andlosers have similar
observables inadvance oftheopening
announcement,
thepropertyvalueresultsmay
be explained by heterogeneityinsubsidiesfrom higherlevelsofgovernment
(e.g.,states)and/or systematic underbidding.Overall, the results
undermine
the popularview
thatthe provision oflocal subsidies to attractlargeindustrialplantsreduceslocalresidents' welfare.
Michael Greenstone
MIT
Department
ofEconomics
50
Memorial
Drive,E52-359
Cambridge.
MA
02142-1347and
NBER
mgreenst@,m
it.eduEnricoMoretti
UniversityofCalifornia,Berkeley
Department
ofEconomics
Berkeley,
CA
94720-3880
and
NBER
• Introduction
Over
the past 30 years, stateandlocalgovernments
haveassumed
a greater responsibility foreconomic
development. For example,they frequently offer substantial subsidies tobusinessesto locatewithin their jurisdictions. Theseincentivescan includetax breaks,low-costor free land, theissuanceof
tax-exempt bonds,trainingfunds, theconstructionofroads, andother infrastructureinvestments.
These
policiesare controversial: local politicians andthe subsidized
companies
usually extol the benefits ofthese deals,whilecriticscomplainthatthey areawasteofpublicmonies.' Itisdifficult toevaluate these
competing
claims,becausethereis littlesystematicevidenceontheconsequences ofthesepolicies.^I'hetraditionalapproachtoevaluating policiesdesignedatattracting
new
plantsistocalculate thenumber
of jobs gained andthe costofthe taxbreaksawarded
to firms. For example, itiswidelycited thatMercedes
received a$250
million ($165,000 per job) incentive package for locating in Vance,Alabama,
theToyota
plant inGeorgetown, Kentucky was awarded $200
million($80,000 perjob)andBoeing
was
given$50million($100,000perjob)intaxabatementstolocates itscorporateheadquartersin
Chicago
(Mitol2001;Trogen
2002). This"accounting"approach produces eye-catchingstatistics,butithas
two
importantlimitations. First,these calculations aredone
ex-anteandare rarely verified ex-post.Second,and
more
fundamentally,thisapproachdoesnot offer aframework
fordetermining whetherthepoliciesincreaseordecrease welfare oflocal residents. Forexample,is
$165,000
perjobagood
dealforthe residentsof Vance,
Alabama?
Economic
theoryprovidesmixed
resultsonthisquestion, asemphasized
by Glaeser (2001) inarecent survey.'
On
theone hand,some models
suggestthatthe attraction ofnew
businesses generatespositive spillovers and/or increases producer surplus. In these cases, local subsidies
may
be welfareenhancingor, at least,neutral forlocalresidents.
On
the otherhand,there aremodels thatindicatethatlocal subsidies
may
reflectgovernment
officials' private interestsby providing for theirown
financialgainor satisfyingLeviathan goals. Inthese settings, local
government
officialsgrant subsidieswhose
coststolocalresidents are largerthanthe benefits
and
thereforereduceresidents" welfare.-Thispaperempirically assesses theconsequences forcounties ofsuccessfullybidding forlarge
industrial plants on county-level earnings, property values, and
government
finances.The
empirical'For example,arecent
front-pagearticleinthe
New
York Timesdescribes theexperienceofseveral localities thatprovidedgeneroussubsidies to attract largemanufacturing firmsinthe 1980sand 1990s and apparently obtained
limited benefits to the localeconomy.("PayingforJobsDoesn'tAlways PayOff,
New
York Times,November
10,2003).
"In arecentsurvey ofthe literature,Glaeser (2001) concludesthat,althoughlocationbased-incentives"seemtobea permanent partofthe urbaneconomic landscape, economists donotyet
know
why
these incentivesoccur andwhethertheyareinfactdesirable". FurtheraStandard
&
Poor's publicationstates,"Economic development warsofrecentyearshave not developeda sufficienttrackrecordtoassesstheirtruecost-benefit ratio"(Standard
&
Poor'schallengeisthat plantschooseto locate
where
theirexpectedprofits are highest,which
area functionoftheir location-specificexpectedfuture costsof production
and
anysubsidies.A
plant'sexpectedfuturecostsof productionina county
depend
onmany
unobservablefactors,includingthepresenceofa suitabletransportation infrastructure, the availability of workers withparticular skills, andthe local regulatory
environment.
These
factors are typicallydifficult tomeasure and
their relativeimportancevariesacrossplants based on plants' unobserved production functions. Similarly, the subsidies are likely to bea
functionofa
number
ofunmeasured
factors, includinganypotential spillovers andthedegreeoflocalpoliticians'malfeasance.
Heterogeneity in the factors thatdeterminevariationincostsof production andsubsidies across
countiesislikelytobiasstandardestimators.Validestimatesoftheimpact ofa plantopeningrequire the
identificationof a countythatisidentical to thecounty
where
the plantdecidedtolocateinboth expectedfuture production costs andthe factors thatdeterminesubsidies.
We
have little faith in ourabilitytoascertainand
measure
allthesefactors.As
a solution,we
rely onthe revealed rankings of profit-maximizing firmsto identify a validcounterfactual for
what would
havehappened
intheabsence ofthe plantopening.These
rankingscome
from thecorporaterealestate journal Site Selection,
which
includes a regular featuretitledthe"Million Dollar Plants" that describeshow
a large plantdecidedwhere
to locate.When
firms areconsideringwhere
toopen
a large plant, they typically beginby
considering dozens ofpossible locations.They
subsequently narrowthelisttoroughly 10sites,
among
which
2 or 3 finalistsare selected.The
"Million DollarPlants"articlesreport thecountythat the plant ultimatelychose(i.e.,the 'winner'), as well as theone or
two
runner-up counties (i.e.. the 'losers').The
losers are counties that have survived a longselection process, butnarrowlylostthecompetition.
Our
identifyingassumptionisthat the losersform
avalid counterfactual for thewinners,afteradjustmentfor differencesinpre-existing trends.
Even
ifthisassumption is invalid,
we
suspect that this pairwise sampling approach is preferable to the leadingalternativeof
comparing
winnerstothe other3,000U.S. counties.Consistent with our assumption,
we
find that beforetheannouncement
ofthe winner county, winning and losing counties have similar trends inwage
bill,employment,
per capitaincome
and employment-population ratio. Several other observablecharacteristics arealso similar.By
contrast,trendsinthewinningcounties tendtobedifferentfromtrendsinallother
US
counties. Notably inthe 8yearsbeforethe
announcement
ofthewinner,the trends inproperty valuesinwinning andlosingcountiesare virtually identical.
Under
the plausibleassumptionthatproperty marketsare forward-looking,thisfinding suggests that not only are winning and losing counties similar in the years before the
'
Seealsotheclassic Gates (1Q72) and Zodrovv and Mieszkowski (1986) papers ontax competitions andthe
annouiiceincnt. but theexpected Futurechanges in
economic
activitytliat arc capitalized intoproperty valuesare alsoex-antesimilar. Overall, these findings lend credibilitytotheidentifyingassumptionthatthe losersforma valid counterfactual for the winners.
The
primai7employment
resultisthat inthenew
plants' I-digitindustry thewage
billincreasedbya statisticallysignificant$16.8 millionper yearinwinningcounties (relativetolosingones)afterthe
opening
announcement
(relativetotheperiod before). Thisis1.5%
oftheaveragewage
billinthe plant's1-digitindustry inwinningcounties intheyear beforetheannouncement.
Taken
literally,thisimpliesthat sixyearslaterthe
wage
bill inthenew
plant's I-digitindustryisroughly$100
millionhigherduetothe plantopening thanpredictedbypre-existing trends.
We
also findevidence ofpositive trendbreaksinthetotal
wage
billinthenew
plant'sindustryincounties thatneighborthe winner.'These
resultsprovidesome
ofthe first ex-post estimates ofthe increase in localeconomic
activity due to the successfulattraction ofa large,
new
plantand indicate that thenew
activitydoesn'tcrowd
out existing activitylocally.
However, by
themselves,these findings are notinformativeaboutwhetherthesubsidiesincreaselocalresidents'welfarebecause theydonotaccountfor theircost. Directinformationonthe costofthe
subsidies is unavailable.
We
follow the stylizedRoback
(1982)model
and arguethatthe netwelfareeffectofattractinga plantwillbereflectedinproperty values. Thisisbecause propertyvalues capitalize
theincreased
economic
activityinthecounty(i.e.the benefitofthesubsidy)andtheincreaseinproperty taxes—or reductioninpublicservices— necessarytopayforthesubsidy(i.e.thecostofthe subsidy).'We
derive a simplemodel
that demonstrates that in the presence of bidding for plants bycounties,asuccessful bid
may
causeproperty values to increase,decreaseorremain unchanged.When
countiesare
homogeneous
andpoliticianssolelymaximize
residents' welfare,the successful attractionofaplantwill leaveproperty values unchanged. This is because countiesraise their bidsuntilthe costs
equalthe benefits
and
theyare indifferentaboutwinningor losing.When
countiesarenothomogenous
orifstatespayforpartofthesubsidy, the successful attractionofa plant
may
resultinincreasedpropertyvalues.This isbecausethecountythathas the mostattractivecharacteristicsor the largest contribution
fromstate
government
canbidlessthanthesecondbestcounty,andstillwin
theplant.Finallywhen
localpoliticians deriveprivate benefits fromgranting subsidies, they will overbid, and property values
may
decrease.
',',,,
.,, • , , .SeeHanson(1998)forevidencethat localshocksaffectneighboringjurisdictionsandthat this effect dissipates
withdistance.SeeChapter 2ofBartik(1991)forareviewofthe effectsofstateandlocaleconomic development programs on employmentandeconomic growth in localareas.
On
a related topic,Evans andTopoleski (2002)examinethe socialandeconomics consequencesoftheopeningofan Indiancasino.
'Gyourko andTracy
(1991)demonstratethatthe efficientprovisionof publicservicesiscapitalized into land.
They
Ultimately, the questionofthe effect ofsuccessfully attracting a planton property values isan
empirical one. Using a unique self-collecteddatafile,
we
find thatthesuccessful attraction ofa plantresultsinincreasedpropertyvalues. Specifically,
we
findthat inwinningcounties thereisa relativetrendbreakofapproximately 1.1-1.7%inannual property valuesaftertheplantopening announcement.Ifour model'sassumptionsare valid,thisfindingcan beinterpretedasanincreaseinwelfarefor localresidents.
Even
iftheassumptionsare notvalid,theproperty valueresults appeartoundermine
the popularviewthattheprovisionoflocalsubsidiesto attractlarge industrialplantsdecreaseswelfare.
The
finalpartof
thepaperestimates the effectofwinningaplantonlocalgovernment
finances.A
widespread concern abouttheprovision ofsubsidies isthat localgovernments pay for
them
bycuttingimportant services, such aseducation and police protection.'' Usingdata
from
theAnnual
Survey ofGovernments,
we
find that localgovernmentsinwinningcountiesexperiencedpositiveand roughlyequaltrendbreaksinrevenuesandexpenditures. Notably,thereisa substantial increaseineducationspending
and
no
changeinpoliceexpenditures. Overall, thereislittleevidenceofdeteriorationintheprovisionofvitalpublic servicesincountiesthat
win
'"MillionDollar"plants.We
want
toemphasize
thatthefocusofthispaperisthe credibleestimation oftheconsequencesfor acountyofsuccessfullybiddingfora
new
plant,relativetobiddingandlosing. Thereareanumber
ofrelated policyand/or welfarequestions,only
some
ofwhich
this papercanaddress. Forexample,theanalysis does not provide evidence on whether states or the nation as a
whole
benefit from taxcompetitions
between
local governments to attractnew
business. Further, it is not informativeabout whether individual counties should pursue industrialdevelopment
policies at all.However,
sincevirtuallyalllargeplantopenings inducetaxcompetitionsbetweenjurisdictions,the salientquestionfora
local
government
interestedinattractingone ofthese plants isnotwhethertobidatailbutwhat
aretheconsequencesofsuccessfully bidding.
The
analysisisstructuredtoinformthisveryquestion.The
paper proceedsas follows. Section1reviewsthe theoreticalexplanationsfortheprovisionoflocalsubsidiesby local
governments
to attractplantsandthedeterminantsofplants' location decisions.Italsoprovides a casestudyof
BMW's
decision tolocate anew
plantinSouth Carolinaandintuitivelydescribes our research design. Section II reviews the
Roback
(1982)model
inthecontext ofa plantopeningandpresentsastylized
model
ofcounties' decisionsto bidforaplantandthe effectof winningonproperty values. SectionIIIdescribes thedatasourcesandpresents
some
summary
statistics. SectionGlaeser (2001)emphasizestheimportanceofansweringthisquestionempirically,"Economistsneedtoestimate
whathappens
when
localitiesare deprivedofthemarginaldollar. Doesthislosslead toeliminatingvery valuableservicesor are fairlymarginalservices cutoff?" (pp.il-12).
Ifoutcomesincountiesthatbidandlosearesimilartocountieswithoutindustrialdevelopmentpolicies,thenthe analysissheds lighton the broader question of the consequencesof whetherindustrial development policies are
IVexplains theeconometriciikhIcI andSection
V
describes theresults. SectionVI interpretsthe resultsand VI1concludes.
I.Local
Subsidy
and
PlantLocation DecisionsThissectionisdivided into
two
parts.The
firstreviewstheexisting theoretical literatureonwhy
local
governments
use incentives to atti'actsome
plants to tiicirjurisdictions.The
second subsection providesa casestudyofBMW's
decision tolocate acarassemblyplant in theGreenville-Spartanburgareaof northwestern South Carolinaand,
more
generally,describes the intuitionof ourresearch design.A.
Why
do
LocalGovernments
Offer SubsidiestoSome
New
Plants?In standard models, the provision ofincentives to firms reduces the welfare ofa locality's
residents.^ Thisisbecausethe incentives lead to inefficientlyhighlevelsoflocalproduction. Yet,inthe
real world, large businesses frequently receive subsidies inexchange for their location decision.
The
implicationisthat thestandardmodels
may
be unabletocaptureanimportant featureof
these locationdecisions. Here,
we
reviewa recentlineofresearch thatprovidesanumber
ofpossibleexplanations forwhy
localities provide incentivestonewly
locating firms. This reviewaimstohighlightsome
ofthe"structural"forces that are likelytounderlieour "reduced-form"estimatesofthewelfareconsequences of
successfully attracting aplant.
The
firstsetoftheoriesemphasizesthe idea that localgovernments aim
tomaximize
only thewelfare oftheir residents.
One
example
isthe casewhere
agglomerationeconomies
areassociatedwiththelocationofthe firm. For example,finnsinthe
same
industrymay
experienceproductivity increasesasthe
number
or sizeof geographically concentrated firms increase(Henderson 2003; Garcia-Milaand
McGuire
2001).These
spilloversmay
beduetothe sharingofinformation, thenumber
of highskilledworkers (Ranch 1993; Glaeseretal. 1995; Moretti
2004a
and 2004b),or that thenew
firms willattractother firmsinthe future. Regardlessoftheirsource,inthepresenceofthese spillovers,localities willbid
to attractthefirms thatproduce
them
andthe resulting subsidiesallowthefirmtocapturethe spilloversthatthey produce.
Glaeser (2001) suggeststhatlocal incentives
may
represent bids bycommunitiesto attract firmsthat will generate producersurplus for the current residents ofthe
community.
Conventional welfareanalysissuggeststhatthere
may
be welfaretriangles tobegainedby localworkers. In particular,ifthe'
SeeWilson(1999)for areview ofthe theoretical literaturesontax incentives.
'
laborsupply curve is
upward
sloping,inframarginal workersaremade
betteroffbythe presence ofthenew
firm.The
sizeofthe bids willreflectthewelfaregains generated.'"Another
explanationfortaxincentivesisthattheseupfrontpayments
arecompensationforfuturetax
payments
(Wilson 1996). In particular,oncea plant beginsto operateata siteitcan be costly tochangeitslocation,becauseofthe"sunk" nature of
many
industrialinvestments(seee.g.,Goolsbee
and Gross2000
andRamey
and Shapiro 2001).The
resultingimmobilitymakes
firmseasytargets for localtax collectors. Sinceitisdifficult for
governments
tocrediblycommit
inadvancetofuture taxrates,theupfront tax incentives
compensate
firms for future expropriation.Allofthe previoustheories areconsistentwith local politicianssolelyacting inthe interestsof
theircitizens,but an alternative
view
isthatlocal incentivesare dueto corruption and influence or adesire on the politician's part to
maximize
the size ofgovernment. In the case ofcorruption andinfluence, theside-payments
may
occur throughdirectpayoffs,contributionstore-election campaigns,orfuture
employment
for politiciansortheir friends or family (Glaeser2001).The
magnitude ofthesebribes will
depend
on
theprobability ofdetection and the punishment.An
alternative possibility isderived fromthe Leviathan
view
ofgovernment
(Brennan andBuchanan
1980).As
applied tothiscase,politicianswillseekto
maximize
thewelfareoftheircitizensandthe sizeofgovernment
or the tax base.Forthepurposesof ourpaper,itisworth notingthatthefirstsetof
models— where
localsubsidies aremotivated by agglomerationeconomies
or increasesinproducersurplus orcompensationforex-postexpropriation--suggest that subsidies
may
be welfareenhancing or,atleast, neutral forlocal residents.(We
willshow
laterunderwhat
conditionssubsidiescan be welfareenhancingorwelfareneutral.)The
secondsetof
models— where
localsubsidiesreflectgovernment
officials' private interests—suggestthatsubsidies
may
be welfaredecreasing.We
returnto thispointinSection II,where
we
incorporatethesetwo
alternativeviewsinasimpletheoreticalframework.B.
A
Case Study
oftheBMW
PlantLocation
Decisionand
aNew
Research
DesignInthissubsection,
we
use a concreteexample
to illustratehow
aparticularfirmselected asiteforits
new
plant. Inparticular,we
useinformation fromthe"Million DollarPlant""seriesinthecorporaterealestateJournal Site Selection to describe
BMW's
1992 decision to site a manufacturing plant in theGreenville-Spartanburgareaof SouthCarolina. Notably,thisis
one
oftheplantsinour sample.A
secondgoal ofthiscasestudyis tohighlight theempirical difficulties that arise
when
estimating the effectofplant openings on local economies. Further,
we
use this case study to informally explainwhy
ouritisalsopossiblethat the
new
firmgeneratesconsumersurplusforthe residents. The consumergainsarepossibleifthere are local marketsforoutputs(e.g.,sportsteams).Because
we
focusmainlyon manufacturingplants, thisresearchdesign
may
circumventthese identitlcation problems.A
more
formalanalysisisconducted in SectionII.Afteroverseeinga
worldwide
competitionand considering250
potentialsites foritsnew
plant,BMW
announced
in 1991 that they hadnarrowed
the listofpotential candidatesto 20 counties. Sixmonths
later.BMW
announced
thatthetwo
finalists inthecompetitionwere
Greenville-Spartanburg, SouthCarolina,andOmaha,
Nebraska.Finally,in1992BMW
announced
thattheywould
sitetheplantin Greenville-Spartanburgand thattheywould
receivea package ofincentives worth appioxiniately $1 15millionfunded bythestateandlocalgovernments.
Why
didBMW
choose Greenville-Spartanburg? Itseems
reasonable toassume
thatfirms areprofitmaximizers and chooseto locate
where
their expectationofthepresent discounted valueofthestream offutureprofitsisgreatest.
Two
factorsdeterminetheirexpectedfutureprofits.The
firstistheplant'sexpected future costsof production inalocation,
which
isa function ofthe location'sexpectedsupplyofinputsandthefirm'sproduction technology.
The
secondfactoristhepresentdiscounted value ofthesubsidyitreceivesatthesite.The
BMW
case provides arare opportunitytoobservethedeterminants ofthesetwo
keysite-selection factors. Consider first the county's expected supply of inputs. According to
BMW,
thecharacteristics that
made
Greenville-Spartanburgmore
attractive than the other250
sites initiallyconsidered were: lowuniondensity,asupplyofqualifiedworkers;the
numerous
global firms,including 58German
companies, in the area; the high quality transportation infrastructure, including air, rail,highway,andportaccess;and accesstokeylocal services.
For our purposes,theimportantpointto note hereis thatthese countycharacteristics are afirst
potential sourceofunobservedheterogeneity.
While
these characteristics are welldocumented
intheBMW
case,they aregenerallyunknown.
Ifthese characteristics also affect theoutcomes
ofinterest(i.e.,labor earnings, property values and countyfinances), astandard regression that
compares
Greenville-Spartanburgwith the other
3000
US
countieswillyieldbiasedestimatesoftheeffectofthe plantopening.A
standard regression will overestimate the effect ofplant openings on outcomes, if for example,countiesthathave
more
attractivecharacteristics (e.g.,better transportation infrastructure)tend tohavebetter
outcomes
(e.g.,higherearnings).Now,
considerthesecond determinant ofBMW's
decision, the subsidy.The
BMW
"Million Dollar Plant" article explainswhy
the Greenville-Spartanburg and South Carolina governmentswere
willingto provide
BMW
with$115
million insubsidies." According to local officials, the facility'saccountforopportunitycost).
As
apartofthis$2billion,the plantwas
expectedtocreate2,000directjobsandleadtoanother 2.000 jobsinrelated industriesbythelate 1990s.''
As
we
arguedinsubsection A, Greenville-Spartanburg's subsidy forBMW
may
be rationalized by the2000
"spillover" jobsindirectly created bythe
new
plant.As
anexample.Magna
International beganconstructionon an$80
millionplant that
was
toproduceroofs,side panels,doorsandothermajorpieces for theBMW
plantin1993.'^
It is notablethat
some
countiesmay
benefitmore
from a particularplant, depending on theirindustrialstructure,labor force skills,
unemployment
rateand
alltheother factorsthat affect spillovers.Forthis reason, the factors thatdeterminethetotalsizeofthe spillover(andpresumablythe sizeofthe
subsidy) represent a second potential source of unobserved heterogeneity. If this unobserved heterogeneity is correlated with outcomes, standard regression equations will be misspecified
due
toomittedvariables, just asdescribedabove. Forexample, ifcounties thathave
more
to gain intermsofspillovers(andtherefore offer
more
generoussubsidies) alsohave
betteroutcomes,thenaregression thatcompares
thewinners withtheother3000
US
counties willoverestimatethe effectofplantopeningson
outcomes.
Inorderto
make
validinferencesinthepresenceofthesetwo
formsofheterogeneity,knowledge
oftheexact form ofthe selection rule thatdeterminesplants' locationdecisions isgenerallynecessary.
As
theBMW
example
demonstrates, thetwo
factors that determine plant location decisions—
theexpectedfuturesupplyofinputsinacountyandthe
magnitude
ofthesubsidy—aregenerallyunknown
toresearchersandinthe rarecases
where
theyareknown
theyaredifficulttomeasure. Inshort,we
havelittlefaith inourabilitytoascertainand
measure
allthisinformation. Thus,the effectofa plantopeningis very likely to be
confounded
bydifferences in factors thatdeterminethe plants" profitabilityat thechosenlocation.
As
a solution to this identification problem,we
rely on the revealed rankings ofprofit-maximizing
firmstoidentify a valid counterfactual forwhat
would
havehappenedin theabsence oftheplantopening. In particular,the"MillionDollar Plants"articlestypically report thecountythatthe plant
chose(i.e.,the 'winner'), as well asits2"''choice(i.e.,the'loser'). For example,inthe
BMW
case,theloseris
Omaha,
Nebraska. Inthesubsequentanalysiswe
assume
that thewinning andlosingcounties areBen
Haskevv,chairman ofthe SpartanburgChamber
ofCommerce,
summarizedthe localviewwhen
hesaid,"Theadditionofthe
company
will furtherelevatean already top-ratedcommunityforJobgrowth"(Venable, 1992,p.630).
'"Interestingly,
BMW
laterdecidedtoopenasecondplantintheGreenville-SpartanburgareaandrelocateditsU.S.
headquartersfrom
New
JerseytoSouth Carolina.''
Althoughthe
Magna
Plantwasslated tohire300workers,stateandlocalgovernmentsonly providedabout $1.5million in incentives. Interestingly, the incentives offered to
Magna
are substantially smaller (even on aproportional basis) than those received by
BMW,
implying that local governments appear to be judicious inidentical in expected t'utiiie proHts. controlling for dilTcrcnccs in pre-existing trends. Although this assumption is unlikely to hold exactly,
we
suspect that this pairwise approach is preferable to usingregressionadjustmentto
compare
thewinnerstothe other3,000 U.S. counties or amatching procedurebased
on
observable variables.'' In Section V,we
present empirical evidence thatsuggests that thisidentifyingassumption
may
bevalid.II.
Laud
Pricesand Wellare
When
Counties
BidsforPlantsThissection presents asimple
framework
thatguidestheempirical analysisandhelpstointerpretthe resulting estimates.
One
ofthe paper'sempirical goalsisto testwhetherthe successful attractionofanew
plant affects housing prices.The
tlrst subsection presents a stylizedmodel
thatspecifiessome
assumptions under
which
thechange
in landvaluesinduced bytheexogenous
opening ofaplantcan beinterpreted as a
change
inresidents' welfare. Inthesecondsubsection,we
allowcountiestobid for plantsandspecify
some
assumptions aboutthebidding process.The
goalofthissubsection istoshow
underwhat
conditionsasuccessful bidfora plantwill result inhigher or lowerproperty values(andtherefore welfare).A.
Land
Pricesand Welfare
Here,
we
followthe stylizedRoback
(1982) model,which
isoftenused tomodel
firm locationdecisions.
We
assume
that individualsareperfectlymobile,haveidenticaltastesandafixedlaborsupply.Further,theyrentlandfor
homes
inthecountywhere
theywork. Allfirms areassumed
tohave constantreturnstoscaletechnologiesandthere isa fixedsupply oflandineachcounty.''^ Inequilibrium, firm's
unitcostsequalthe nationally determined productprice andindividuals' utilitycannot be increasedby
moving
toadifferentcounty.Now.
supposethatacountyisexogenouslv assigned anew
plant. This casemay
beunrealistic,butitisauseful startingpoint forexpository purposes. Importantly,allotherproducersandall workers
continuetochoosetheir location to
maximize
profitsandutility,respectively.The
openingofthenew
plantcauses landvaluesandnominalwages
to increase inthecounty.The
increaseinlandvalues occursfortworeasons. First,thenew
plantwilldirectly increase thedemand
through itslandpurchase and byincreasing the
number
ofworkerswho
need housing. Second,ifthere areagglomerationeconomies,thepresenceofthenew
plant will lowerthe costs of productionforother'*
Propensity scorematchingisan alternativeapproach(Rosenbaum and Rubin 1983). Itsprincipalshortcoming
relative toourapproachisitsassumptionthatthetreatment(i.e., winnerstatus)is"ignorable" conditional onthe
observables.As itshould beclearfromtheexample, adjustmentforobservablevariablesthroughthepropensity
scoreisunlikelytobesufficient.
firmsinthecounty. IntheparlanceofRoback,thisis referredtoas aproductive amenity. And,inthe
presence ofaproductive amenity,firmswill bidupthe priceoflandtogainaccesstothe spillovers. In
order to retainworkers,firms
must
pay higherwages
tocompensate
them
forthe higherrental rate ofland,sothatreal
wages
areunchanged. Thisisnecessary becauseinequilibriumworkers'utilitymust beconstantacrosscounties.
With
thisset-up,the increase in landvalues providesaone-timegaintoproperty ownersinthecounty that receives the
new
plant. This is the only change in welfare experienced by the county'sresidents. Thisis becausethe increasein
wages
isoffsetbythehigherprices thatworkersfacetorentland(e.g., forapartments/houses), leaving theirutility isunchanged. Further,thehigherrental rateof
landcounterbalancesanyspilloversavailable totlrms. Thus, undertheseassumptions,changesin land
values translateone-to-oneinchangesinresidents'welfare.
B.
A
StylizedModel
ofBidding
forPlantsand
Land
Values
In theprevious subsection, the opening ofa
new
plant increased property values becausewe
assumed
that the county does not have to incur any costs to attract the plant. In practice, localgovernments
frequentlyprovidesubsidiesinexchange
foraplant'slocationdecision. In thissubsection,andtheremainderofthe paper,
we
considerthe possibility that the3,000 U.S. countiescompete
forthenew
plantby
offeringsubsidiesor bids.We
assume
thatacounty'sresidents electamayor
thatacts as theiragenttobidto attractplantsto itsjurisdiction.
A
successful bid involves a trade-off for thecounty.On
theone
hand, subsidies arecostly to thecounty,because they involvetheprovisionofservicesand
may
reducethe futurestreamoftaxrevenues.
The
increaseinpublic services includes the special services for thenew
plant stipulatedbythe incentive
package
(e.g.,theconstructionofroads,or other infrastructureinvestments,taxabatements,job training funds, provisionof low-cost or free land, the issuanceof tax-exempt bonds, provision of
cheap electricpower, etc.), as well as the standardpublic services (e.g., garbage removal and police
protection).
We
assume
thatthecounty'sincentivepackageisfinancedby propertytaxes,so thatitscostiscapitalizedintoland values.'"
On
theotherhand,thenew
plant directly increases thelevelofeconomic
activity inthecounty,which
raisesthevalueofland.As
theBMW
case demonstrates,thepresenceofthenew
plantmay
alsoraisethevalueof landindirectlyby generatingspillovers, if,forexample, itattractsother plantsand/or
lowersthe costsof production forother plants. Thus, property values capitalizeboththe costs(i.e.,the
IntheAnnual Survey of Governmenisdata,property taxesaccountfor
49%
oftotalrevenuesfromown
sources.increasedpropertytaxesand/or reducedservices)and beneHts(i.e., tiie increased
economic
activity)ofattractingtiicplant.
Tiiissubsection's goal isto theoreticallyanalyze
when
thesuccessful attractionofa plant willincrease ordecrease property values (and therefore welfare) in the presence of county bidding.
We
denotepropeityvaluesasP,and
assume
thatthechangeinproperty valueslorthewinning county can be expressedas AP,,=
Vi|-
C,j. Vi,denotesthebenefitofnew
plantjforcountyi,anditiseqiiivalenttotheincreaseinpropertyvalues(intheabsence ofa subsidy).
The
sizeofthisbenefitisexogenous
andknown
tothecounty.
We
alsoassume
thatitisknown
toallthe othercountiesbiddingon
theplant.Cy
isthe costtothecounty ofthesubsidyprovidedtotheplant.Intherealworld,itisoften thecasethatthestatebears partofthecostofthe incentivepackage. In this case thetotal subsidy received by the plant is B,,
=
Cij + Sj,,where
Sy denotesthe state'scontribution.
We
assume
thatSisexogenous
tothecountyandisprovided bythe statetoaccountforthebenefitstoother countiesinthestate.
The
plantsaretheother sideofthistwo-sided matchingproblem andwe
assume
thatthey willlocateinthecounty
where
theirfutureprofitsaremaximized.As
describedabove,two
factorsdeterminetheirexpectedfuture profitsinagiven county:thesubsidyandtheexpectedfuture costsof productionin
thatcounty. Itislikelythatthereis heterogeneityinthe
maximum
subsidythat countiesare willingtooffer,
due
to differences incounties characteristics (recall Section I-B). In orderto obtain thehighestsubsidy,
we
assume
thatthefirmsconduct an Englishauction inthepresenceof independent,or private,values.
We
furtherassume
thatthereisnotanycollusioninthebiddingamong
counties.The
firm'schoicealsodepends onthe location-specific productioncosts. Itislikelythatthereisheterogeneityinaplant's valuationof a countyduetodifferences intheexpected supply offuture inputs.
Inthe
BMW
case,recallthese factorsincludedthepresenceofqualifiedworkers,thepresenceofGerman
companies
andair, rail,highway,andport access.We
denotethevaluetothefirmofallthese factors asZ,j.
A
higherZy implies thatproduction costsoffirmj are lower incounty i.We
assume
thatZ
isexogenous
tothecountyandisknown
toallcounties.We
alsoassume
each county hasrational expectations aboutthe plant'sproductioncostsinallother counties,(i.e.,Z,jforall i)andallother counties' bids(i.e.. B,,forall i). This assumption prevents
finns from increasing the subsidy that a count)' offers b\- exaggerating the benefits oflocating in a
differentcounty. If thisassumptionis incorrect, it
would
causecountiesto"overbid." Itisnotevidentwhy
such overbiddingwould
be an equilibriumstrategy.Overall, thetotalvalueforafirmoflocatingina particularcountyisthe
sum
ofthesubsidyandthe county-specific costadvantages. It
seems
reasonabletopresumethata plant will select thecounty1.
Homogeneous
Counties. Ingenera],counties differintheirvaluationsofanew
plant,Vy,andtiie plants' valuation ofthe county, Z,j. Here,
we
begin by considering the casewhere
counties arehomogeneous
inV
andZ: Vi,= Vq
andZjj=
Zqforall i. Thiswould
be thecaseifour keyidentifyingassumptionthatwinners andlosers are identical
were
valid.The homogeneity
caseisimportantbecauseinourempirical analysis,
we
willretainthehomogeneity
assumptionwhen comparing
winnersand
losers.Later,
we
analyzethemore
generalmodel
thatallowsforheterogeneityinV
andZ
toinvestigatehow
ourconclusions differ ifthis identification assumption is not valid.
Under
homogeneity,the firmsimply choosesthecountythatoffers the highest subsidy, B.We
considerfour cases.Case
J. This caseis the simplest.We
assume
thatthecounty'smayor maximizes
residents'welfare andthe stateprovides
no
subsidy (i.e.,S=
0).The
mayor
raisesthe biduntilsheisindifferentbetween
winning andlosing. Formally,theequilibriumbid,B*,isdetermined by(!)
B* = Vo
Consequently,
AP
= Vo
-
B* =
andthesuccessful attractionofthe plantdoesnotchangeland pricesor residents' welfare.Case
2.We
now
allowstatestosubsidizethe incentivesofferedtothe plant butretaintheotherassumptions. Itispossible that different states providedifferentlevelofincentives if,forexample,the
magnitude
ofspilloversinneighboring countiesdiffersacrossstates. Here, thecountythatreceives themost
generousincentivefromthe state willwin
thenew
plant.The mayor
ofthecountylocated inthemost
generousstatedoesnotneedto raisethe biduntilsheisindifferentbetween havingtheplantand
nothavingtheplant.
She
canwin
the plantby
settingthecounty'sbidatthepointthatmakes
themayor
ofthecounty with thesecond
most
generous statesubsidy indifferentbetween
winning and losing.The
optimalbid
B*
is(2)
B* = Vo +
S™,.,where
S,„;,^.|istheincentiveprovidedbythesecondmost
generousstate.Specifically, landvalues increase bythedifference betweenthe statesubsidy provided bythe
most
and 2"''most
generousstates:
AP
= Vq -
(B*-S|„.ix)=
S^ax -Sn.ax-i>0,where
S,„axistheincentiveprovided bythe
most
generous state. Importantly, thesource ofthe increase inhousingvalues istheheterogeneityinthestatesubsidiesandthecounty'scaptureofpartofthestatesubsidy.
Case
3.We
now
allowforthe possibility that themayor ma\
haveherown
goals. Inparticular,we
assume
themayor
benefits from a higher incentive package because opportunities forgraft orenlarging
government
are increasing inB.We
definethispersonal benefit asT
=
f(B),withf
>0: thehigherthe subsidy providedbythe
mayor
tothe firm, the larger thekickback.Due
toan exogenously determined probability ofdetection and punishment, themayor
choosesB
tomaximize
herutility U,>
0. Inthecasewhere
U2=
0,thereisnoprincipal-agentproblem andthemayor's andresidents'interestsare perfectly aligned. IfU2
>
0,themayor'sobjectivefunction includes residents'welfareaswell asherown
privategainfromthesubsidy. Forsimplicity,we
assume
thatU(AP,T)
isseparableinitsfirstandsecond
argument
andT
isafixed fraction yofthebid(i.e.,T
=
y B),where
<
y<
I. Thus,U
=
AP
+
yB.We
assume
Ut;<: but reinstate theassumptionthatstatesdonot subsidi/.c the bid(i.e.S=
0). Inthiscase,the
ma)or
raisesher bidtothepointthatmakes
herindifferentbetween havingtheplantandnothavingtheplant. Ifallthe
mayors
behaveinthesame
way,themayor's optimalbidis(3)
B*-Vo/(l-y)
In this case, the
mayor
overbids, by choosingB* which
is larger than the value ofthe plant to theresidents. Such overbidding causes landvalues inthe winning countytodeclinerelative to thelosing
county.
The
magnitude ofthedeclinedepends onthemayor's weight on herown
welfare:AP=
-(y/(1-y))
Vo <
0.Cose
4.When
U2 ^
andthereisa positive statesubsidy(i.e.,S,|>0),thechangeinland pricescannotbesigned.
The
statesubsidyincreases land values, asshown
aboveincase2,but theinclusionofthemayor's personal gain in the objective function results in adecrease in land values as in
Case
3.Depending
onthe magnitude ofthesetwo
effects, landvaluesmay
increase or decreaseinthe winnerrelativetotheloser.
'^
2.
Heterogeneous
Counties.Although
the key assumptioninourempirical analysisis thatthewinning and losing counties are
homogeneous,
it is important to understand the consequences ifthis assumption isnotvalid. Here,we
allowforheterogeneityincounties' valuationsofattracting the plant,V,andplants" valuations ofcounties, Z. Insection I-B,
we
usedtheBMW
example
toarguethattheeffectofthe plantopening could be
confounded
bythesetwo
sourcesof unobservedheterogeneityacrosscounties. Specifically,
we
suspect that a naive estimator that ignores the presence ofunobservedheterogeneitywillbebiased. This subsection formalizesthispoint.
Forsimplicity,
we
retaintheassumptionsthatS.j=
andUj=
0.IfV
andZ
vary across counties,the firmchooses
where
tolocatebasednotonlyonthebidB, but alsoon Z. Specifically,the valueforfirmj of choosing countyi isBii+Z,,.
Assume
for simplicitythatthere areonlytwo
levelsof V, highV
(Vh) and low
V
(Vl);andtwo
levelsofZ,highZ
(Zh)and low
Z, (Zl). Considerfirstthecasewhere
V
and
Z
are positively correlated,sothatthecounty with highV
alsohas highZ. Thus,one county willgainthe most fromattracting firmj andisalso theleastcost productionlocation forfirmj. Itsoptimal
bidissuchthatthecounty with
low
Z
and lowV
is indifferentbetween havingthe plantandnothaving(4)
B* =
Vl-(Zh-Zl).
In this case,thecountythat isthe best
match
enjoys a rent thatis capitalizedintoland values.Land
valuesincreaseby anamount
proportionaltothedifferenceinV
andthedifferenceinZ:AP
= (Vh
-Vl)
+
(Zh -Zl)>0. Importantly, the increaseinlandvaluesisduetotheunderlyingdifferencesinV
and
Z.
Consider
now
thecasewhere
V
andZ
are negatively correlated.County
1 hashighV
andlow
Z;whilecounty2hashigh
Z
and low V.IfVh+Zl >
Vl
+
Zh, county1 winsthe plantby bidding anamount
B*
thatmakes
county 2indifferentbetween havingthe plantandnothavingtheplant:(5)
B* =
V,.+ (Zh-Zl)
The
winner county enjoys arent thatiscapitalizedinland values,althoughthe rentislowerthan the rentinthecaseofpositive correlationbetween
Z
and V:AP
= (Vh
-Vl)-(Zh-Zl)>0.A
similarconclusionappliesif
Vh+Zl
<
Vl
+
Zh-In thiscasecounty 2isthewinner anditsland prices increasebyAP
=
(Zh-Zl)-(V|i-Vl)>0. Again,theheterogeneityisthesourceofthechangeinprices.'^
The
implications forourempirical analysis arediscussedfurtherintheeconometricssection.
III.
Data
Sourcesand
Summary
StatisticsA.
Data Sources
We
implement
thedesign usingdataon winning andlosing counties. EachissueofthecorporaterealestatejournalSite Selectionincludesanarticle titledthe"Million DollarPlants" thatdescribes
how
alarge plantdecided
where
tolocate."These
articlesalwaysreport thecountythatthe plantchose(i.e.,the'winner'),andusually report therunner-upcountyorcounties(i.e.,the "losers").""
As
theBMW
casestudy indicated,the
winner
andlosersareusuallychosenfrom
an initialsample of""semi-finalisf"sitesthat in
many
casesnumber more
than ahundred."'The
articles tendtofocusonlarge plants, and ourimpressionisthatthey providea representativesample ofall
new
large plantopeningsin theUS.The
articles usually indicate the plant's output,
which
we
use to assign the plant to the relevant 1-digitindustry.
In thiscase,theoptimalbidisB* =(Vo+S^m-i)/(l-y).The changeinlandpricesis
AP=
-(y/(1-y))Vo+
S^iK-(i/(i-y))S„,ax-,.
'^
Inthe unlikely casethat
Vh
+ Zl =Vl
+Zh,the twocounties areequivalent, and the winneris randomlydetermined.
In1985,thejournalIndiistiialDevelopment changedits
name
to Site Selection. Henceforth,we
refer toitas SiteSelection. Also,insomeyears thefeature ""MillionDollar Plants"wastitled"Location Reports."
"°
Insomeinstancesthe"Million DollarPlants" articlesdonotidentifytherunner-up county. For thesecases,
we
dida Lexis/Nexis searchforotherarticlesdiscussingthe plantopening and in 4caseswereabletoidentifythe
losingcounties. TheLexis/Nexis searcheswerealsousedtoidentifythe plant's industry
when
thiswasunavailableinSiteSelection.
"'
These
data havetwo
important limitations. First,the magnitude ofthe subsidy offeredby thewinning counties is in
many
cases unobserved and the bid is almost always unobserved for losingcounties. Thisisunfortunate,because aninterestingcheck ofthe validityof ourresearchdesign
would
betotestwhetherthe subsidies offered areequalinthewinning andlosing counties. Second,in
many
cases thearticlesdonot report theexpectedsizeoftheplant.In ordertoconductthe analysis,
we
collectedthemostdetailedand comprehensivecounty-leveldata available on
employment, government
finances, and property values available for theperiod from1970 through 1999.
The employment
datacomes from
theCensus
Bureau'sCounty Business Patterns(CBP)
datafile.These
annualdata report thenumber
ofemployees
andthetotalwage
billatthecountybyindustrylevel. Inordertoprotect the confidentialityoftherespondents,thesedata are"zeroed out"for
many
industry by countycells. Consequently,we
conduct ouranalysisatthe 1-digitindustryby countylevel."
The
CBP
data are usedto test whethera plantopeningisassociatedwithchangesinwage
billtrends in its industry, as well as other industries.
We
focuson
thetotalwage
bill rather than totalemployment
since thelattercannotdetectchanges intheskillcontentoflabor. Unfortunately, theCBP
does notreporthourly wages.
We
also test whether the successful attraction of a plant affects property values.^^We
areunaware
of anyexisting electronicfilesof annual county-level property valuedata,sowe
createdourown
county
by
year datafileon
property valuesfromtwo
sources. First,we
contactedallthestateand countygovernments
inour winnerandlosersamplesdirectlyand
requestedalltheir historicaldataon propertyvalues."''
These
data existbecause governments determinethevalue of propertyintheir jurisdictions for thepurposeof assessing propertytaxes. ,Second,
we
supplementedthese databyhand
enteringdatafromthe1972, 1977, 1982, 1987. and 1992Census of
Governments.Volume
2 TaxableProperty Valuesand
Assessment-Sales PriceRatios.The
censusesreportsmarket valuesintheyear beforeeach censuswas
conducted. In yearswhere
datawas
unavailable from both sources,we
estimated county-level property valuesbylinearly interpolating theCensus
ofGovernment
data,which
likelycausesthe true variationtobeunderstated.Forthepurposesoftheanalysis,
we
divide outputintothe5broad"1-digit" industriesdefinedbytheCBP
forwhich uncensored
wage
billdata areavailableinmostyears. Theseindustries are: Manufacturing; TransportationandPublicUtilities;Trade(Wholesaleplus Retail);Finance, Insurance,andRealEstate; Services. Atthis levelof
aggregation,1
7%
ofthecellsare"zeroed"out.^^
Ideally,
we
would havealsoexaminedthe effecton propertyrental rates,butwe
wereunabletofindasourceforannual or otherhigh frequencyrentaldata.
^''
We
attemptedtogetthisdatafortheprimarysample of 166countiesdatingbacktothe early1970s.
We
collectedatleast1yearofpropertyvalue datafrom 153counties. Ingeneral,thesegovernmentsdidnothavedatafromthe
earlier years. Forexample,
we
have nonmissing property value datefor68countiesin 1977, 102in 1980,149in1990,and153in1998.
One
limitationofthesedataisthatourmeasure of property valuesisthesum
ofthevaluesoflandandstructuresacross residentialandindustrial land.
The drawback
ofthismeasure
of property values isthatitwillinclude thevalueofthe
new
plants' structures,which
mechanically causesmeasured
propertyvaluestoincrease. Unfortunately,aseriesforland valuesonly isunavailablefor
many
ofthecountiesinoursample. Thisissueisdiscussed
more
extensivelyinthesubsequentdescriptionofthepropertyvalue results,butwe
note herethattheestimatedincreaseinpropeityvaluesappearstobesubstantially larger thanany reasonable estimate ofthemean
valueofnew
plants'buildings.Despite our extensive data collection efforts, the property value data are missing for
some
counties.
Our
preferredpropertyvaluesample
iscomprised of 30 ofthe82 winnersand62 ofthe 129losers.
The
DataAppendix
providesmore
detailsonthepropertyvaluedata.The
Amntal
Surveyof Governments:
FinanceStatistics Series(ASG)
is used todetermine thefiscal consequences for local
governments
ofnew
plant openings.The
ASG
is an annual survey ofgovernments
that asks detailed questions on governments' expenditures by function (e.g., education,administration,and publicassistance) and type(i.e., intergovernmentaltransactions, current operations,
andcapital outlays).
The
data alsocontains information on revenuesby
source, indebtedness, andcashandsecurities holdings.
We
aggregatethese datatothecounty level. This aggregation isdone
onthesample
of
governmentalunitsthataresurveyed continuouslyfrom 1970 through 1999so that the units areheld fixed. Inour "Million DollarPlant"
sample
of 166winningandlosing counties,150countieshaveatleast
one
governmental unitthat reportscontinuously.The
continuousreporterscomprise only12.5%
of all governmental units in these counties but account for approximately
75%
of revenues andexpenditures. Thisisbecauselarge
government
unitsaresampled withcertainty,while smallerunitsaresampled with "varying probabilities within an area,type ofgovernment, and size ordering" (Census
Bureau, 1990,p.1-1)."
B.
Summary
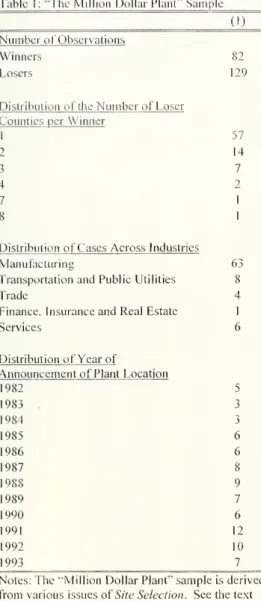
StatisticsTable1 presents
summary
statisticsonthesample ofplantlocation decisionsthatformthebasisofthe analysis.
The
firstpanel indicates thatinourprimarysamplethere are82separate plantopeningsand an average of1.6 losersperwinnerora totalof 129losers. Thereare 166countiesinthissample,so
According to the data documentation, the following governments are sampled with certainty: "all county
governments withapopulationof 50,000ormore, municipalgovernmentswithapopulation of25,000ormore;
townshipgovernmentinthe
New
England andMiddleAtlantic stateswith a populationof25,000ormore; schooldistrictswith an enrollment of 5,000ormore;andspecial districtswithlong-term debt outstanding of$10million,or
theaveragecounty appears roughly 1.3times.'"^
The
secondpanel reports the distributionofthe niuriber
oflosers per winner.
We
refer to the winner andaccompanying
loser(s) associated with each plantopening
announcement
asa "case." In 57 ofthe 82 cases thereis asingle loserand in 14there are2 losers.The
table alsoreveals that63 ofthe 82 plantswereinthe manufacturing industry. Thus, ouranalysisis
most
informativeabouttheconsequences ofattracting industrialplants.The
final panel liststhe distributionoftheyearofthe
announcement
abouttheplantopening. 22 ofthe plantopeningswere
announced
in1991 and 1992,suggestingthattheymay
be countercyclical. Appendi.x Table2 reports theidentityof eachplant,itsindustry,andthewinning andlosing counties.
Although
we
do
notknow
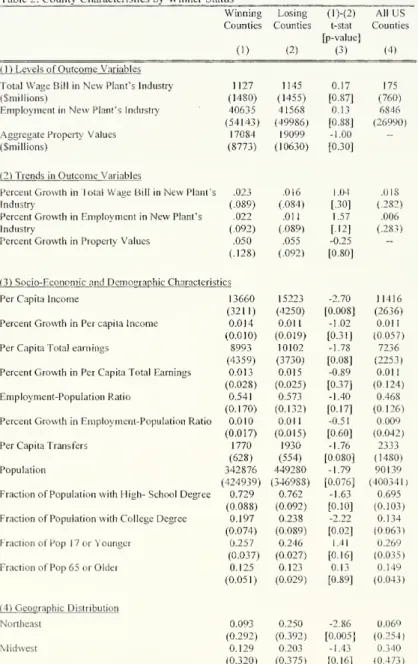
thedeterminants ofthecounties'valuationsofplants(i.e.,V,j)or theplants' valuations of counties (i.e., Z,j), Table 2 presents the
means
across counties ofsome
likelydetenninantsofthese variablesinthe threeyearsbeforethe
announcement
ofthe plantopening.These
means
arereported forwinners, losers, andthe entire U.S. incolumns
(1),(2), and (4),respectively.^'Column
(3) presents thet-statisticand p-value fromthetestthatthe entries in(1)and(2) are equal.We
e.xpectthatwinning andlosingcountiesaresimilar sothatanydifferencesin
columns
(!)and(2)willbesmall. Incontrast,
we
expectthat acomparison ofthewinners(or losers)withall U.S.countiesislikelytoproducelargerdifferences.
The
firsttwo
panelsreveal that thewinning andlosingcounties are similarinboththe levelsandpre-announcement
trendsoftheprimaryoutcome
variables. Specifically,thefirstpanelreportsthemeans
ofthree
outcome
variables inthe three yearsbeforetheannouncement
ofthe plantopening.The
mean
total
wage
billinthenew
plant'sindustryisapproximately $1,127millioninwinningcounties,compared
to$1,145 million in losing counties. Thisdifference is notstatistically meaningful andindicates that
there
were
similar levelsofactivityinthetwo
setsofcounties.The
countoffull-timeemployees
leadstothe
same
conclusion. In contrast,thecorrespondingfigures forall theUS
counties aremuch
smaller."^The
thirdrow
ofthispanel indicates thatthehypothesisofequivalentaggregate property valuesacrosswinning andlosingcountiescannot berejectedatconventionalsignificancelevels.
The
second panelcompares
trends in theoutcome
variables in the three years before theannouncement.
The growth
ratesinearnings,employment
andlandvaluesarenotstatisticallydifferentin"*
127 counties appearonceinthedata. 33 counties appear twiceand 6 countiesarepresent threetimes.Through
theentireempiricalanalysis,
we
exclude the 7 counties with populationsexceeding 2million. Inthesecounties,itwouldbedifficult todetecttheimpactofaplantopening.
"^Thelosing
countyentriesincolumn2 are calculatedinthefollowing manner. First,
we
calculate themean
acrossallthe losers for agivencase. Second,
we
calculate the overall loseraverageas theunweightedmean
acrossallcases sothateach caseisgiven equal weight.
"^Thefiguresin
thetoppanelofcolumn 4are aweighted averageforyears1982to1993, with weights proportional
to thenumber ofMillionDollar casesineach yearand industry.Thefigures inpanels2to5 ofcolumn4area
weightedaverageforyears1982to1993, with weights proportionaltothenumberof Million Dollar casesineach year(seebottomofTableIforthedistributionof cases acrossyears).
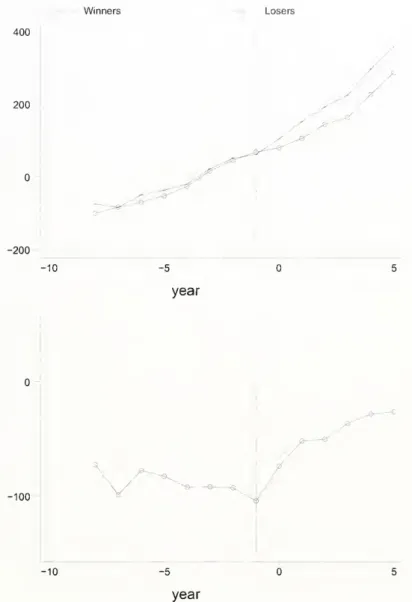
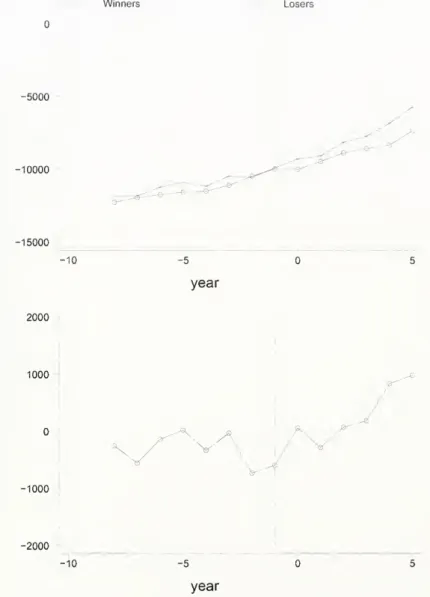
winning
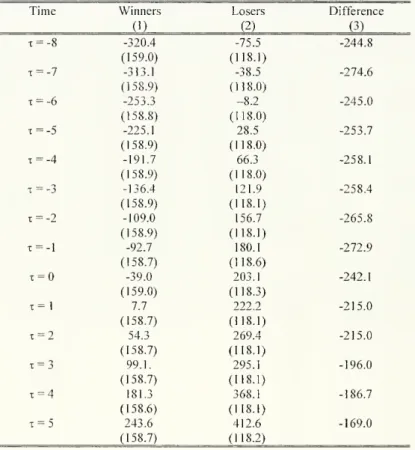
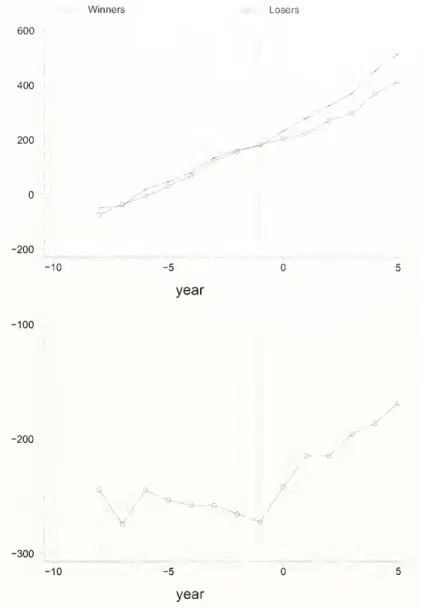
andlosing counties.We
return tothis issueinSection V,wiierewe
graphicallyshow
thatthetrends in
wage
bill,employment
and land valuesinthe 8yearsbeforetheannouncement
aresimilarinwinning and losing counties.For
now,
we
notethatthe findingthatboth the levelandgrowth rateof propertyvaluesissimilarinwinning
andlosing countiesisanespecially importanttestofthe validityofour research design, ifproperty markets are forward looking.
Under
the plausible assumption thatpropertymarketsareforwardlooking,this finding indicates that theexpectedfuturechangesinthe level
of
economic
activitycapitalized intoproperty valuesare alsoex-antecomparable. Overall, thefirsttwo
findingsprovidereassuringevidenceonthe qualityofthisresearchdesign
The
thirdpanel reportsmean
levelsand changes of socioeconomic anddemographic
variables. Ingeneral, the null hypothesis of equal
means
in winning and losing counties cannot be rejected withconventionalcriteria. Thisistrue bothfor the levelsofthe variables inthe 3 yearsprecedingthe plant
opening
announcement and
the percentgrowth
in those years for selected variables. There aretwo
important exceptions
where
thep-valueis .05orless:level of percapitaincome
andfractionofcollegegraduates.
However,
forthesetwo
variables,the losers"mean
is closerto thewinners'mean
thanisthemean
acrossallU.S.countiesincolumn
(4).Furthermore,forper capitaincome,the percentgrowthisnotstatisticallydifferentinwinners
and
loserscounties. Interestingly, there areimportantdifferencesbetween
all U.S. counties
and
thewinning
counties. In particular,the winners are richer,have a substantiallylarger population,ahigheremployment-populationratio,a bettereducatedpopulation,and fewer people
overtheageof65.
The
fourthandfifthpanelsshow
thegeographicdistributionofplantsacross the fourregionsoftheU.S.andtheindustry distributionofthelaborforcewithin the categories. Here,the
means
acrossthewinning and losing counties are not wellbalanced. For example,
66%
ofthewinnersareintheSouthcompared
to39%
ofthe losers. This is potentially problematic, since it suggests thattheremay
be unobserveddifferences(e.g.,uniondensity)across thewinningandlosing counties.This findingunderscores the valueof our identification strategy's reliance
on
comparisonsofchangesin
outcomes
between
winnersandlosers,ratherthan cross sectional comparisons. In thissettingcross-sectional differences willonlybiastheresults iflevelsofthese variablesdeterminefuturechanges.
This
would
bethecaseifforexample, uniondensity predictsgrowth inemployment
andproperty values.As
thenext section discusses,we
estimatemodels
thatincluderegionby yearfixed effectstoaccountforthe uneven distribution of
winner
and losers across regions.We
also estimate models on a restrictedsamplethatis limitedtocases
where
thewinner and losercounties areboth fromtheSouth.To
previewthe results, our findings are unaffected by these specification checks, implying that the geographic imbalance doesnotexplainourresults.
IV.
Econometric
Model
In lightofthe firm's selectionrule,thegoalistoestimate the causal effectof winninga planton
county-leveloutcomes. Thissectiondiscusses the 2-stepeconometric
model
usedto estimatethis effect.Inthefirststep,
we
fitthefollowingequation:17 17
(6) Y„c,
=
aic+Yj
'^wtW.ic,+
Yj
^liLijci+
Hi,+
iiut+£,.ic.,orT=-:9 t=-i9
17 17
(6') Y,„
=
ac+
Y.
":vvtWjcx+X
J^ltLjcx+
Ht+
%
+
^.ic„where
ireferences industry,j indicates a case, cdenotes county,andt indexesyear, xalsodenotesyear, butitisnormalized sothatforeach casetheyeartheplantopeningisannounced
ist=
0."'The outcome
variableinequation(6),Y.jct,istotalwages.
The outcome
variablein(6'),Y,^,, isacounty-levelmeasure
ofproperty'values or a
government
financevariable, ^ijciand^j^,are the respective stochastic errorterms.a,c (ttc) is a full set ofindustry x county (county) fixed effects that adjust for
permanent
differencesinthe interceptofthe
outcome
variables.These
accountforall fixedcounty characteristics.|i„ ([!,) isa vectorofindicators thatnonparametricallycontrols forindustryx year(year)effects. In
some
specifications the
sample
includes the entire U.S.,while in otherswe
restrict it toour "Million DollarPlant"sample of 166counties.
The
useofthesmallersample isequivalentto imposingthe restrictionthattheindustryxyear(year) effects arethe
same
inthe 166countiesandtheremainder ofthecountry.Hut(t1it) isasetofseparate fixed effects foreachofthecasesinteractedwith anindicator forwhetheri
>=
-8andt<=
5.We
restrictattention tothesevalues ofi,becausethe sampleis balanced overthisrange.
W,,eT and Wj^^^^are indicator variables. Wjjct(Wj^O equals 1 forobservationsonthe
new
plant'sindustr>' inwinning counties (the
new
plant's county)foragiven valueofi. L,|ct and Lj^taredefined analogously forlosing counties. Inthecaseswithmultiplelosers, thisindicatorvariablewillequal 1 forobservationsfrom multiplecountieswithinacase.
The
vectorsttv, and Klaretheparametersofinterest inthese equations.They
measuretheperiod-specific
means
ofthedependentvariablesinwinningandlosing counties, respectively,where
themeans
are conditionalonalltheindicatorvariablesdescribed above.
The
periodisdeterminedbytheyears since(oruntil)the plantopeningannouncement. Thus,the effectof