Publisher’s version / Version de l'éditeur:
Magnetic Resonance in Medicine, 61, 1, pp. 6-15, 2008-12-18
READ THESE TERMS AND CONDITIONS CAREFULLY BEFORE USING THIS WEBSITE. https://nrc-publications.canada.ca/eng/copyright
Vous avez des questions? Nous pouvons vous aider. Pour communiquer directement avec un auteur, consultez la première page de la revue dans laquelle son article a été publié afin de trouver ses coordonnées. Si vous n’arrivez pas à les repérer, communiquez avec nous à [email protected].
Questions? Contact the NRC Publications Archive team at
[email protected]. If you wish to email the authors directly, please see the first page of the publication for their contact information.
NRC Publications Archive
Archives des publications du CNRC
This publication could be one of several versions: author’s original, accepted manuscript or the publisher’s version. / La version de cette publication peut être l’une des suivantes : la version prépublication de l’auteur, la version acceptée du manuscrit ou la version de l’éditeur.
For the publisher’s version, please access the DOI link below./ Pour consulter la version de l’éditeur, utilisez le lien DOI ci-dessous.
https://doi.org/10.1002/mrm.21756
Access and use of this website and the material on it are subject to the Terms and Conditions set forth at
Implementation of three dimensional wavelet encoding spectroscopic
imaging: in vivo application and method comparison
Young, Richard; Serrai, Hacène
https://publications-cnrc.canada.ca/fra/droits
L’accès à ce site Web et l’utilisation de son contenu sont assujettis aux conditions présentées dans le site LISEZ CES CONDITIONS ATTENTIVEMENT AVANT D’UTILISER CE SITE WEB.
NRC Publications Record / Notice d'Archives des publications de CNRC:
https://nrc-publications.canada.ca/eng/view/object/?id=0aba0b57-9e5f-4f2c-8bfd-e10aad90218c
https://publications-cnrc.canada.ca/fra/voir/objet/?id=0aba0b57-9e5f-4f2c-8bfd-e10aad90218c
Implementation of Three-Dimensional Wavelet Encoding
Spectroscopic Imaging: In Vivo Application and Method
Comparison
Richard Young and Hacene Serrai*
We have recently proposed a two-dimensional Wavelet Encoding-Spectroscopic Imaging (WE-SI) technique as an alternative to Chemical Shift Imaging (CSI), to reduce acquisition time and crossvoxel contamination in magnetic resonance spectroscopic imaging (MRSI). In this article we describe the extension of the WE-SI technique to three dimensions and its implementation on a clinical 1.5 T General Electric (GE) scanner. Phantom and in vivo studies are carried out to demonstrate the usefulness of this technique for further acquisition time reduction with low voxel contamination. In wavelet encoding, a set of dilated and translated prototype functions called wavelets are used to span a localized space by dividing it into a set of subspaces with predetermined sizes and locations. In spectroscopic imaging, this process is achieved using radiofrequency (RF) pulses with profiles resem-bling the wavelet shapes. Slice selective excitation and refocusing RF pulses, with single-band and dual-band profiles similar to Haar wavelets, are used in a modified PRESS sequence to acquire 3D WE-SI data. Wavelet dilation and translation are achieved by changing the strength of the localization gradients and frequency shift of the RF pulses, respectively. The desired spatial resolution in each direction sets the corresponding number of dilations (in-creases in the localization gradients), and consequently, the num-ber of translations (frequency shift) of the Haar wavelets (RF pulses), which are used to collect magnetic resonance (MR) sig-nals from the corresponding subspaces. Data acquisition time is reduced by using the minimum recovery time (TRmin), also called
effective time, when successive MR signals from adjacent sub-spaces are collected. Inverse wavelet transform is performed on the acquired data to produce metabolite maps. The proposed WE-SI method is compared in terms of acquisition time, pixel bleed, and signal-to-noise ratio to the CSI technique. The study outcome shows that 3D WE-SI provides accurate results while reducing both acquisition time and voxel contamination. Magn Reson Med 61:6 –15, 2009.© 2008 Wiley-Liss, Inc.
Key words: discrete wavelet transform; wavelet encoding; spectroscopic imaging; chemical shift imaging
It is well established that by acquiring metabolic information, magnetic resonance spectroscopic imaging (MRSI) provides a unique modality to noninvasively study tissue metabolism in vivo (1– 6). This technique may provide early prognostic information, which aids in better understanding of tissue metabolism, differentiating between diseased and normal
tis-sue, improving treatment, and reducing risk to the patient. However, acquiring this metabolic information in several dimensions is time consuming, especially if the classical Chemical Shift Imaging (CSI) (7,8) technique is used.
To reduce acquisition time, several Fourier-based tech-niques that use modified high-speed imaging sequences have been proposed (9). Although these rapid techniques, like Echo Planar Imaging (EPI) (10) and spiral imaging (11), pro-vide metabolite information with high spatial resolution and good signal-to-noise ratio (SNR), they require complicated reconstruction methods to differentiate between spatial and spectral information, which leads to a spread of signal over both dimensions (12). Recently, a 2D non-Fourier encoding MRSI technique called wavelet encoding-spectroscopic im-aging (WE-SI) using a spin-echo sequence has been proposed as an alternative to CSI to reduce acquisition time and pixel bleed (13). Wavelet encoding has been used in magnetic resonance imaging (MRI) to reduce acquisition time and mo-tion artifacts (14,15). The technique is based upon the dis-crete wavelet transform that uses dilated and translated pro-totype functions, called wavelets, to perform a linear trans-formation from a space domain to a wavelet domain (16). This transform achieves a division of an input finite space function to a set of output subspaces with different sizes and locations. The wavelet dilation determines the size of the subspace, and the translation localizes its position. The num-ber of wavelet dilations, which sets the numnum-ber of transla-tions, is determined by the desired spatial resolution. Similar to Fourier, which performs an inverse Fourier transform on the k-space data to obtain the input spatial function, an inverse wavelet transform is performed on the subspaces (wavelet domain) data to achieve the same task (16). In prac-tice, WE-SI is similar to the Hadamard technique (17) be-cause it utilizes selective radiofrequency (RF) pulses with profiles resembling the shape of wavelets to excite the sub-spaces and acquire the corresponding magnetic resonance (MR) signals to fill the wavelet domain. The wavelet dilations and translations are achieved by changing the localization gradient strength and by shifting the frequency of the selec-tive RF pulses, respecselec-tively. Inverse wavelet transform is achieved on the collected wavelet domain data to obtain metabolite images. Data acquisition time is reduced by short-ening the recovery time (TR) to its minimum value (TRmin) in
the sequential excitations of predetermined adjacent sub-spaces (18). Although WE-SI is not as fast as the high-speed Fourier-based techniques cited above, it allows for further reduction in acquisition time if extended to three dimen-sions, and reduces pixel bleed in the resulting metabolite maps.
Institute for Biodiagnostics (IBD), National Research Council, Winnipeg, MB, Canada.
*Correspondence to: Hacene Serrai, Magnetic Resonance Research & Develop-ment, Institute for Biodiagnostics, National Research Council, 435 Ellice Avenue, Winnipeg, Manitoba, R3B 1Y6, Canada. E-mail: [email protected] Received 18 February 2008; revised 15 May 2008; accepted June 16, 2008. DOI 10.1002/mrm.21756
Published online in Wiley InterScience (www.interscience.wiley.com).
Magnetic Resonance in Medicine 61:6 –15 (2009)
In this article, we briefly describe in the theory section, the extension of the WE-SI from two to three dimensions with acquisition time reduction and SNR calculation, and illus-trate its implementation on a clinical 1.5 T GE scanner using a modified PRESS sequence. In the Materials and Methods section, we demonstrate the feasibility of 3D WE-SI in ac-quiring both phantom and in vivo 3D MRSI data. We show in the Results section that, compared to CSI, 3D WE-SI provides accurate quantification results while reducing acquisition time and preserving the spatial information better. As ex-pected, we observe a reduction in SNR with an increase in resolution. In the Conclusion section, we propose solutions to increase the SNR and improve data quality. We also plan to test the WE-SI technique at higher B0field to improve its
sensitivity and combine it with parallel imaging for further acquisition time reduction.
THEORY AND METHODS
As described previously (13), the WE-SI technique extended here from two to three dimensions, is derived from the dis-crete wavelet transform (DWT), which uses three couples of wavelet and scaling functions to encode a finite spatial func-tion f(x,y,z) in three dimensions, up to a given spatial reso-lution J (16). The wavelet function given by j,k共x兲
⫽ 2⫺j/ 2共2⫺j
x ⫺ k兲 and the scaling function, which obeys a similar relation j,k共x兲 ⫽ 2⫺j/ 2共2⫺jx ⫺ k兲, possesses two
parameters, the dilation or scale parameter, j, belonging to the set {j ⫽ 0,1,. . .,J ⫺ 1}, and the associated translation parameter, k, given by k ⫽ 2J⫺j⫺ 1. Due to their finite and variable support lengths, wavelet functions act on the input function, f(x,y,z) as localized filters and divide it into a set of localized subspaces with different sizes and positions. The size of each localized subspace is determined by dilating the support length of the wavelet, while its position is defined by spatially translating the wavelet function. For each localized subspace a wavelet coefficient is produced:
d1共j,k,l,t兲 ⫽冕
x,y,z j,k共x兲.j,l共y兲.j,t共z兲.f共x,y,z兲.dx.dy.dz, d2共j,k,l,t兲 ⫽冕
x,y,z j,k共x兲.j,l共y兲.j,0共z兲.f共x,y,z兲.dx.dy.dz, d3共j,k,l,t兲 ⫽冕
x,y,z j,k共x兲.j,0共y兲.j,t共z兲.f共x,y,z兲.dx.dy.dz, d4共j,k,l,t兲 ⫽冕
x,y,z j,k共x兲.j,0共y兲.j,0共z兲.f共x,y,z兲.dx.dy.dz, d5共j,k,l,t兲 ⫽冕
x,y,z j,0共x兲.j,l共y兲.j,t共z兲.f共x,y,z兲.dx.dy.dz, d6共j,k,l,t兲 ⫽冕
x,y,z j,0共x兲.j,l共y兲.j,0共z兲.f共x,y,z兲.dx.dy.dz, d7共j,k,l,t兲 ⫽冕
x,y,z j,0共x兲.j,0共y兲.j,t共z兲.f共x,y,z兲.dx.dy.dz, a共J,0,0,0兲 ⫽冕
x,y,z j,0共x兲.j,0共y兲.j,0共z兲.f共x,y,z兲.dx.dy.dz, [1]The wavelet coefficients above are used in the inverse wavelet transform to recover the input spatial function:
f共x,y,z兲 ⫽ Di⫽1⬊7共j,k,l,t兲 ⫹ A共j,0,0,0兲. [2]
where:
D1共j,k,l,t兲 ⫽冘
j⫽1 J冘
k⫽0 Nj⫺1冘
l⫽0 Nj⫺1冘
t⫽0 Nj⫺1 d1共j,k,l,t兲.j,k共x兲.j,l共y兲.j,t共z兲 D2共j,k,l,t兲 ⫽冘
j⫽1 J冘
k⫽0 Nj⫺1冘
l⫽0 Nj⫺1 d2共j,k,l,t兲.j,k共x兲.j,l共y兲.J,0共z兲 D3共j,k,l,t兲 ⫽冘
j⫽1 J冘
k⫽0 Nj⫺1冘
t⫽0 Nj⫺1 d3共j,k,l,t兲.j,k共x兲.j,0共y兲.j,t共z兲 D4共j,k,l,t兲 ⫽冘
j⫽1 J冘
k⫽0 Nj⫺1 d4共j,k,l,t兲.j,k共x兲.j,0共y兲.j,0共z兲 D5共j,k,l,t兲 ⫽冘
j⫽1 J冘
l⫽0 Nj⫺1冘
t⫽0 Nj⫺1 d5共j,k,l,t兲.J,0共x兲.j,l共y兲.j,t共z兲 D6共j,k,l,t兲 ⫽冘
j⫽1 J冘
l⫽0 Nj⫺1 d6共j,k,l,t兲.J,0共x兲.j,l共y兲.J,0共z兲 D7共j,k,l,t兲 ⫽冘
j⫽1 J冘
l⫽0 Nj⫺1 d7共j,k,l,t兲.J,0共x兲.J,0共y兲.j,t共z兲A共j,k,l,t兲 ⫽ a共J,0,0,0兲.J,0共x兲.J,0共y兲.J,0共z兲
[3]
The translation parameters k, l, and t are applied along x, y, and z axes, respectively.
To use wavelet encoding in MRSI, the desired number of voxels, N, is associated with the spatial resolution, J {N ⫽ 2J}, which sets the number of wavelet dilations, j, and conse-quently the number of translations, k (16). As stated else-where (13), selective RF pulses are used as wavelet functions in WE-SI sequence. They are appropriately represented when the profiles of the RF pulses are similar to their shapes, and their support length is equal to the frequency bandwidth (RF_BW) of the RF pulses. We have chosen Haar wavelets as prototype functions due to their simplicity in implementa-tion. The shape of the Haar scale function is a boxcar, equiv-alent to a unity vector, resembling the profile of a single-band selective RF pulse, and the shape of Haar wavelet function is a dual boxcar, which corresponds to the profile of a dual band selective RF pulse given by:
共x兲 ⫽
再
1 if 0 ⱕ x ⬍ 0,5 ⫺ 1 if 0,5 ⱕ x ⬍ 1
0 otherwise
[4]
Note that the Haar wavelet functions have a finite support in the interval [k/2j
, 共k ⫹ 1兲/2j]. Haar functions are used in
all directions when encoding the space with WE-SI. Because it achieves a volume selection, PRESS is the appropriate sequence for wavelet encoding in three dimensions. One single-band and one dual-band RF pulse for the excitation and the refocusing RF pulses are generated and inserted in the modified PRESS sequence (19). Translation and dilation
operations of the RF pulses are achieved similarly to the 2D WE-SI sequence (13). The slice thickness and the field of view (FOV) determine the gradient strength values in the three spatial directions. The number of voxels, N, in each direction sets the corresponding number of dilations (scale) J, and consequently, the number of translation steps Nj(Nj⫽ 2J⫺j}) for each scale value j. The RF pulse is dilated in each direction by multiplying the corresponding gradient strength value by the factor 2J⫺j, and translated by shifting its central frequency Njtimes according to [(⫺Nj⫹ 2k ⫹1)/2] RF_BW, where k runs from 0 to (Nj⫺ 1).
The MR signals corresponding to the wavelet coeffi-cients of Eq. [1] are acquired from the subspaces and used in Eq. [2] to recover the image information (13).
Figure 1 displays the modified PRESS sequence used for a 3D WE-SI technique with the wavelet parameters used to set the corresponding gradient and RF frequency shift values prior to RF pulse excitations. Acquisition time is reduced by shortening the TR time to TRmin following a
frequency shift of the RF pulses (wavelet translation). Timing in Wavelet Encoding
Due to the finite support of the wavelet functions, the RF pulses cover a part of the space (subspace) for each tation. Thus, if spins are experiencing the RF pulse exci-tation in a given subspace, those in the rest of the space are relaxed. By arranging the excitations in an optimal order, a
series of these subspace signals can be acquired without the need of a full TR time (Fig. 2).
Three different types of RF pulse combinations can be used in the 3D WE-SI depending on the desired spatial resolution (13):
1. The first eight wavelet encoding steps require eight TR times because the whole localized 3D space is covered and all spins are excited (Fig. 2A). These eight steps are always executed and set the minimum resolution to two in each direction.
2. The dual band excitation RF pulse is dilated and trans-lated, dividing the corresponding direction into adja-cent subspaces (Fig. 2B,C,D). MR signals from these adjacent subspaces can be acquired using TRmin. The 3D
WE-SI acquisition time is: Acq_time ⫽ 共N2
兲.共log2共N兲 ⫹ 1兲.TR, where N is the number of voxels.
3. The acquisition time in Figure 2B and C can be fur-ther reduced by interchanging the excitation RF pulse covering the whole space in a given direction (x, for example) with the dual band refocusing RF pulse covering a subspace in another direction (y, for ex-ample) (13). The acquisition time resumes to:
Acq_time ⫽ Nx.Ny.Nz.TR ⫺ Neff.共TR ⫺ TRmin), [5]
where Nx, Ny, Nzare the desired spatial resolution in x, y, and z, respectively, and Neffgiven by:
FIG. 1. The modified PRESS sequence and WE-SI algorithm: the wavelet translation and dilation parameters are calculated at each wavelet encoding step to set the sequence parameters: delay time, RF pulse frequency shift, and gradients values. [Color figure can be viewed in the online issue, which is available at www.interscience.wiley.com.]
Neff⫽
冋
22Mx.共M
z⫺ 2Mz⫹ 6兲/3 ⫹ 22My⫹1.共Mz⫺ 2Mz⫹ 5兲/3 ⫹ 2Mz⫹My⫹Mx⫹1⫺ 2.2Mx
⫹ 2My⫹Mx共M
y⫺ 2.Mz⫺ 8 ⫹ Mx兲 ⫹ 2My共 ⫺ 2.My⫹ 2 ⫹ 2.Mx兲 ⫺ 4/3 ⫺ P共x兲 ⫺ P共y兲
册
[6]is the number of times where the sequence is being exe-cuted using TRmin.
The following variables are set to: Mx⫽ log2(Nx), My⫽ logx (Ny), , Mz ⫽ log2 (Nz), P(x) ⫽ i .22(i⫺1), and P(y) ⫽ 2m.j.22(j⫺1), where i and j run from 2 to M
x, and My, respec-tively. If Mx⫽ My⫽ Mz⫽ M, Neffis simplified to:
Neff⫽ 关23.M⫹ 22.M共3.M ⫺ 8兲/3 ⫺ 4/3 ⫺ 3.P兴 ⫽ 关N3
⫹ N2共3.log共N兲 ⫺ 8兲/3 ⫺ 4/3 ⫺ 3.P兴. [7]
Signal to Noise in Wavelet Encoding
Similar to Fourier transform, which preserves the total energy of the signal for each frequency band, wavelet transform performs the same task for each scale or wave-let dilation (16). However, a decrease of SNR occurs in WE-SI at higher resolutions. This is confirmed by the reduction of the size of the excited subspaces (Fig. 2B,C,D) (13,20). As a consequence, the sensitivity in 3D
WE-SI compared to Fourier encoding drops by:
SNRWE-SI
FIG. 2. Case of a 4 ⫻ 4 ⫻ 4 WE-SI sequence: the excitation RF pulse profiles (single and dual band) are colored in black and applied along the z axis, the first refocusing RF pulse is colored in red and applied along the x axis; the second refocusing RF pulse is colored in blue and applied along the y axis. For each wavelet encoding step the corresponding excited region is colored in black. (A) Eight encoding steps are required with no RF pulse translations using eight TR times because the whole space is covered. (B) Twenty-four encoding steps are acquired in 12 TR and 12 TRminwith one RF pulse translation. In the upper slab the second refocusing RF pulse is dilated and translated and interchanged with the excitation RF pulse to allow acquisition time reduction. In the middle slab, the excitation RF pulse is dilated and translated with no RF pulse interchange. In the lower slab, the first refocusing RF pulse is dilated and translated and interchanged with the excitation RF pulse. (C) Twenty-four encoding steps are acquired in 12 TR and 12 TRminwith two RF pulses translated. In the upper slab both refocusing RF pulses are dilated and translated with RF pulse interchange between the excitation RF pulse and the second refocusing RF pulse. In the middle slab, the excitation and the second refocusing RF pulses are dilated and translated. In the lower slab, the excitation and the first refocusing RF pulses are dilated and translated. (D) Eight encoding steps are acquired in four TR and four TRmin. All the RF pulses are dilated and translated with no RF pulse interchange.
⫽ SNRCSI
冑
27.Nx.Ny.Nz 共4 ⫹ 2.Nx2⫹ 2.Ny2⫹ Nx2.Ny2兲 䡠 共Nz2⫹ 2兲 , which is approximated to SNRWE-SI⬇SNRCSI䡠 共3/N兲3/2 if Nx⫽ Ny⫽ Nz [8]MATERIALS AND METHODS
The 3D wavelet encoding SI scheme is implemented on a 1.5 Tesla whole-body GE clinical scanner. Using a GE head coil, both 3D WE-SI and CSI methods are used to acquire phantom and human brain data. Two types of excitation and refocusing RF pulses, single band and dual band, are used in the WE-SI sequence. The excitation RF pulses have
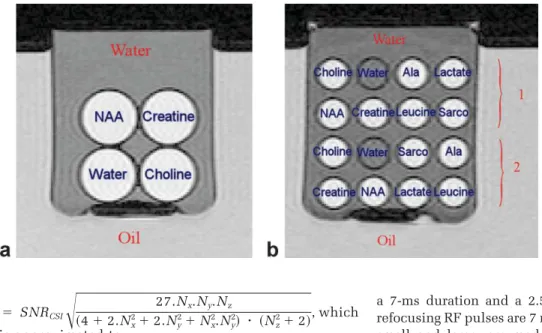
a 7-ms duration and a 2.5-kHz bandwidth, whereas the refocusing RF pulses are 7 ms and 1.5 kHz. Two phantoms, small and large, are made from two rectangular plastic holders containing equally spaced 2 ⫻ 2 and 4 ⫻ 4 holes, respectively. The sizes of the phantoms are 60 mm ⫻ 60 mm and 70 mm ⫻ 70 mm, with the diameters of the holes 25 mm and 14 mm for the small and large phantom, respectively. Cylindrical tubes filled with water solutions containing metabolites with known concentrations, are placed in the holes of the plastic holder, dropped in a container filled with pure water, and immersed in a cyl-inder filled with canola oil (Fig. 3). Two sets of phantom data, 2 ⫻ 2 ⫻ 2 and 4 ⫻ 4 ⫻ 2 are acquired using both WE-SI and CSI. The following acquisition parameters are
FIG. 4. Front axial slice of acquired metabolite spectra for the 2 ⫻ 2 ⫻ 2 WE-SI (A) and CSI (B). [Color figure can be viewed in the online issue, which is available at www.interscience.wiley.com.]
FIG. 3. Localization images of the 2 ⫻ 2 ⫻ 2 (A) and 4 ⫻ 4 ⫻ 2 (B) phantoms with metabolite loca-tions. [Color figure can be viewed in the online issue, which is avail-able at www.interscience.wiley. com.]
used: pulse repetition time (TR) ⫽ 2.5 s, echo time (TE) ⫽ 135 ms, 12 accumulations, 2.5-kHz bandwidth, 2K points, FOV ⫽ 60 mm and slice thickness ⫽ 30 mm.
Eight healthy volunteers, between 20 and 30 years of age, with signed consent forms obtained are scanned using both 3D WE-SI and CSI. Localization images are acquired first using gradient-echo sequence to determine the region of interest (ROI). Three sets of MRSI data with different resolutions using both WE-SI and CSI are acquired. The acquisition parameters are as follows: for the 4 ⫻ 4 ⫻ 4, TR ⫽ 2 s, TE ⫽ 135 ms, two accumulations, and effective time, TRminapproaching 850 ms; for the 8 ⫻ 8 ⫻ 2, TR ⫽
2 s, TE ⫽ 35 ms, four accumulations, and effective time of about 740 ms; for the 8 ⫻ 8 ⫻ 4, TR ⫽ 1.5 s, TE ⫽ 35 ms, and four accumulations. The FOV ranges from 74 mm to 80 mm and the slice thickness from 40 to 60 mm for the eight volunteers, resulting in a mean voxel size of 4.7 cc for the 4 ⫻ 4 ⫻ 4, 2.35 cc for the 8 ⫻ 8 ⫻ 2, and 1.2 cc, for the 8 ⫻ 8 ⫻ 4 resolution. The FOV and slice thickness varia-tion is due to the different sizes of the volunteer heads where body weights ranges from 60 kg to 118 kg. Acqui-sition bandwidth and data size are set to 2.5 kHz band-width and 1K points with 400-ms acquisition duration for all the acquired data. Lipid and water signals are sup-pressed using the standard saturation bands and frequency selective water suppression RF pulses. Data reconstruction is performed using SAGE software provided by GE for the CSI data and an in-house software using Matlab for the WE-SI data. A line broadening of 2.5 Hz is applied on all
acquired data before the quantification is performed using LC model.
RESULTS AND DISCUSSION
Phantom Results
Figure 4A,B displays the front slice spectra from a 2 ⫻ 2 ⫻ 2 WE-SI and CSI phantom data, respectively. Similarly, Figure 5A,B shows the front slice spectra of the 4 ⫻ 4 ⫻ 2 phantom data of the WE-SI and CSI, respectively. In terms of data quantification, WE-SI provides accurate results. Table 1 shows the estimated concentration values vs. the expected ones from the 2 ⫻ 2 ⫻ 2 WE-SI phantom data with insignificant amount of voxel contamination. Voxel contamination is calculated by dividing the amplitude of any metabolite detected in any voxel by its amplitude in the expected voxel. The obtained results for the front slice in the 4 ⫻ 4 ⫻ 2 WE-SI phantom data show that WE-SI keeps voxel contamination low (Table 2). Pixel bleed in WE-SI is attributed mainly to two reasons: the first reason is the inverse wavelet transformation in Eqs. [2] and [3], which uses the Haar wavelet and scale functions given by Eq. [4] and the unity vector, respectively (13). As shown in Figure 6, the areas of the bands of the RF pulses are not equal to the areas of the corresponding boxcars shown in red. This is mainly due to the large transition band and the edges of the RF pulse profile. To minimize the profile errors, we replaced in Eq. [3] the values of the Haar
func-FIG. 5. Front axial slice of acquired metabolite spectra for the 4 ⫻ 4 ⫻ 2 WE-SI (A) and CSI (B).
Table 1
Absolute Estimated Metabolite Concentrations vs. the Expected Ones with Voxel Contamination Calculations in the 2 ⫻ 2 ⫻ 2 WE-SI Data
Metabolite Voxel
NAA (mM) Creatine (mM) Choline (mM)
Estimated Expected Estimated Expected Estimated Expected
NAA 61.7 62.5 0 0 0 0
Creatine 0 0 49.2 50 0 0
Choline 0 0 0 0 29.1 30
FIG. 6. Profiles of the RF pulses (blue) used as Haar functions (red) in the WE-SI sequence. [Color figure can be viewed in the online issue, which is available at www.interscience.wiley.com.]
Table 2(1)
Percentage of Metabolites in Each Voxel in Arbitrary Units (a.u) from Part 1 of the 4 ⫻ 4 ⫻ 2 Phantom (Fig. 3B) Metabolite
Voxel Choline Alanine lactates NAA Creatine Leucine Sarcosine
1 Choline 100 0 0 0 0 0 0 2 Water 0 0 0 0 10 0 0 3 Alanine 0 100 0 0 0 0 0 4 Lactates 0 0 100 0 0 17 0 5 NAA 0 0 0 100 18 0 0 6 Creatine 0 0 0 2 100 0 0 7 Leucine 0 0 10 0 0 100 0 8 Sarcosine 0 0 0 0 0 0 100 Table 2(2)
Percentage of Metabolites in Each Voxel in Arbitrary Units (a.u) from Part 2 of the 4 ⫻ 4 ⫻ 2 Phantom (Fig. 3B) Metabolite
Voxel Choline Sarcosine Alanine Creatine NAA Lactates Leucine
9 Choline 100 0 0 0 0 0 0 10 Water 0 0 0 3 0 0 0 11 Sarcosine 0 100 0 0 0 0 0 12 Alanine 0 15 100 0 0 0 4 13 Creatine 0 0 0 100 12 0 0 14 NAA 10 0 0 0 100 0 0 15 Lactates 0 0 0 0 0 100 0 16 Leucine 0 14 0 0 0 0 100
tions (1 and ⫺1) by numbers obtained from the fit of the RF pulse profiles to boxcar shapes (Fig. 6). However, to better solve this problem we plan to use other wavelets with smoother decay and shorter duration (21). The second reason for voxel contamination is the cross-slice phase variation introduced by the frequency shift of the RF pulses. Because wavelet encoding is amplitude modula-tion, the RF pulses need to be perfectly aligned along with their application axis to produce phased MR signals (13). The frequency shift, introduces a deviation of the RF pulse from its application axis. This results in phase variation, referred to as slice walk in the acquired signal (22). To reduce the effect of this problem, we experimentally cal-culated the phase variation and manually corrected it, because no automatic phase correction in the operating system of the GE scanner is available (SIGNA LX 9.1). However, these manual corrections are not accurate enough, and are subject to a variety of effects including B0
and B1 field variations. With newer versions, the
cross-slice phase variation is better handled and automatically corrected. This is demonstrated by the results obtained from the small phantom vs. the large phantom. In the small phantom no RF pulse shift is performed, because the whole space to be imaged is covered. The results show an insignificant amount of voxel contamination (Table 1). In the large phantom, voxel contamination is more pro-nounced because of the frequency shifts of the RF pulses (Table 2).
Qualitative comparison of CSI results in Figures 4B and 5B show severe pixel bleed when compared to WE-SI. Voxel contamination, which depends on the point spread function (PSF), remains stable in WE-SI, whereas in CSI, it reduces with an increase of the spatial resolution. The PSF in WE-SI is a function of wavelet shape, and consequently, of the RF pulse profile (13,19). The spectral resolution in the acquired data for both WE-SI and CSI data is low, due
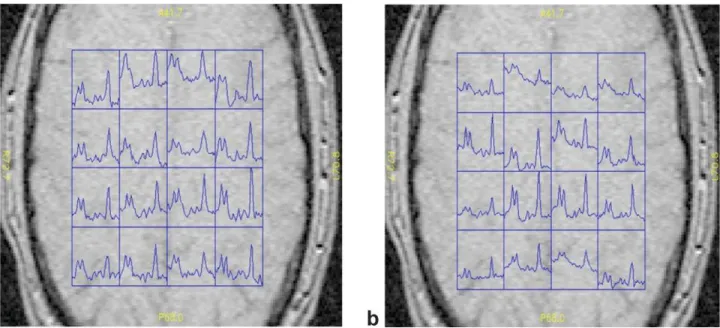
FIG. 7. In vivo spectra from the second axial slice of the 4 ⫻ 4 ⫻ 4 WE-SI (A) and CSI (B) data on the top of the gradient echo localization brain image. [Color figure can be viewed in the online issue, which is available at www.interscience.wiley.com.]
FIG. 8. In vivo spectra from the back axial slice of the 8 ⫻ 8 ⫻ 2 WE-SI (A) and CSI (B) data on the top of the gradient echo localiza-tion brain image. [Color figure can be viewed in the online issue, which is available at www. interscience.wiley.com.]
to the difficulties in improving B0field homogeneity when
using the phantoms (Figure 5A,B).
In Vivo Results
Figure 7 displays the second axial slice spectra from a 4 ⫻ 4 ⫻ 4 WE-SI and from CSI human subject data, respec-tively. Figure 8 displays the back axial slice spectra from an 8 ⫻ 8 ⫻ 2 WE-SI and from CSI human subject data, respectively. Similar relative quantification results of the metabolites are obtained. Table 3 shows the mean values and the standard deviations over all the voxels for the eight volunteers at each spatial resolution of the metabo-lites ratios of N-acetyl-aspartate (NAA) and choline peaks to the creatine peak. The proposed WE-SI technique pro-vides similar results at different spatial resolutions, whereas the CSI method provides higher NAA/creatine ratios at lower resolutions, which tends to decrease at higher resolutions (21). In Table 4, acquisition times are given for both WE-SI and CSI at different resolutions. WE-SI is quicker in acquiring MRSI data than CSI. The experimental acquisition times approach the calculated ones using Eq. [5].
As expected, the SNR is lower in WE-SI than CSI by a factor of 1.5, 2.7, and 3.2 in the 4 ⫻ 4 ⫻ 4, 8 ⫻ 8 ⫻ 2, and 8 ⫻ 8 ⫻ 4, respectively (Table 5). The SNR is calculated as the ratio of the NAA peak intensity and the standard deviation of noise. The SNR values are consistent with Eq. [8]. To increase the SNR in WE-SI, we are testing the so-called independent component analysis (ICA) tech-nique. The ICA uses higher statistical orders, in addition to the mean and the variance, to separate mixed observations collected from independent sources using different cap-tors (24). WE-SI fulfills these conditions because MR sig-nals are acquired from independent subspaces. We will also test other types of wavelets that possess better edge definition and better immunity to noise to compensate for the SNR loss (20,21).
CONCLUSIONS
A 3D wavelet encoding method for acquiring magnetic resonance spectroscopic imaging data is presented. The proposed WE-SI is compared here to the CSI, seen as a reference method, and offering a valuable indication of acquisition time, pixel bleed, and sensitivity. Previous results (13,18) along with the results shown here demon-strate that compared to the CSI method, wavelet encoding technique is able to reduce acquisition time while preserv-ing the spatial distribution of metabolites. The reduction in acquisition time is directly proportional to the spatial resolution and dimensions. Acquisition time could be re-duced with CSI using TRmin. However, this causes spin
saturation due to the long T1 of the metabolites (1–2 s for protons and 4 – 6 s for phosphorus), which bias the quan-tification results. The WE-SI method also collects data with high spectral resolution using just four RF pulses for space encoding, whereas the Hadamard SI technique ne-cessitates a different RF pulse for each row of the Had-amard matrix.
Wavelet encoding seems to suffer from low SNR com-pared to CSI. To increase the SNR, less spatially localized wavelets should be used (21).
To reduce data reconstruction artifacts, which are the main sources of pixel bleed, crossvoxel phase variation will be addressed in newer operating systems and a smoother wavelet basis that is less dependent on the ex-citation RF profile shapes should be tested. As a conse-quence, shorter RF pulses could be used and data with shorter echo times could be acquired.
To further reduce acquisition time, wavelet encoding-SI technique is being combined with the parallel imaging approach (25–28).
ACKNOWLEDGMENTS
This work is sponsored by NSERC-Discovery Grant NSERC RGPIN 327593-06. The authors thank Dr. Lotfi Senhadji of
Table 3
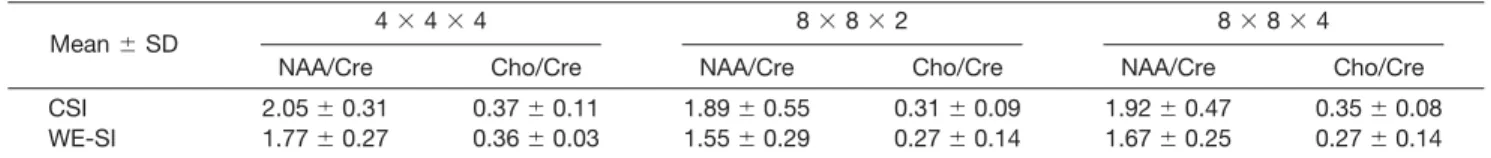
The Mean and Standard Deviation Values of the Relative Concentrations of NAA/Creatine and Choline/Creatine Ratios for Different Resolutions
Mean ⫾ SD 4 ⫻ 4 ⫻ 4 8 ⫻ 8 ⫻ 2 8 ⫻ 8 ⫻ 4
NAA/Cre Cho/Cre NAA/Cre Cho/Cre NAA/Cre Cho/Cre CSI 2.05 ⫾ 0.31 0.37 ⫾ 0.11 1.89 ⫾ 0.55 0.31 ⫾ 0.09 1.92 ⫾ 0.47 0.35 ⫾ 0.08 WE-SI 1.77 ⫾ 0.27 0.36 ⫾ 0.03 1.55 ⫾ 0.29 0.27 ⫾ 0.14 1.67 ⫾ 0.25 0.27 ⫾ 0.14 Concentrations from voxels with SNR ⬍⫽ 2 in the LC model are removed.
Table 4
Calculated and Experimental Acquisition Time Duration for Both WE-SI and CSI for Three Different Resolutions Acquisition Time 4 ⫻ 4 ⫻ 4 Experiment 4 ⫻ 4 ⫻ 4 Calculated 8 ⫻ 8 ⫻ 2 Experiment 8 ⫻ 8 ⫻ 2 Calculated 8 ⫻ 8 ⫻ 4 Experiment 8 ⫻ 8 ⫻ 4 Calculated CSI 256 s — 1024 s — 1536 s — WE-SI 186 s 182 s 556 s 560 s* 936 s 940 s
See text for sequence acquisition parameter values.
*The calculated time for the 8 ⫻ 8 ⫻ 2 is calculated from a 2D equation because the acceleration factor is activated in just two dimensions.
the University of Rennes1, France, and Dr. Robert Kraft of the Wake Forest University, Winston-Salem, NC, USA, for their helpful advice.
REFERENCES
1. Gruber S, Stadlbauer A, Mlynarik V, Gatterbauer, B, Roessler, K, Moser E. Proton magnetic resonance spectroscopic imaging in brain tumor diagnosis. Neurosurg Clin North Am 2005;16:101–114.
2. Hetherington HP, Kim JH, Pan JW, Spencer DD. H-1 and P-31 spectro-scopic imaging of epilepsy: spectrospectro-scopic and histologic correlations. Epilepsia 2004;45:17–23.
3. McKnight TR. Proton magnetic resonance spectroscopic evaluation of brain tumor metabolism. Semin Oncol 2004;31:605– 617.
4. Dhingsa R, Qayyum A, Coakley FV, Lu Y, Jones KD, Saanson MG, Carroll PR, Hricak H, Kurhanewicz J. Prostate cancer localization with endorectal MR imaging and MR spectroscopic imaging: effect of clini-cal data on reader accuracy. Radiology 2004;230:215–220.
5. Graves EE, Nelson SJ, Vigneron DB, Vignerson DB, Verhey, L, McDer-mot M, Lawson D, Chang S, Prados MD, Dillon WP. Serial proton MR spectroscopic imaging of recurrent malignant gliomas after gamma knife radiosurgery. AJNR Am J Neuroradiol 2001;22:613– 624. 6. Kurhanewicz J, Swanson MG, Wood PJ, Vigneron DB. Magnetic
reso-nance imaging and spectroscopic imaging: improved patient selection and potential for metabolic intermediate endpoints in prostate cancer chemoprevention trials. Urology 2001;57:124 –128.
7. Brown TB, Kincaid BM, Ugurbil K. NMR chemical shift imaging in three dimensions. Proc Natl Acad Sci 1982;79:3523–3526.
8. Maudsley AA, Hilal K. Spatially resolved high resolution spectroscopy by four dimensional NMR. J Magn Reson 1983;51:147–152.
9. Pohmann R, vonKienlin M, Haase A. Theoretical evaluation and com-parison of fast chemical shift imaging methods. J Magn Reson 1997; 129:145–160.
10. Posse S, Gioacchino T, Risinger O, LeBihan D. High-speed 1H spectro-scopic imaging in human brain by echo-planar spatial-spectral encod-ing. Magn Reson Med 1995;37:644 – 650.
11. Adalsteinsson E, Irarrazabal P, Topp S, Meyer C, Macovski A, Spielman DM. Volumetric spectroscopic imaging with spiral-based k-space tra-jectories. Magn Reson Med 1998;39:889 – 898.
12. Hanson LG, Schaumburg K, Paulson OB. Reconstruction strategy for echo planar spectroscopy and its application to partially undersampled imaging. Magn Reson Med 2000;44:412– 417.
13. Serrai H, Senhadji L. Acquisition time reduction in magnetic resonance spectroscopic imaging using discrete wavelet encoding. J Magn Reson 2005;177:22–30.
14. Healy DM, Weaver JB. Two applications of wavelet transforms in magnetic resonance imaging. IEEE Trans Info Theory 1992;38:840 – 860.
15. Panych LP, Jakab PD, Jolesz FA. Implementation of wavelet-encoded MR imaging. J Magn Reson Imag 1993;3:649 – 655.
16. Daubechies I. Ten lectures on wavelets. In CBMS-NSF lectures. Phila-delphia, PA: Society for Industrial and Applied Mathematics (SIAM); 1992; p SIAM-61.
17. Bolinger L, Leigh JS. Hadamard Spectroscopic Imaging (HSI) for multi-volume localization. J Magn Reson 1988;80:162–167.
18. Serrai H, Young R. Reduction of acquisition time in Magnetic Reso-nance Spectroscopic Imaging using Wavelet encoding method. Inter-national Society for Magnetic Resonance in Medicine (ISMRM), Seat-tle, May, 2006.
19. Cunningham CH, Wood ML. Method for improved multi-band excita-tion profiles using the Shinnar-Le Roux transform. Magn Reson Med 1999;42:577–584.
20. Weaver J, Healy D. Signal-to-noise ratios and effective repetition times for wavelet encoding and encoding with wavelet packet bases. J Magn Reson (A) 1995;113:1–10.
21. Panych LP. Theoretical comparison of Fourier and wavelet encoding in magnetic resonance imaging. IEEE Trans Med Imaging 1996;15:141– 153.
22. Gelman N, Wood ML. Wavelet encoding for 3D gradient-echo MR imaging. Magn Reson Med 1996;36:613– 619.
23. Kreis R, Ernst T, Ross BD. Absolute quantitation of water and metabo-lites in the human brain. II. Metabolite concentrations. J Magn Reson (B) 1993;102:9 –19.
24. Anemueller J, Duann, J-R, Sejnowski TJ, Makeig S. Spatio-temporal dynamics in fMRI recordings unreaveled using complex ICA. Lecture Notes Comput Sci 2004;3195:1103–1110.
25. Sodickson DK, Manning WJ. Simultaneous acquisition of spatial har-monics (SMASH): fast imaging with radiofrequency coil arrays. Magn Reson Med 1997;38:591– 603.
26. Lin F, Tsai S, Otazo R, Caprihan A, Wald LL, Belliveau JW, Posse S. Sensitivity-encoded (SENSE) proton echo-planar spectroscopic im-aging (PEPSI) in the human brain. Magn Reson Med 2007;57:249 – 257.
27. Fu Y, Serrai H. High speed magnetic resonance spectroscopic imag-ing usimag-ing wavelet encodimag-ing and parallel imagimag-ing. International So-ciety for Magnetic Resonance in Medicine (ISMRM), Toronto, May, 2008.
28. Pruessmann KP, Weiger M, Scheidegger MB, Boesiger P. SENSE: sen-sitivity encoding for fast MRI. Magn Reson Med 1999;42:952–962.
Table 5
Experimental and Calculated SNR Values for the WE-SI and CSI SNR (a.u) 4 ⫻ 4 ⫻ 4 8 ⫻ 8 ⫻ 2 8 ⫻ 8 ⫻ 4
CSI 20.76 37.59 22.09
WE-SI (experiment) 13.43 13.91 6.87 WE-SI (calculated) 13.48 13.66 6.55