High-Resolution Decay-Pion Spectroscopy
of
4Λ
H Hypernuclei
P. Achenbach1, F. Schulz1, ∗, S. Nagao2†, S. Aulenbacher1, J. Beriˇciˇc3, S. Bleser1,4, R. B¨ohm1, ‡, D. Bosnar5, L. Correa6, M. O. Distler1, A. Esser1, H. Fonvieille6, I. Friˇsˇci´c5, Y. Fujii2, M. Fujita2, T. Gogami2, §, H. Kanda2, M. Kaneta2, S. Kegel1, Y. Kohl1, W. Kusaka2, A. Margaryan7, H. Merkel1, M. Mihoviloviˇc1, U. M¨uller1, S. N. Nakamura2, J. Pochodzalla1, A. Sanchez Lorente1,4, B. S. Schlimme1, M. Schoth1, C. Sfienti1, S. ˇSirca3, M. Steinen1,4, Y. Takahashi2, L. Tang8, M. Thiel1, K. Tsukada2, ¶, A. Tyukin1and A. Weber1
(A1 Collaboration)
1Institut f¨ur Kernphysik, Johannes Gutenberg-Universit¨at, D-55099 Mainz, Germany 2Department of Physics, Tohoku University, Sendai, 980-8571, Japan
3Department of Physics, University of Ljubljana, and Joˇzef Stefan Institute, SI-1000 Ljubljana,
Slovenia
4Helmholtz Institute Mainz, D-55099 Mainz, Germany
5Department of Physics, University of Zagreb, HR-10002 Zagreb, Croatia
6Universit´e Clermont Auvergne and Universit´e Blaise Pascal, CNRS/IN2P3, LPC, BP 10448,
F-63000 Clermont-Ferrand, France
7Yerevan Physics Institute, 375036 Yerevan, Armenia
8Department of Physics, Hampton University, Hampton, Virginia 23668, USA
E-mail: [email protected] (Received December 22, 2015) The first observation of4
ΛH fragments by means of decay-pion spectroscopy with a high resolution
magnetic spectrometer was achieved in 2012 at the Mainz Microtron MAMI. The extractedΛ binding energy was consistent with older nuclear emulsion data, but almost one order of magnitude higher in precision, while being limited by systematic uncertainties. This paper gives details on the kaon tagging at 0◦forward angle which was indispensable for the success of the experiment. In addition, a re-analysis of the data collected in 2012 is presented, including an improved a posteriori spectrometer calibration and a more robust fitting of the decay-pion peak in the momentum spectrum.
KEYWORDS: hypernuclear mass spectroscopy, mesonic weak decay, spectrometer calibration, bias and uncertainty in peak fitting
1. Introduction
A major effort in hypernuclear physics is to understand the interaction between hyperons and nucleons. The study of the 4ΛH hypernucleus is motivated by the difference between the hyperon– proton and hyperon–neutron interaction which is manifest in the difference of Λ binding energies,
∗Part of doctoral thesis. †Part of doctoral thesis.
‡Present address: FAIR Facility for Antiproton and Ion Research in Europe, 64291 Darmstadt, Germany. §Present address: Research Center for Nuclear Physics (RCNP), Osaka University, Osaka 567-0047, Japan. ¶Present address: Research Center for Electron Photon Science, Tohoku University, Sendai 982-0826, Japan.
1
■■■
∆BΛ, in the mirror pair of hypernuclei4ΛH and4ΛHe. So far, the binding energies were best determined by nuclear emulsion experiments [1] to be BΛ(4ΛH)= 2.04 ± 0.04 (stat.) MeV and BΛ(4ΛHe)= 2.39 ± 0.03 (stat.) MeV with systematic uncertainties not less than 0.05 MeV. The difference of ∆BΛ= 0.35± 0.06 (stat.) MeV in the A = 4 sector is one of the main sources of information about the charge symmetry breaking in theΛN interaction [2].
2. High-Resolution Decay-Pion Spectroscopy of Hyperfragments
In the year 2012 theΛ-hypernucleus 4ΛH was studied for the first time by high-resolution spec-trometers at the Mainz Microtron MAMI, Germany. The4
ΛH hypernuclei were produced as hyper-fragments from the target and the π− from the two-body decay4ΛH→4He+π−at rest was observed. From this experiment theΛ binding energy of4ΛH was determined with an almost one order of mag-nitude higher precision to be BΛ= 2.12 ± 0.01 (stat.) ± 0.09 (syst.) MeV [3]. A detailed description of the 2012 experiment can be found in Refs. [4–6].
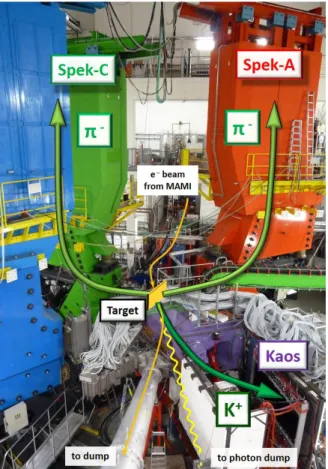
Fig. 1. Photograph of the experimental setup in the spectrometer hall for the hypernuclear fragmentation experiment of the year 2012. The electron beam (coming from top) was steered through a beam transport line magnetic chicane and was incident on the 9Be target with an angle of 17◦ with respect to an incident electron beam line. The Kaos spectrometer (purple) was installed at 0◦ forward angle as a kaon tagger. The high-resolution spectrometers SpekA (red) and SpekC (green) were used as decay-pion spectrometers. Beam dumps for electrons and photons were located downstream (not seen in the photograph). Fig. from Ref. [5].
The hypernuclear fragmentation experiment was technically challenging because of the small strangeness electroproduction cross sections, the small hypernuclear fragmentation yields, and the
large background fluxes. One countermeasure was to detect kaons at small forward angles below 10◦ where the production cross section was assumed to have a maximum. Therefore, the primary electron beam had to pass the Kaos spectrometer magnet and the dipole field caused a deflection. As the field of the spectrometer changes with the momentum setting, an adaptable beam transport was needed to steer the beam onto the existing beam dump. For a given field strength of 1.2 T in this experiment, the incident beam angle had to be 17◦, which was achieved by a chicane with two bending magnets preceding the Kaos dipole. Photons from Bremsstrahlung reactions in the target were stopped in a separate beam-dump. The chicane could be bypassed to allow for experiments using the standard beam direction. A photograph of this experimental setup is shown in Fig. 1.
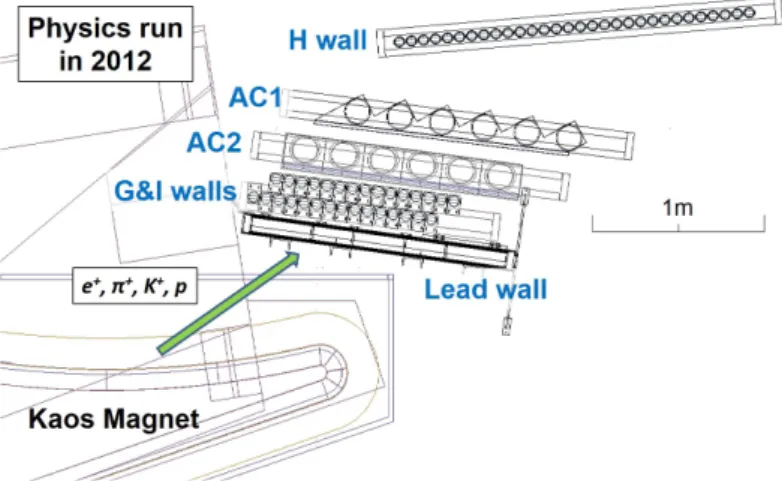
Fig. 2. Schematics of the Kaos spectrometer detector package adapted to K+tagging for the hyperfragment experiment of the year 2012. To shield the detectors from positrons a lead wall was installed. Timing, triggering, tracking, and particle identification was performed with three segmented scintillator walls (G, I and H walls). Two sets of aerogel ˇCerenkov detectors (AC1 and AC2) were used to suppress pions. Fig. from Ref. [5].
A9Be foil with a thickness of 125µm tilted by 54◦served as the production target. Kaons from the electroproduction reaction9Be(e, K+) that can can tag the strangeness production were identified by their time-of-flight and specific energy loss in the three scintillator walls and minimum signals in the two aerogel ˇCerenkov detectors. Fig. 2 shows the Kaos spectrometer detector package used for this experiment.
The suppression of the large positron background flux generated by the Bremsstrahlung and electron–positron pair production in the target was one of the most essential adaptations of the Kaos spectrometer for the hyperfragment experiment. Fig. 3 shows a photograph during the installation of a lead wall that was used to absorb most positrons.
In order to estimate the effect of a lead wall the magnet and the detectors of the Kaos spectrometer were modeled in the GEANT4 framework. In the model, electrons, pions, kaons, and protons were generated at the target position with uniform distributions in momenta, p∼ 400 − 1500 MeV/c, and in azimuthal angle,ϕ ∼ ±10◦. The lead wall with different geometrical thicknesses of tleadwas simu-lated at different positions on the platform that could be characterized by the opening angle θleadwith respect to the vacuum exit window. Since the incident angle of the particles wasθ ∼ 45◦the effective thickness of the wall was larger by a factor of∼ 1.4. The multiple scattering effect, energy losses by ionization, bremsstrahlung, and positron annihilation were taken into account as physical processes for positrons. In addition, the well-known GHEISHA code, which uses parametrized models to im-plement elastic and inelastic hadron scattering from nuclei in the low energy region (E < 20 GeV), was included for the hadron–nucleon interactions.
Fig. 3. Photograph of the spectrometer platform showing the lead wall for positron suppression before the TOF counters (G and I walls) and aerogel ˇCerenkov counters were installed. The wall thickness was smaller in the low momentum region in order to reduce the multiple scattering effect on kaons. The typical effective thickness of t = 14 cm of the lead wall corresponded to 25 X0 with the radiation length of lead being X0 =
5.6 mm. Fig. from Ref. [5].
The dependence of the particle detection ratios, defined asεilead = Nleadi /Nairi for i= e+, π+, K+, and p, on the lead wall thickness were simulated for each particle type, where Ni represents the number of particles detected with the scintillator walls G and H. Hadrons were affected mainly by the multiple scattering effect and the hadronic interactions. For kaons, the simulation resulted in εK+
lead ∼ 40 %, while for positrons ε e+
lead was ∼ 10−4for the same thickness. The ratios for the other background particles wereεπlead+ ∼ 30 % and εleadp ∼ 6 %. These results were well described with the differences of the total collision cross sections, with the total cross sections for K+p twice smaller than those ofπ+p and pp collisions. Furthermore, in the low momentum region protons were stopped in the lead wall due to the larger energy loss by atomic collisions. The effect of the lead wall was found to have an optimum for a thickness of tlead ∼ 14 − 16 cm at an angle of θlead ∼ 10◦. For larger thicknesses the track reconstruction for kaons became worse due to the multiple scattering effect. In the experiment, the lead wall was set up with an angle of θlead = 8◦ and had a thickness of tlead = 10 cm, 12 cm, and 14 cm in the low, middle, and high momentum region, respectively.
Note that the purpose of the Kaos spectrometer was kaon tagging, therefore, its momentum res-olution had no influence on the mass resres-olution achieved for the hypernuclear spectroscopy.
Theπ−momentum spectra were measured with the two spectrometers SpekA and SpekC. Both spectrometers consisted of four magnets in quadrupole-sextupole-dipole-dipole configuration and a detector package each. NMR probes were installed in all dipole magnets. The magnet optics was point-to-point focusing for the dispersive plane, i.e. vertical, and parallel-to-point focusing for the non-dispersive plane, i.e. horizontal. A threshold ˇCerenkov detector was used in order to distinguish electrons from pions and muons.
Vertical drift chambers (VDCs) were used for tracking. The VDCs were capable of measuring a particle track onto either the dispersive or non-dispersive plane. Typically the information from 18 drift cells was used to determine the track through the chambers leading to a detection efficiency very close to 100 % with effective position and angle resolutions of σx = 180 µm and σθ = 1.0 mrad for the dispersive focal-plane coordinates. In combination with the very thin vacuum windows and the optical design, which corrected for many aberrations by hardware, these track detectors led to a
relative momentum resolution ofδp/p ∼ 10−4. The spectrometers were operated at central momenta of 115 and 125 MeV/c with momentum acceptances of ∆p/p = 20 % (SpekA) and 25 % (SpekC). The survival probabilities for pions of these momenta wereεπ∼ 0.3.
3. Re-Calibration and Re-Analysis of the 2012 Data
The Mainz Microtron MAMI delivers an electron beam of up to 1.6 GeV. The absolute energy is measured inside the third stage of the accelerator with an accuracy ofδEbeam= 160 keV independent of the beam energy with an energy spread σbeam < 13 keV and long-term drifts of less than 1 keV when stabilized.
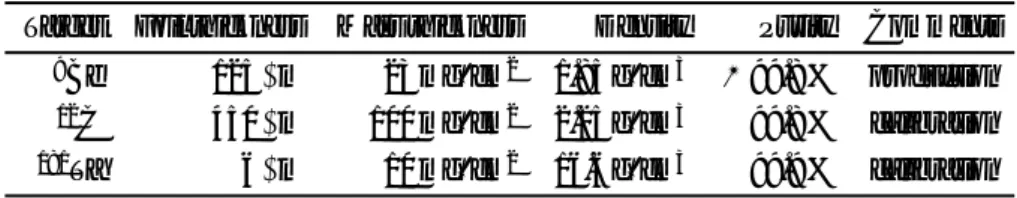
Table I. List of targets used for the hyperfragment experiment of the year 2012 and for the momentum
calibration of the high-resolution spectrometers.
Target Foil thickness Mass thickness Density Purity Comments
9Be 125µm 23 mg/cm2 1.85 g/cm3 > 99.8 % production
12C 450µm 100 mg/cm2 2.25 g/cm3 99.8 % calibration
181Ta 6µm 10 mg/cm2 16.6 g/cm3 99.9 % calibration
A12C foil and a181Ta foil were used to take elastic and inelastic scattering data for momentum calibration of SpekA and SpekC. The elastic scattering peaks were influenced by (i) the energy loss distributions in the target and material between target and the spectrometers, (ii) the effect of multiple scattering in the materials, (iii) the effects of position and angular resolutions of the VDCs, (iv) the effect of the spectrometer’s angular resolution at target, (v) the effect of ambiguities in the transfer matrix for the momentum reconstruction, and (vi) the electron beam width and energy spread.
Details of the targets in comparison to the production target are found in Table I. The mass thickness was determined with an accuracy of 1 %. Energy losses in the target and on the paths of the particles were corrected for a central reaction vertex with the most probable energy loss. This correction depends on beam and target angle as well as the reconstructed angle of the particle entering the spectrometer. For181Ta the energy loss was∆E ∼ 11 keV and for12C it was∆E ∼ 180 ± 2 keV. The energy of the scattered electron depends also on the scattering angle. The recoil effect can be corrected with the knowledge of the scattering angle. Due to the high mass of tantalum the variation of the recoil energy with scattering angle is only a few keV, making it an excellent choice for calibration. Several calibration measurements for different momentum settings were taken. Details of the cali-bration procedure are found in Ref. [7]. A crucial part of the procedure was the frequent measurement of the beam energy. A combined momentum calibration for all data sets from 2012 and 2014 was per-formed to minimize the systematic error in the momentum scale of the spectrometers. In summary, a systematic error from the calibration procedure ofσp < 10 keV/c for SpekA and σp < 30 keV/c for SpekC was evaluated. The dominant systematic uncertainty of 110 keV/c originated in the absolute accuracy of the beam energy measurement for the calibration.
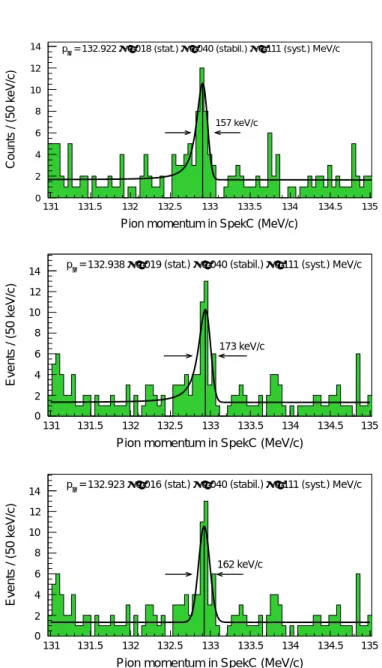
From the data taken in 2012 with SpekC using the 125µm thick 9Be target foil a decay-pion momentum of pπ= 132.922 ± 0.018 (stat.) ± 0.040 (stabil.) ± 0.111 (syst.) MeV/c was found [3]. A study of systematic effects in the fitting of the re-calibrated momentum distribution was performed. Fig. 4 shows the data with fits to the peak with a function composed of a signal that was formed (i) by a Landau distribution representing the energy loss distribution convoluted with a Gaussian resolution function on top of the background, and (ii) by only a Gaussian distribution on top of the background. The Gaussian fit was found to be more robust with respect to variations in the peak and
Pion momentum in SpekC (MeV/c) 131 131.5 132 132.5 133 133.5 134 134.5 135 Counts / (50 keV/c) 0 2 4 6 8 10 12 14 157 keV/c 0.111 (syst.) MeV/c ± 0.040 (stabil.) ± 0.018 (stat.) ± = 132.922 π p
Pion momentum in SpekC (MeV/c)
131 131.5 132 132.5 133 133.5 134 134.5 135 Events / (50 keV/c) 0 2 4 6 8 10 12 14 173 keV/c 0.111 (syst.) MeV/c ± 0.040 (stabil.) ± 0.019 (stat.) ± = 132.938 π p
Pion momentum in SpekC (MeV/c)
131 131.5 132 132.5 133 133.5 134 134.5 135 Events / (50 keV/c) 0 2 4 6 8 10 12 14 162 keV/c 0.111 (syst.) MeV/c ± 0.040 (stabil.) ± 0.016 (stat.) ± = 132.923 π p
Fig. 4. Top panel: decay-pion momentum distribution from the data set of 2012 published in Ref. [3]. The fit was composed of a Landau distribution convoluted with a Gaussian resolution function on top of a flat background. Data were taken with SpekC using the 125µm thick9Be target foil. Middle and bottom panel:
The same data but with a momentum scale that was consistently calibrated with the 2014 data sets as discussed in Ref. [7]. A bias correction of ∆p = 10 keV/c was applied to account for the energy loss distribution of the pions varying with the reaction vertex inside the target. The distribution of events in the spectrum was only marginally changed with respect to the top panel. Middle panel: peak fitted with a Landau distribution convoluted with a Gaussian resolution function. Bottom panel: peak fitted with a Gaussian distribution. No correction for the peak shape difference was applied to this fit.
the background. The errors of the fit parameters describing the peak width were relatively large due to the low count numbers, so that the returned FWHM of the peak was dependent on the binning and on the fit function. The influence of the Landau tail component on the peak position introduced a systematic dependence which was avoided by using only the Gaussian distribution. The difference between the middle and the bottom panel demonstrates this dependence.
To remove any dependency on the binning an un-binned maximum likelihood fit was performed. The parameter fit was carried out by a minimization of the negative logarithm of the likelihood for every event using MIGRAD in the MINUIT package. The parameter errors of the unbinned maximum likelihood fits were a few keV/c smaller than of the binned maximum likelihood fits.
In order to study effects of dependences on the description of the background, the parameters were fitted by assuming various background functions, from first to third order polynomial functions, and the expected quasi-free hyperon distribution extracted by the Monte Carlo simulation. The peak position obtained assuming different background functions was stable, confirming the robustness of the value. However, the width parameters were less stable.
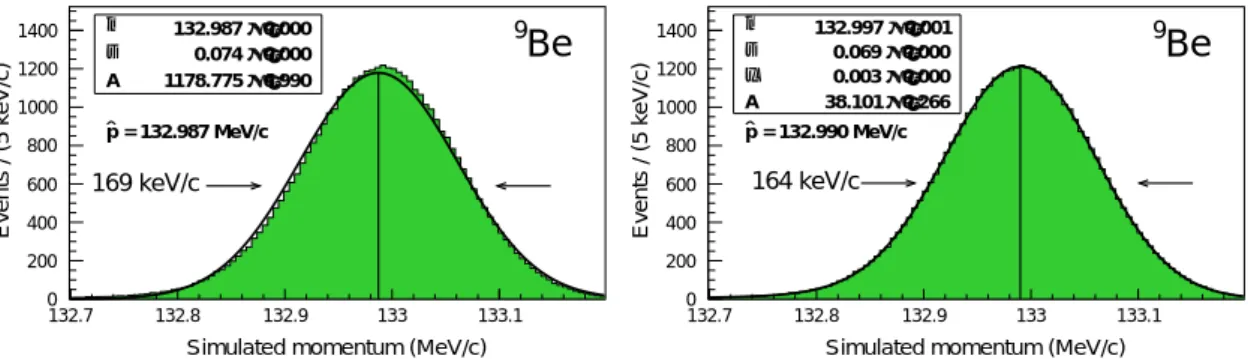
Simulated momentum (MeV/c)
132.7 132.8 132.9 133 133.1 Events / (5 keV/c) 0 200 400 600 800 1000 1200 1400 µ 132.987 ± 0.000 σ 0.074 ± 0.000 A 1178.775 ± 6.990 169 keV/c = 132.987 MeV/c p
Be
9Simulated momentum (MeV/c)
132.7 132.8 132.9 133 133.1 Events / (5 keV/c) 0 200 400 600 800 1000 1200 1400 µ 132.997 ± 0.001 σ 0.069 ± 0.000 ξ 0.003 ± 0.000 A 38.101 ± 0.266 164 keV/c = 132.990 MeV/c p
Be
9Fig. 5. Simulation of the pion momentum distribution for a hypothetical decay momentum of
133.000 MeV/c. Identical spectra were fitted with a Gaussian distribution (left), and with a Landau distribution convoluted with a Gaussian function (right). The fitting errorsσp for the fitting parameters relevant for width and position of the peak that were returned by MIGRAD in the MINUIT package were smaller than 1 keV/c . The FWHM and the peak maximum position ˆp are indicated. A systematic bias in the estimation of the peak momentum of∆p ∼ 3 keV/c can be attributed to Gaussian fit function that does not follow the simulated peak shape. A larger systematic bias of∆p ∼ 10 keV/c appears due to the simulated energy loss of the decay pions varying with the reaction vertex inside the target. The simulation includes the same correction for the most probable energy loss at a central vertex position as the data.
Fig. 5 shows a Monte Carlo simulation of the pion momentum distribution and examples of different peak shapes in the fit function to determine systematic effects in the estimation of the peak momentum. The most probable energy loss for a central vertex and central path into the spectrometer was ∆Emp = 26 keV/c that has been corrected in the shown spectra. A systematic bias of ∆p ∼ 10 keV/c was determined in the simulation as the energy loss of the pions was varying with the reaction vertex inside the target. A systematic bias of∆p ∼ 3 keV/c could be attributed to Gaussian fit function that does not follow the simulated peak shape. The results from this simulation have shown that the Landau component had a negligible contribution to the peak shape which motivated the use of the Gaussian function to describe the data.
The a posteriori spectrometer calibration and the more robust fitting of the decay-pion peak in the momentum spectrum led to a value of pπ = 132.922 ± 0.019 (stat.) ± 0.040 (stabil.) ± 0.111 (syst.) MeV/c being fully consistent with the published value.
4. Discussion
The pioneering experiment performed at MAMI succeeded in the identification of4ΛH hyperfrag-ments in electroproduction off9Be targets proving the feasibility of the method of decay-pion spec-troscopy at electron beams. The method could be used to study light hyperfragments which decay in
the two-body pionic channel. A micro-canonical decay model was used to describe the break-up of an excited compound hypernucleus after the absorption of aΛ-hyperon [8]. Since the composition and the excitation energy of an initially produced compound hypernucleus was not known, calculations needed to be performed as a function of the excitation energy and the mass number of the compound hypernucleus, with many fragmentation channels being open at an excitation energy of Ex= 20 MeV, while others require 30 MeV or more. For different reaction scenarios a rich spectrum of hyperfrag-ments was predicted and the formation probability of heavier fraghyperfrag-ments like 7ΛHe was of the same order as the one of lighter fragments like4
ΛH. For hyperfragments with charge numbers Z > 1 the stopping probabilities inside a 125µm thick target were 70−90 %, for the different hyperhydrogen isotopes 30−40 %, respectively. When stopping and two-body pionic decay probabilities were taken into account4ΛH became the dominant isotope.
In the year 2014 the experiment was continued with a better control of the systematic errors, with better background suppression, and with higher luminosities. With this new experimental technique using a well-defined electron beam and exploiting the high precision of magnetic spectrometers the quality of experimental data on light hypernuclei can considerably be improved. First results from the 2014 data were discussed in a special issue on recent progress in strangeness and charm nuclear physics [9].
To obtain an absolute energy measurement within δEbeam ∼ 20 keV uncertainty, a 42◦-dipole of the beam transport line leading to the spectrometer facility was used as a high-accuracy beam spectrometer. A high-precision field mapping device was developed and a dedicated beam detection system of high-quality RF cavity position monitors and high-resolution YAG:Ce scintillator screens was implemented. The goal was to achieve an absolute field accuracy ofδB ≈ 10 µT, corresponding toδB/B ≈ 0.2 × 10⁻⁵, and an absolute position accuracy ofδx ≈ 10 µm in the field map. The electron beam deflection was then expected to be determined withδθ/θ < 10−5uncertainty. The superposition of the magnetic field map and the actual beam position during calibration was achieved by a collinear laser system. The analysis of the data is ongoing. With the calibrated beam the absolute momentum calibration of the three high-resolution spectrometers at MAMI could be improved.
Acknowledgement
This work was supported in part by Deutsche Forschungsgemeinschaft (SFB 1044), the Carl Zeiss Foundation, European Community Research Infrastructure Integrating Activity FP7, U.S.-DOE Contract No. DEFG02-97ER41047, the Strategic Young Researchers Overseas Visits Program for Accelerating Brain Circulation (R2201), and the Core-to-Core program (21002) of JSPS.
References
[1] M. Juri´c et al., Nucl. Phys. B 52, 1 (1973).
[2] A. Gal, Phys. Lett. B 744, 352 (2015) and references therein.
[3] A. Esser et al. (A1 Collaboration), Phys. Rev. Lett. 114, 232501 (2015).
[4] A. Esser, Doctorate Thesis, Johannes Gutenberg-Universit¨at Mainz, Germany (2014).
[5] S. Nagao, Doctorate Thesis, Department of Physics, Graduate School of Science, Tohoku University, Japan (2015).
[6] F. Schulz, Doctorate Thesis, Johannes Gutenberg-Universit¨at Mainz, Germany (2016). [7] P. Achenbach et al. (A1 Collaboration), Eur. Phys. J. Web Conf. 113, 07001 (2016). [8] A. Sanchez Lorente, A.S. Botvina, and J. Pochodzalla, Phys. Lett. B 697, 222 (2011). [9] F. Schulz et al. (A1 Collaboration), Nucl. Phys. A 954, 149 (2016).