Bioinspired algorithmic-driven design of additively
manufactured composites
by
Grace X. Gu
B.S., Mechanical Engineering
University of Michigan, Ann Arbor, 2012
M.S., Mechanical Engineering
Massachusetts Institute of Technology, 2014
Submitted to the Department of Mechanical Engineering
in partial fulfillment of the requirements for the degree of
Doctor of Philosophy
at the
MASSACHUSETTS INSTITUTE OF TECHNOLOGY
June 2018
@
Massachusetts Institute of Technology 2018. All rights reserved.
Signature redacted
Author ...
w
Department of Mechanical Engineering
24, 2018
Signature redacted
May
Certified by ... ...
Markus J. Buehler
Professor of Civil and Environmental Engineering
Accepted by ...
MASSACUET ILNSTITUTE OF TECHNOLOGYJUN 25 2018
LIBRARIES
Thesis Supervisor
Signature redacted
Rohan Abeyaratne
Professor of Mechanical Engineering
Chair, Graduate Education Committee
77 Massachusetts Avenue
Cambridge, MA 02139 http://libraries.mit.edu/ask
DISCLAIMER NOTICE
Due to the condition of the original material, there are unavoidable flaws in this reproduction. We have made every effort possible to
provide you with the best copy available. Thank you.
The images contained in this document are of the best quality available.
Bioinspired algorithmic-driven design of additively
manufactured composites
by
Grace X. Gu
Submitted to the Department of Mechanical Engineering on May 24, 2018, in partial fulfillment of the
requirements for the degree of Doctor of Philosophy
Abstract
After billions of years of evolution, it comes as no surprise that biological materi-als are identified as invaluable sources of inspiration in the search for new materimateri-als. Bone, teeth, and spider silk, to name a few, are high-performing biological composites that possess impressive mechanical properties unmatched by their engineering coun-terparts. Many required mechanical properties in engineering practice are inherently conflicting. In contrast, natural materials can often avoid these fundamental compro-mises through sophisticated hierarchical structures. Additive manufacturing, with its layer-by-layer fabrication capabilities, facilitates leveraging natural material design to create complex bioinspired architectures. Expanding the design space, however, is indiscriminate in terms of specific material property optimization. In order to best use the templates derived from nature, there needs to be a process to match form to function. This thesis provides a framework that focuses on emulating the simple, yet elusive, design paradigms of nature - simple in their constituent building blocks and elusive in their underlying complexity. At the same time, using simulation and experiments we elucidate the mechanisms that generate their superior properties. A main undertaking of this thesis is to further improve and adapt biological designs for engineering requirements through algorithms and machine learning. Specifically, this thesis takes nacre and conch as model natural materials and deconstructs them in the bioinspired algorithmic-driven design (BADD) framework to build up rationally designed engineering composites.
In this work, we show that structural feature placement introduces hierarchy and can amplify mechanical material properties, especially at the interfaces of compos-ites. Heterogeneous material interfaces allow for diffuse load transfer at the interface, leading to a more distributed strain field enhancing overall toughness and strength of composites. Dynamic and static test loading cases, together with simulation provide validation, demonstrating the effects of hierarchy and heterogeneity on composite im-pact performance. Furthermore, microcracks can be exploited as an imim-pact-enhancing mechanism for hierarchical composites under dynamic loading. Incorporation of
ma-chine learning generates new superior designs with a minimal training set and pro-vides orders-of-magnitude faster exploration of design space compared with tradi-tional methods. These concepts lay the foundation for our approach to designing rationally toughened composites to be used in protective gear, energy applications, industrial components, and beyond. The BADD framework can be further used to study other natural or synthetic materials of interest. In the future, this bioinspired machine learning approach will enable materials-by-design of complex architectures to meet demanding engineering challenges.
Thesis Supervisor: Markus J. Buehler
Title: Professor of Civil and Environmental Engineering
Acknowledgments
This work would not have been posisble without the many people who have supported me along the way. I would first like to thank my thesis advisor Markus Buehler for his invaluable support during my doctoral studies. I thank him for his guidance, encour-agement, understanding, and patience. I am extremely fortunate to have Markus as my advisor and could not have imagined having a better mentor for my PhD study.
I express my sincere thanks to my doctoral thesis committee members Alexie Kolpak
and Xuanhe Zhao for their thoughtful and supportive feedback on my research. I am very fortunate to have such a wonderful thesis committee who not only helped me improve my thesis work but also gave me insightful advice for my academic career and beyond.
My appreciation also extends to Chian Fong Yen and Alex Hsieh from Army Research
Lab who sparked my interest in impact resistant materials, a topic that inspired many chapters of this thesis. My sincere thanks also go to Steve Rudolph, Pierce Hayward, and Steve Kooi who provided me immense help with my experiments in the MIT and
ISN research laboratories. I would like to also thank my collaborators Flavia and
Mahdi; it was a great pleasure to work with such brilliant and kind people. I would also like to thank the wonderful undergraduates I have had the pleasure of working with: Daly, Deon, Gloria, and Isak.
Thank you to my fellow lab mates at the Laboratory for Atomistic and Molecular Mechanics: Anna, Chia-Ching, Chun-Teh, Davoud, Diego, Dieter, Fran, Gang Seob, Isabelle, Jennifer, JJ, Kai, Leon, Shengjie, Shu-Wei, Steve, Talal, Tristan, and Zhao. It was wonderful working and getting to know all of them and I hope I have the op-portunity to work with them again. I also want to thank Marygrace for wonderfully supporting our lab. I thank Leslie and Una from the MechE department for their kindness the past few years. I want to thank all of my dear friends from Michigan, Massachusetts, California, and around the world for not letting me give up when things were tough and for inspiring me every day.
Finally, I must express my profound gratitude to my family for providing me with support and continuous encouragement throughout my studies. This accomplishment would not have been possible without them.
This research was funded by a National Defense Science and Engineering Graduate
(NDSEG) fellowship and BASF-NORA. Their support is greatly appreciated.
Cambridge, MA Grace X. Gu
List of Publications
I am the author of all the work presented in this thesis. Research was conducted in
the Department of Mechanical Engineering and the Department of Civil and Environ-mental Engineering at the Massachusetts Institute of Technology. Part of the work presented here has been published in or submitted to peer-reviewed journal articles
(chronological):
1. Grace X. Gu, Isabelle Su, Shruti Sharma, Jamie Voros, Zhao Qin, and Markus J. Buehler. Three-dimensional-printing of bio-inspired composites. Journal of
Biomechanical Engineering, 138 (2), 2016
2. Grace X. Gu, Leon Dimas, Zhao Qin, and Markus J. Buehler. Optimization
of composite fracture properties: Method, validation, and applications. Journal of Applied Mechanics, 83 (7), 2016
3. Flavia Libonati, Grace X. Gu, Zhao Qin, Laura Vergani, Markus J. Buehler.
Bone-inspired materials by design: Toughness amplification observed using 3D printing and testing. Advanced Engineering Materials, 18 (8), 2016
4. Grace X. Gu, Mahdi Takaffoli, Alex J. Hsieh, and Markus J. Buehler. Biomimetic additive manufactured polymer composites for improved impact resistance. Ex-treme Mechanics Letters, 9:317-323, 2016
5. Grace X. Gu, Mahdi Takaffoli, and Markus J. Buehler. Hierarchically
En-hanced Impact Resistance of Bioinspired Composites. Advanced Materials, 29
(28), 2017
6. Grace X. Gu, Susan Wettermark, and Markus J. Buehler. Algorithm-driven
design of fracture resistant composite materials realized through additive man-ufacturing. Additive Manufacturing, 17:47-54, 2017
7. Grace X. Gu, Flavia Libonati, Susan D. Wettermark, and Markus J. Buehler.
Printing nature: Unraveling the role of nacre's mineral bridges. Journal of the Mechanical Behavior of Biomedical Materials, 76:135-144, 2017
8. Grace X. Gu, Chun-Teh Chen, and Markus J. Buehler. De novo composite
design based on machine learning algorithm. Extreme Mechanics Letters,
18:19-28, 2018
9. Jingjie Yeo, Gang Seob Jung, Francisco Martin-Martinez, Shengjie Ling, Grace X. Gu, Zhao Qin, and Markus J. Buehler. Materials-by-design: Computation,
synthesis, and characterization from atoms to structures. Physica Scripta, 93
(5), 2018
10. Grace X. Gu, Chun-Teh Chen, Deon Richmond, and Markus J. Buehler.
Bioinspired hierarchical design using machine learning: Simulation, additive manufacturing, and experiment. 2018, under review
Contents
Abstract Acknowledgements 1 Introduction 1.1 Composites ... ... 1.2 Research problem . . . . 1.3 Thesis approach . . . . 1.4 Biom aterials . . . . 1.4.1 B one . . . . 1.4.2 Nacre and other hybrid materials 1.4.3 Silk 1.4.4 H air . . . . 1.5 Additive Manufacturing . . 1.5.1 Advantages . . . . 1.5.2 Basic types . . . . 1.5.3 Limitations . . . . 1.6 Methodology . . . . 1.6.1 Simulation . . . . 1.6.2 Additive manufacturing 1.6.3 Experiments . . . . 1.7 Organization of thesis . . . .2 Static structure-property relations in nacre
2.1 Introduction . . . . 11 4 7 35 35 36 37 41 41 43 45 48 50 51 51 53 53 54 54 54 54 57 57 .
2.2 Materials and methods . . . . .6 2.2.1 Structural designs . . . 2.2.2 Specimen fabrication
2.2.3 Mechanical testing 2.2.4 Digital image correlatio
2.2.5 Simulation set-up . . .
2.3 Results . . . . 2.3.1 Volume fraction effect
2.3.2 Mineral bridge effect
2.3.3 Simulations . . . . 2.4 Discussion . . . . 2.5 Conclusions . . . .. I] . . . . 6 0 . . . . 6 3 . . . . 6 4 . . . . 6 4 . . . . 6 4 . . . . 6 5 . . . . 6 5 . . . . .. . . . . 6 7 . . . . 7 2 . . . . 7 4 . . . . 7 6 3 Dynamic structure-property relations in nacre
3.1 Introduction . . . .. . . . 3.2 Materials and methods . . . . 3.2.1 Unit cell and sample configurations . . . . 3.2.2 Composite fabrication . . . .
3.2.3 Droptower impact testing . . . . 3.2.4 Modeling of impact damage . . . .
3.3 Results and discussion . . . .
3.3.1 Impact characterization of base materials
3.3.2 Mode of failure in the composite design .
3.3.3 Discussion . . . . 3.4 Conclusions . . . .
4 Impact resistance of conch shells through hierarchical structure 4.1 Introduction . . . .
4.2 Materials and methods . . . .
4.2.1 Droptower impact testing . . . .
4.2.2 Stress-strain characterization of base materials . . . . 12 79 . . . 79 . . . 82 . . . 82 . . . 82 . . . 83 . . . 84 . . . 88 . . . 88 . . . 89 92 . . . 94 97 97 101 102 103 . . . . 60
4.2.3 Parameters for finite element model . . . . 4.2.4 Modeling of impact response . . . . 4.3 Results and discussion . . . . 4.4 C onclusion . . . .
5 Algorithmic-driven design of composites
5.1 Introduction . . . . 5.2 Materials and methods . . . .
5.2.1 Computational model . . . .
5.2.2 Validation of algorithm for effective stiffness and compliance
5.2.3 Validation of algorithm using a brute force method . . . . . 5.2.4 Case studies . . . .
5.2.5 3D-printing . . . .
5.2.6 Mechanical testing . . . .
5.2.7 Digital image correlation . . . .
5.3 Results and discussion . . . .
5.3.1 Benchmark and optimized geometries . . . .
5.3.2 Mechanical properties: Stress-strain relations . . . .
5.3.3 Comparison with computational results . . . .
5.3.4 D iscussion . . . . 5.4 C onclusions . . . .
6 Machine learning optimization of composites 6.1 Introduction . . . . 6.2 Materials and methods . . . .
6.2.1 Finite element model . . . . 6.2.2 Machine learning approach . . . .
6.2.3 Machine learning model . . . . 6.2.4 Image resize . . . . 6.3 R esults . . . . 6.3.1 Validation of prediction accuracy . . .
13 104 104 105 114 117 117 119 119 123 125 126 128 129 130 130 130 132 135 136 139 141 . . . . 141 . . . . 146-. 146-. 146-. 146-. 146-. 146-. 146-. 146-. 146-. 146-. 146-. 146-. 146-. 146 . . . . 147 . . . . 150 . . . . 151 . . . . 151 . . . . 151
6.3.2 Ranking comparison . . . . .
6.3.3 Geometric pattern . . . . 6.3.4 Case study . . . . 6.4 Discussion . . . .
6.5 Conclusions . . . .
7 Machine learned hierarchical designs
7.1 Introduction . . . .
7.2 Materials and methods . . . .
7.2.1 Finite element model . . . .
7.2.2 Machine learning approach . . . .
7.2.3 3D-printing and experiments . . . .
7.3 Results and discussion . . . . 7.3.1 Hierarchical design of system . . . . 7.3.2 Training and validation process . . . .
7.3.3 High performing designs predicted by ML model . . . .
7.3.4 Patterns discovered from high performing designs . . . . 7.3.5 Additive manufacturing and tensile testing experiments . 7.4 C onclusions . . . .
8 Conclusions and future outlook
8.1 Summary of key findings . . . . 8.2 Future perspective . . . . A Supplementary materials
A.1 Volume fraction data for nacre mineral bridge study . . . . A.2 Sample LS-DYNA input file keywords . . . . A.3 Performance details for top 25 ML geometries . . . . Bibliography 14 . . . . 152 . . . . 155 . . . . 157 . . . . 160 . . . . 163 165 . . . 165 167 . . . 167 . . . 168 . . . 170 . . . 171 . . . 171 . . . 172 . . . 174 . . . 176 . . . 178 . . . 180 181 181 182 185 185 186 187 188
List of Figures
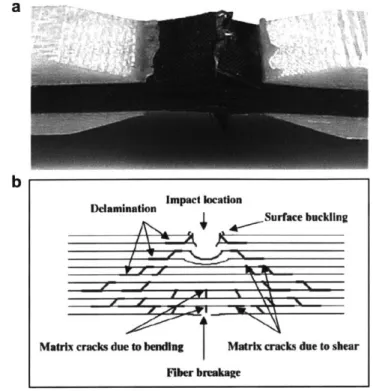
1-1 Composite damage patterns. a) Delamination between interface layers in a composite. This figure is adapted from Ref. [150] with no changes.
b) Various impact damage consequences in a composite. This figure is
reprinted from Ref. [65] with permission from Elsevier. . . . . 37
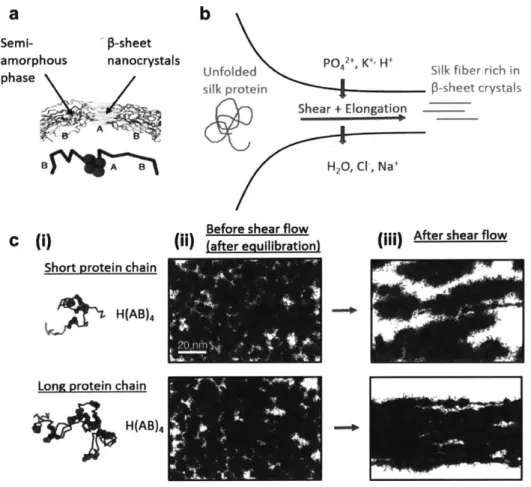
1-2 Graphical abstract illustrating the three-pronged approach of bio-inspiration, optimization, and additive manufacturing that makes up the BADD framework. The goal of BADD is to efficiently prototype, test, and ap-propriate natural designs for design of engineered composites with the same superior mechanical properties boasted by biological composites such as nacre and conch shell. Effectively, BADD works to translate the designs of nature for use by engineers. . . . . 38 1-3 Analysis of the influence of spinning process and protein chain length
on the formation of continuous and robust silk fibers. a) Synthetic silk protein model and main building blocks. Building block named A represents poly(alanine) and the hydrophobic domain. Building block named B represents GGX (X=R, L, Y or
Q)
rich and the hydrophilic domain. Hydrophobic A domain forms /3-sheet crystals for stiffness and strength. Hydrophilic B domain forms the semi-amorphous phase for extensibility of the silk fiber, reprinted from [122] with permission from Springer Nature. b) Schematic of the natural spinning process. c) Influence of shear flow and protein chain length on the formation of silk fibers, reprinted from [122] with permission from Springer Nature. This entire figure is adapted from Ref. [78]. . . . . 471-4 a) Hierarchical structure of human hair. b) Schematic of hair fiber coiled-coil protein composed of alpha-helices, connected by disulfide bond. c) Schematic of a three-strand model composed of three alpha-helices connected by a cluster of disulfide bond with different geometric
arrangement and strength. This figure is adapted from Ref. [78]. . . . 49
2-1 Dimensions of structural features. a) Unit cell dimensions for vari-ous volume fraction samples. b) Comparison of 70% volume fraction samples with and without mineral bridges. Pink color represents the stiff material and black color represents soft material. This figure is adapted from Ref. [77]. . . . . 60
2-2 Comparison of natural nacre feature ratios to synthetic nacre fabri-cated in this study. Natural nacre values are taken from Ref. [9,183]. Pink color represents the stiff material and black color represents soft material. This figure is adapted from Ref. [77]. . . . . 61
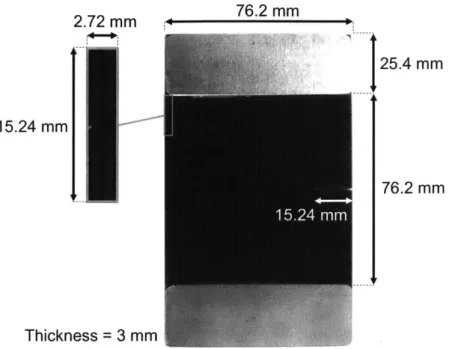
2-3 Geometry and dimensions of sample, aluminum grips, and crack size.
Dimensions all in mm. This figure is adapted from Ref. [77]. ... 62
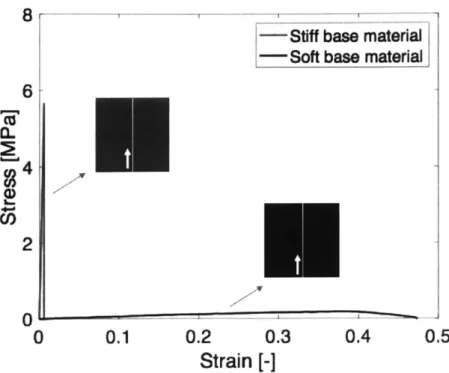
2-4 Base material stress-strain curves and respective failure pattern. This figure is adapted from Ref. [77]. . . . . 66
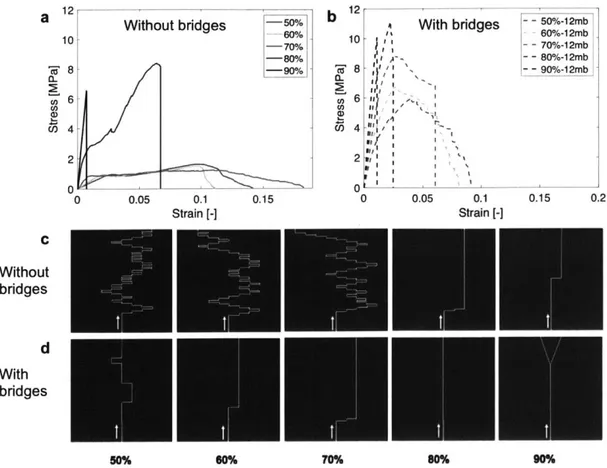
2-5 Material response for various volume fractions, with and without min-eral bridges (MBs). a) Representative stress-strain plots for various volume fractions of stiff material without MBs. b) Representative stress-strain plots for various volume fractions of stiff material with a fixed number of MBs (i.e. 12). c) Failure patterns of samples with-out MBs. d) Failure patterns of samples with MBs. This figure is adapted from Ref. [77]. . . . . 67
2-6 Toughness-Strength relationships. a) Toughness values for various vol-ume fraction samples with 12 mineral bridges (MBs) and without MBs shows that toughness does not increase in 80% and 90% samples with the addition of the MBs. b) Strength values for various volume frac-tion samples with 12 MBs and without MBs shows improvement for all samples. c) Change in toughness and strength for different percentage of stiff material systems: 70% sample series show the largest improve-ment in both strength-and-toughness. d) Stress-strain response of 70% sample with varying number of MBs: 70%-9mb represents the best case scenario. This figure is adapted from Ref. [77]. . . . . 68
2-7 Crack propagation over time for 60% and 70% volume fraction samples.
For both samples, in the beginning of fracture, many microcracks start to form. The failure at the end of the test shows that the addition of mineral bridges causes the crack to travel in a block-wise fashion rather than a zigzag fashion without bridges. This figure is adapted from R ef. [77]. . . . . 70
2-8 Toughness-Strength relationships for 70% volume fraction sample. a) Toughness starts to increase with an increase in shear length factor then starts to decrease with a peak around 10 (corresponding to 9 mineral bridges (MBs)). Shear length factor is platelet length divided by the shear length (distance between MBs) with the corresponding number of MBs. b) Strength starts to increase with shear length factor then levels off around 9 MBs. This figure is adapted from Ref. [77]. .... 71
2-9 Strain field comparison between experimental digital image correlation
and simulations. Both are normalized with respect to the maximum experimental and numerical value. a) Strain fields from simulation agrees well with those from experiment. b) Experimental strain field results could not capture the small features of the mineral bridges (MBs), owing to the limitations of speckle size compared to the MB size, while the simulation results are able to show more local features pointing to the role of MB of transferring strain. Both simulation and experimental outcome reveal how the presence of mineral bridges induce a further stress delocalization, resulting in a more homogeneous strain field. This figure is adapted from Ref. [77]. . . . . 73
2-10 Ashby Chart shows two families. One family is the various volume fraction sample performances and the other family is the 70% samples with varying number of mineral bridges (MBs). Ashby chart shows the amplification in mechanical properties of the nacre-inspired com-posite design with respect to the soft and stiff base materials. The chart also shows the larger effect of the design over the volume frac-tion of stiff material in enhancing the toughness and strength of the composites: the implementation of the characteristic feature of MBs provides a further increase in the mechanical performance, shifting the brick-bridge-mortar-like composites towards the top right. This figure is adapted from Ref. [77. . . . . 75
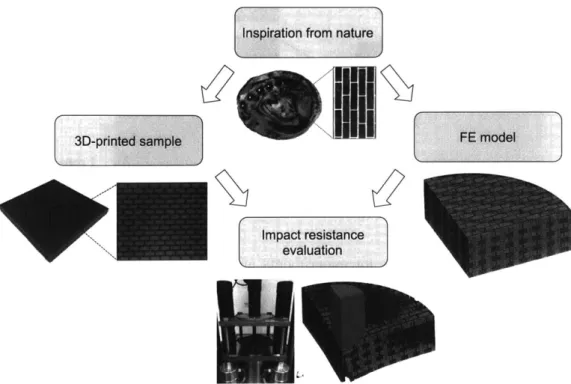
3-1 Methodology of research includes inspiration from nature, creation of
a finite element (FE) model, additive manufacturing, and droptower testing. This figure is adapted from Ref. [80]. . . . . 81
3-2 Unit cell dimensions for experiments and finite element model. This
figure is adapted from Ref. [80]. . . . . 82 18
3-3 a) Experimental setup of the droptower test machine with sample
con-straints. b) Quarter geometry of the Nacre-like design in simulation. Nacre-like design has two different plies that are repeated four times through the thickness in the laminate. The second ply is the 90-degree rotation of the first ply. c) Isolated stiff (left) and soft (right) materials. This figure is adapted from Ref. [80]. . . . . 84 3-4 Tension and compression stress-strain curves for stiff and soft
materi-als. This figure is adapted from Ref. [80]. . . . . 85 3-5 Strain rate behavior from quasi-static and SHPB testing. This figure
is adapted from Ref. [80] . . . . 86 3-6 Validation of finite element models with experiments. a), b) Stiff
mate-rial: the exit face damage pattern exhibited in simulation and observed from droptower testing show excellent agreement for velocity of 2.3 m/s. Congruence of the force-displacement curves validates the mate-rial model for the stiff constituent. c), d) Soft matemate-rial: plug failure in the droptower experiment is also observed in our simulation, validat-ing the soft constituent material model. Similar to the stiff material, force-displacement curves for velocity of 4 m/s show good agreement between simulation and experiment. This figure is adapted from Ref. [80]. 89
3-7 Simulation comparison with experimental results. a), b) Stiff and soft
constituents make up the composite construct, where simulation re-sults recover characteristic radial cracks seen in experiments. c) The agreement of the force-displacement curves between experiment and simulation is reasonable given the complex characteristic of the com-posite design. Simulation 1 represents a center impact and simulation 2 represents an off center impact. This figure is adapted from Ref. [80]. 90
3-8 Experimental curves for Nacre-like composites. This figure is adapted
3-9 Comparison of the impact performance between Nacre-like and mono-lithic stiff (Bulk) samples. a) Velocity vs. displacement curves show that the Nacre-like composite design stops the projectile during impact (residual velocity = 0 m/s), while the bulk design is not capable of pre-venting the perforation of the projectile which reaches a final velocity of 1 m/s. Insets of the von Mises stress from the simulation show that while in the Bulk design, a large high stress region appears underneath the projectile, the composite design distributes the stress over a larger volume of the sample and avoids stress localization. After impact, the bulk design initially cracks from the bottom of the sample; the crack propagates upwards and to the sides to eventual catastrophic failure with chunks of material breaking off. The Nacre-like composite design, on the other hand, still leaves material ahead of the projectile to carry load and sustain the impact. b) The histogram plots of the normalized
von Mises stresses (Uvm = Uvm/Jf) before failure for Nacre-like and
Bulk samples show that stresses are higher in the bulk material, which makes it more likely to fail, where uvm is the von Mises stress of the element and of is the failure stress defined for the stiff material in the
FE model. This figure is adapted from Ref. [80]. . . . . 92
4-1 a) Conch shell-inspired structure fabricated via additive manufactur-ing. Biological conch shells have a unique three-tier calcium carbonate crossed-lamellar structure integrated with biopolymer. We present for the first time a conch shell-inspired composite which can replicate the crack-arresting features at the interface between different layers. b) Unit cell is composed of a stiff (green) and soft (pink) material. The top, middle, and bottom layers of the shell are successively rotated 90 degrees as indicated in the figure. Thus, if the top layer is taken to be the 0 degree ply, the middle layer is the 90 degree ply, and the bottom layer is again the 0 degree ply, but mirrored. c) Representative lam-inate creation: multilayer unit cell is built from different rotations of single unit cell and is then repeated in the in-plane direction to obtain laminate. This figure is adapted from Ref. [79]. . . . . 100
4-2 Unit cell dimensions used for experiments and finite element modeling. This figure is adapted from Ref. [79]. . . . . 101
4-3 Unit cell CAD dimensions (in mm). This figure is adapted from Ref. [79].102
4-4 Representative experimental force-displacement curves (left) and resid-ual velocity curves (right) for Hier-1 and Hier-2 composites. This figure is adapted from Ref. [79] .. . . . . 105
4-5 Experimental damage patterns. a) Damage patterns for an impact velocity of 3 m s- for both materials show that the Hier-1 composite fails catastrophically while Hier-2 only develops few distributed cracks. Stiff material is pink in color, and soft material is black in color. Scale bar: 3 mm. b) Image of a Hier-2 sample cross-section where the crack propagates from the bottom layer of the sample, and arrests completely in the second layer. Scale bar: 1 mm. c) Cross-sectional image of the same sample where a different crack propagates from bottom layer of sample along soft interface and changes direction again when reaching the interface between the first and second layers. d) Another cross-sectional image of the same sample where a different crack propagates from the first layer to a part of the third layer, where the crack is finally arrested at the crisscrossed section in the third layer. This figure is adapted from Ref. [79]. . . . . 107
4-6 Finite element analysis results. a) Quarter model set-up for Hier-2 de-sign, depicting isolated stiff and soft materials. b) Force-displacement and residual velocity-displacement curves from simulation show good agreement with experimental results at impact velocity 2.3 m s-. c) and d) Different views of crack propagation in a Hier-2 sample subject
to 2.3 m s- impact velocity. This figure is adapted from Ref. [79]. . . 110
4-7 Crack deflection or penetration. a) Schematic showing crack travelling towards the interface (left) and could either deflect into the interface or penetrate through the interface. vi and v2 are the incident and deflected crack speeds, respectively. 3 is the interfacial angle starting from the horizontal axis and ending at the interface. b) For our 3D-printed system, crack deflection into the interface will occur when /3 <
50 , while the crack will traverse the interface for 50' < 3 < 90'. This
figure is adapted from Ref. [79]. . . . . 114 22
5-1 Model formulation. Targeted material property optimization is per-formed by algorithmic assignment of stiff and soft elements in a multi-phase building block. The prescribed binary distribution of element stiffness defines stiffness and volume ratios for each initial geometry. The material contains an edge crack and undergoes tensile loading un-der mode I failure with displacement controlled boundary conditions ('dx'). 'a' is the length of the sample (square), and 'b' is the length of the crack. This figure is adapted from Ref. [76]. . . . . 120
5-2 Algorithm organization. The algorithm takes in as an input a random
initial population of soft and stiff elements. At every iteration an objective function value of the system is calculated for every element when only it is switched. Elements switch from soft to stiff and vice versa. The switch that generates the highest objective value increase is kept for the next iteration. This process is repeated until there is no switch that generates a higher objective value compared to the previous iteration at which point the algorithm exits outputting the final geometry. This figure is adapted from Ref. [76]. . . . . 121
5-3 Optimized solutions for maximizing effective compliance and effective stiffness for 8x8 and 12x12 grid size systems. a) The maximum com-pliance solution is a geometry in which the soft (black) and stiff (grey) materials are in series with the loading conditions. From different ini-tial random geometries, the algorithm leads to the optimized design of in-series materials. b) The maximum stiffness solution is a geome-try in which the soft and stiff materials are in parallel. Similarly, the algorithm leads to the optimized design starting from random initial geometries. These final geometries show that there is no single opti-mum solution for these problems, but many optimal solutions solving
5-4 Larger grid size solutions for minimizing stiffness (maximizing
com-pliance) and maximizing stiffness. Convergence of solutions: a) For a 16x16 system, the optimal solution obtained from the algorithm re-mains the same. The graph shows that the initial effective stiffness
starts out high and decreases as iteration increases. b) The optimal solution remains the same for maximizing stiffness and the graph shows an increase in effective stiffness with iteration. These two graphs show the solutions converging to the theoretical optimal values of compliance and stiffness. This figure is adapted from Ref. [76]. . . . . 125
5-5 Solutions from brute force method to validate algorithm when optimiz-ing for toughness. The chart describes the differences between system
A and system B. System A has a grid size of 8x8 and an edge crack
that is 50% of the system length, with 'a' being the length of the
sam-ple. The algorithm begins with a random geometry and generates the solution that exactly matches the solution obtained from brute force (i.e., checking every possible solution and selecting the best). The
al-gorithm, however, is orders of magnitude faster than the brute force method. System B has a grid size of 10x1O and an edge crack that
is 20% of the system length. The algorithm also obtains the same solution as the brute force method. Tte is the toughness obtained from the brute force method and Tg is the toughness obtained from our algorithm, and the ratio shows unity. This performance confirms that our algorithm is effective and robust. This figure is adapted from
R ef. [76]. . . . . 127
5-6 Various case studies. a) The geometry for the objective function that optimizes toughness modulus only. b) The geometry for the objective function that optimizes toughness along with stiffness. More elements need to be in parallel to maintain high stiffness and also toughness. c) The geometry for the objective function that optimizes toughness along with compliance. More elements are spread out to be in series with each other. Variables:
f
is the objective function, T is the toughness modulus, To is the initial geometry toughness modulus, Eeff is the effective stiffness of the system, and EO is the effective stiffness of the initial population. This figure is adapted from Ref. [76]. . . . . 1285-7 a) Stages of optimization of the distribution of stiff and soft material
elements, in the presence of a crack, subject to mode I tensile loading in the x-direction (top). The algorithm takes in as an input a ran-dom initial geometry of soft and stiff elements (black and pink colors, respectively). Elements are switched from soft to stiff and vice versa at each iteration with the objective of increasing toughness modulus ratio,
f
= T/TO. The toughness ratio between the current and initialgeometries (f) increases with iteration number. Stiffness ratio between the current and initial geometry (E/Eo) shows that no sacrifice in stiff-ness was made in the process of optimization. b) Boundary conditions for simulation and experimental set-up. This figure is adapted from R ef. [8 1]. . . . . 131
5-8 Visualization of the optimized and benchmark geometries. a)
Homoge-neous benchmark geometries used are (1) all stiff and (2) all soft mate-rial. These homogeneous geometries together form the random (Rnd) geometry in the center. From a random geometry of 20% volume frac-tion soft material, the other benchmark geometries can be formed by rearranging the soft elements. The two optimized geometries are cre-ated from two different initial random geometries with the objective of maximizing toughness and with the constraint of 20% volume fraction of soft material (Opt-1 & Opt-2). The minimum toughness (Min-T) ge-ometry minimizes the objective of toughness. The arbitrary gege-ometry (MIT) is created by selectively placing soft materials in the geometry.
b) Photographs of the corresponding 3D-printed samples. This figure
is adapted from Ref. [81] .. . . . . 132 5-9 Stress-strain relations. a) Both optimized materials fail at a higher
stress and strain compared to all benchmark samples. b) Stress-strain relations for the softer materials that exhibit higher strain and lower failure stress. c) Toughness amplification is the ratio of the average sample toughness to the average toughness of the stiff homogenous base material (T/Tstf f). The two optimized geometries have on av-erage a more than 20-fold increase in toughness modulus compared to the stiff homogenous sample. The increase in toughness modulus compared to the other samples is of the same order of magnitude. As expected from simulation, the minimum toughness sample performed the worst compared to the other benchmark samples with 20% soft volume fraction. d) In terms of strength, optimized geometries have on average a more than two-fold increase in strength compared to stiff and random geometries. The strength of the optimized geometries compared to Soft and Min-T geometries, on the other hand, is orders of magnitude greater than a two-fold increase. This figure is adapted from R ef. [81]. . . . . 134
5-10 Strain fields obtained from simulation and experiment. Simulation and DIC images show good agreement of the strain distribution for the a)
homogeneous and b,c) two optimized materials (Opt-1 & Opt-2). Grey areas in experimental images represent regions that were covered by the steel grips for testing. This figure is adapted from Ref. [81] . . . . 136
6-1 Overall flow chart. The flow chart shows the -ML approach using the linear model for an 8 by 8 system. The ML approach using the CNN model is similar to this flow chart but without the step of converting to 1-D arrays. Note that for the 16 by 16 system, the amount of input data, training data, and testing data are 1 million, 0.9 million, and 0.1 million, respectively. This figure is adapted from Ref. [75]. . . . . 145
6-2 Finite element model of 2-D composites: The model is composed of
stiff and soft materials, with displacement boundary conditions in the x-direction. Pink color refers to the stiff material and black color refers to the soft material. This figure is adapted from Ref. [75]. . . . . 147
6-3 Histogram data and prediction accuracy. a) Histogram of the
tough-ness ratio, which is defined as the toughtough-ness of a given geometry nor-malized by the lowest toughness of all the combinations. Note that, for clarity, there are a very small portion of geometries with tough-ness ratios larger than 20 not shown in the figure; the figure shows the toughness ratios of around 99.5% of all the combinations. b) Histogram of the strength ratio, which is defined as the strength of a given ge-ometry normalized by the lowest strength of all the combinations. For clarity, there are few geometries with strength ratios larger than 5.0 not shown in the figure; the figure shows the strength ratios of around
99.7% of all the combinations. c) Prediction accuracy as a function of
the training data density. In this first set of calculations, the train-ing batch size is set to 100 and the number of traintrain-ing loops is set to
100,000. d) Prediction accuracy as a function of the training batch
size. In this second set of calculations, the number of training data is set to 30,000 and the number of training loops is set to 100,000. e) Prediction accuracy as a function of the number of training loops. In this third set of calculations, the training batch size is set to 100 and the number of training data is set to 30,000. This figure is adapted from R ef. [75]. . . . . 149
6-4 Ranking comparisons for linear model. a) and b) show the comparisons between the rankings obtained from FEM and the linear model for toughness and strength, respectively, with a line y = x shown. c) and
d) are zoomed-in figures for the top 2,000 ranked results showing good
agreement between the rankings obtained from FEM and the linear model. In these ML calculations, the training batch size is set to 100 and the number of training data is set to 30,000 and the number of training loops is set to 100,000. This figure is adapted from Ref. [75]. 153
6-5 Ranking comparisons for CNN model. a) and b) show the comparisons between the rankings obtained from FEM and the CNN model for toughness and strength, respectively, with a line y = x shown. c) and
d) are zoomed-in figures for the top 2,000 ranked results. As with the
linear model, the results show good agreement between the rankings obtained from FEM and the CNN model. In these ML calculations, the training batch size is set to 100 and the number of training data is set to 30,000 and the number of training loops is set to 100,000. This figure is adapted from Ref. [75]. . . . . 154
6-6 Geometric patterns for high-toughness designs. Comparison of the top 12 geometries obtained from FEM and those obtained from the ML model shows high similarities between geometric patterns. Pink color refers to the stiff material and black color refers to the soft material. This figure is adapted from Ref. [75]. . . . . 155
6-7 Geometric patterns for high-strength designs. Comparison of the top
12 geometries obtained from FEM and those obtained from the ML model shows high similarities between geometric patterns. Pink color refers to the stiff material and black color refers to the soft material. This figure is adapted from Ref. [75]. . . . . 156
6-8 Weights of elements for toughness and strength for 16 by 16 system.
Weights outputted from the ML model shows how much each element contributes to a) toughness and b) strength. Colors represent the weight of each element with respect to each other: blue color represents negative weights and red color represents positive weights. Numbers on the elements represent the ranks in terms of weight. This figure is adapted from Ref. [75]. . . . . 158
6-9 Weight distributions and histograms for 16 by 16 system. Weight dis-tributions for a) toughness and b) strength shows a few elements either have very low or very high weight values. Most elements have a weight value close to zero, implying that most elements contribute very lit-tle to toughness and strength. Comparison between 1 million training geometries (input data) and 1 million geometries (output data) deter-mined from the ML model for c) toughness and d) strength shows the ability of the ML model to find high-performance designs despite us-ing a very small trainus-ing density. The toughness/strength ratio in the x-axis is defined as the toughness/strength of a given geometry nor-malized by the lowest toughness/strength of the candidate geometries. The y-axis is truncated at 100,000 for clarity and the full histogram
data is shown in Fig. 6-11. This figure is adapted from Ref. [75]. . . . 159
6-10 Geometric patterns of high-performance designs for 16 by 16 system.
Top 25 geometries obtained from the ML model for a) toughness and
b) strength. Pink color refers to the stiff material and black color refers
to the soft material. This figure is adapted from Ref. [75]. . . . . 160 6-11 Full histogram data. Comparison between 1 million training geometries
(input data) and 1 million geometries (output data) determined from the ML model for a) toughness and b) strength shows the ability of the ML model to find high-performance designs despite using a very small training density. The toughness/strength ratio in the x-axis is defined as the toughness/strength of a given geometry divided by the lowest toughness/strength of the candidate geometries. This figure is adapted from Ref. [75]. . . . . 161 6-12 Refined geometries for larger systems. Refined geometries for a)
high-toughness designs and b) high-strength designs for 32 by 32, 64 by 64, and 128 by 128 systems. Pink color refers to the stiff material and black color refers to the soft material. As the system becomes larger, the geometries become smoother. This figure is adapted from Ref. [75]. 161
7-1 Training and testing results from ML models using different numbers of neurons. Blue dots represent training data, yellow dots represent testing data, and red curve represents y = x line. a) A model using
128 neurons has NRMSD = 0.0407 for training data and NRMSD = 0.0610 for testing data. b) A model using 256 neurons has NRMSD = 0.0281 for training data and NRMSD 0.0465 for testing data. c) A model using 512 neurons has NRMSD = 0.0168 for training data and NRMSD = 0.0363 for testing data. d) A model using 1024 neurons has NRMSD = 0.0148 for training data and NRMSD = 0.0332 for testing
data. The model using 256 neurons is used in this work to balance the accuracy and computational costs . . . . 169
7-2 Tensile testing experimental setup. Representative sample with
alu-minum grips for testing (left) and tensile testing setup using Instron m achine (right). . . . . 171
7-3 Hierarchical design construction and ML applicability. a) A family of three unit cells are considered with variable anisotropic properties. Pink and black colors refer to stiff and soft building blocks, respectively.
b) The modulus ratio between stiff and soft building blocks affects
the different unit cell's degree of isotropy. c) Microstructure consists of detailed assemblage of unit cells which is then converted to a data matrix of building blocks encoding the individual unit cells (blue = U1,
orange = U2, yellow = U3). Data matrices encode the different unit cell
arrangements for each microstructure and are taken as inputs for the ML model. d) Comparison between FEM results and ML predicted values for toughness. e) Good agreement between ranking of finite element simulation for the training and testing data designs with ML predicted rankings shows that CNN model can be used for proposed hierarchical design problem. . . . . 173
7-4 Machine learning generated designs. a) Strength and toughness ra-tios of designs computed from training data and ML output designs. Strength ratio is the strength normalized by the highest training data strength value. Toughness ratio is the toughness normalized by the highest training data toughness value. The ML output designs are shown from training loops of 1,000 and 1,000,000. Envelopes show that ML material properties exceed that of training data material proper-ties. b) Effects of learning time on ML model for minimum, mean, and maximum toughness ratio start to converge as training loops in-crease. c) Microstructures from partitions A (lowest toughness designs in training data) and B (highest toughness designs from ML) from part a) of figure with corresponding colors for unit cell blocks (blue =
U1, orange = U2, yellow = U3). Also shown in the last column for designs A and B are the strain distribution which shows lower strain
concentration at crack tip for the ML generated designs. . . . . 174
7-5 Performance comparison of training data and ML generated designs. Modulus ratio is the modulus normalized by the highest modulus value in the training data. Toughness ratio is the toughness normalized by the highest toughness value in the training data. The ML designs are generated using the training loops of 1,000 (shown by the green dots) and 1,000,000 (shown by the red dots). Envelopes show that mechanical properties of the ML generated designs exceed those of the training data. . . . . 176
7-6 Patterns observed from ML designs for U1, U2, U3. a), b), and c)
Histogram of unit cell count in designs output from the ML model as a function of effective composite toughness ratio shows that all types of unit cells are essential for design of tougher materials (left). Toughness ratio is the toughness normalized by the highest training data tough-ness value. Geometrical elemental representation of the probability for a specific unit cell showing up in the top 100 designs obtained from ML reveals patterns in designs (right). This shows the essential unit cell for each element position. For all unit cells, there are probabilities close to 1, which signifies that almost all top designs have those specific unit cells in those element positions. . . . . 177 7-7 Additive manufacturing and testing of samples. a) Comparison of
stress-strain response of ML generated 3D-printed sample (ML-opt) to its (Soft and Stiff) building blocks, lowest toughness geometry ob-tained from ML (ML-min), and the maximum toughness geometry from training set (Train-max). 3D-printed designs for opt, ML-min, and Train-max are shown as an inset in the figure. b) Strain field plots obtained from digital image correlation for ML-opt (Top) and ML-min (Bottom). c) Toughness and strength values for the various designs. . . . . 178 A-1 Performance details for top 25 geometries. a) The toughness ratio in
the y-axis is defined as the toughness of a given geometry divided by the lowest toughness of the candidate geometries. The top 25 geometries all have very similar toughness ratios. b) The strength ratio in the x-axis is defined as the strength of a given geometry divided by the lowest strength of the candidate geometries. The top 25 geometries all have very similar strength ratios. This figure is adapted from Ref. [75]. 187
List of Tables
1.1 Material properties of various biomaterials [8,41,72,90,99,116,137,173,
186], RH is relative humidity. This table is adapted from Ref. [78]. . . 42
2.1 Material properties for 3D-printing materials (VeroMagenta and Tan-goBlackPlus). This table is adapted from Ref. [77]. . . . . 63
2.2 Fitting parameters for T(ls) . .. . . . . .
.. .... .. 71
2.3 Fitting parameters for S(ls) . . . . 72 3.1 Mechanical properties for base materials. This table is adapted from
R ef. [80]. . . . . 87
4.1 Droptower testing results. Two different designs based on the natural conch shell microstructure are used to study and compare the effects of hierarchy on impact performance. The Hier-1 design represents the first order of hierarchy in the conch shell. The Hier-2 design represents a second order of hierarchy and contains crisscrossed layers within each
ply. Both designs, in addition to the bulk (stiff) material, are fabricated
using additive manufacturing with the same thickness for all specimens. This table is adapted from Ref. [79]. . . . . 106 5.1 Inputs to the optimization algorithm used in this study. Estf f is the
modulus of the stiff material, Esof is the modulus of the soft material. This table is adapted from Ref. [76]. . . . . 123 A. 1 True volume fraction data for the addition of mineral bridges to
sam-ples. This table is adapted from Ref. [77]. . . . . 185
Chapter 1
Introduction
Parts of the review presented in this chapter have been published in:
" Grace X. Gu, Isabelle Su, Shruti Sharma, Jamie Voros, Zhao Qin, and Markus J. Buehler. Three-dimensional-printing of bio-inspired composites. Journal of Biomechanical Engineering, 138 (2), 2016.
" Jingjie Yeo, Gang Seob Jung, Francisco Martin-Martinez, Shengjie Ling, Grace X. Gu, Zhao Qin, and Markus J. Buehler. Materials-by-design: Computation,
synthesis, and characterization from atoms to structures. Physica Scripta, 93
(5), 2018
1.1
Composites
Many engineering applications have been confined to the use of homogeneous mate-rials in the past, either due to simplicity of design or limitations of manufacturing capabilities. This is evident in many early aircraft structures, automotive vehicles, and spacecrafts, among other applications. With contemporary progression of designs and developments in manufacturing technology, there has been widespread adoption of composites [142, 149]. A composite is defined herein as a material composed of two or more constituent materials with very different physical or chemical properties. The final material usually has characteristics different from the individual
progen-itor components [105, 115]. Composites are preferred over traditional materials for
many reasons, chief among them is the ability to combine desirable properties that usually would not exist together due to instrinsic tradeoffs, making them stronger, lighter, and less expensive [100]. Typical engineering composites include ceramic matrix composites, fiber-reinforced polymers, and other advanced composite
materi-als [105]. Ceramic matrix composites are composed of ceramic fibers embedded in a
ceramic matrix, where the matrix and fibers can consist of any ceramic material [27]. Fiber-reinforced polymers are composed of various layers with fibers running in a certain direction; these layers are then stacked together to make a laminate [35,154]. Composites can also use metal fibers to reinforce other metals, as in metal matrix composites [25]. Additionally, woven fabric composites, another class of composites, consists of longitudinal and transverse laced yarns [5]. Composite design is an ongo-ing topic in materials research and different types of composites are used dependongo-ing on type of application.
1.2
Research problem
Despite advancements in the field of composites, many challenges remain. One chal-lenge is the possibility of delamination at the interface between different layers of the composite [150] as shown in Fig. 1-la. Composites are also very sensitive to impact damage, that can arise from either static or dynamic loading, as shown in Fig. 1-lb [65]. Another challenge is finding methods to design and optimize
com-posites because the design space is very large for comcom-posites which are made up of two or more materials. Due to this large design space, it is virtually impossible to try every single geometry possibility. The grand challenge this thesis addresses is: What are the best design routes for the next generation of composites given these current challenges? This thesis is driven by the current challenges in the compos-ite field and discusses different approaches to composcompos-ite design, for both static and dynamic loading cases. Biomimetic design with algorithmic optimization of hierar-chy and heterogeneity at the scale of microstructural features enables a bottom-up
approach to enhance mechanical properties of composites and can be realized given
recent advances in additive manufacturing technology.
a
b
Figure 1-1: Composite damage patterns. a) Delamination between interface layers in a composite. This figure is adapted from Ref. [150] with no changes. b) Various impact damage consequences in a composite. This figure is reprinted from Ref. [65] with permission from Elsevier.
1.3
Thesis approach
In this thesis, a dual approach to overcome the current challenges in the field of composite materials is implemented. The first approach begins with bio-inspiration,
using secrets from nature - the oldest engineer in the world - to design composites. Capitalizing on millions of years of evolution, nature provides secrets to achieving tough and strong materials, overcoming tradeoffs often encountered in traditional en-gineering materials. As a result, biomimicry-related research work abounds in the literature. Although biomimicry is a great first order approximation, some natural material designs have functions not suitable or needed for engineering applications.
Delamination Impact location
4
1 .Surface buckling
Matrix cracks due to baudtug MatrIx cracks due to shear
Therefore, the second approach in designing composites is to introduce algorithms
aimed at optimizing natures design templates to rationally build composites through traditional optimization approaches and machine learning. A process that incorpo-rates machine learning and optimization to design prototypes fabricated via additive
manufacturing is used. The dual approach conceived here is termed the Bioinspired
Algorithmic-Driven Design (BADD) framework, portrayed graphically in Fig. 1-2.
Bio-inspiration
Bloinspired
Algorithmic
Driven Design
Nature Model Simulation Additive manufacturing Testing & validation Optimization Aragonite ProteinU
4' jA11
Stiff SoftU.MM
U...
U... I
U....
MMMMq
WiI
i U
Figure 1-2: Graphical abstract illustrating the three-pronged approach of bio-inspiration, optimization, and additive manufacturing that makes up the BADD framework. The goal of BADD is to efficiently prototype, test, and appropriate natural designs for design of engineered composites with the same superior mechanical properties boasted by biological composites such as nacre and conch shell. Effectively, BADD works to translate the designs of nature for use by engineers.
W
C!.
Ii
yl
14
Bioinspired materials research aims to investigate natural materials, oftentimes made up of biopolymers and minerals, as they can offer functionalities superior to that of their synthetic counterparts [61]. Previous studies have pointed out that the hierarchical structure of biomaterials is key to their often superior performance
[63,138,140]. For example, nacre, which is made primarily of a hard platelet phase
with a small amount of soft biopolymer phase, has a toughness value that is far greater than the hard platelet phase alone [63]. Spider silk, with its unique molecular structure and nonlinear material behaviors, is strong enough to withstand the weight of a spider and its prey while still being extensible enough to absorb energy from impact and environmental factors, including significant wind loading [40]. However, the difficulty of harvesting such materials in large quantities, such as spider silk, makes it challenging to use them directly for engineering applications. Therefore, it is critical to find alternative ways of designing and mass-producing composites that have material properties and functionalities resembling their natural counterparts for large-scale industrial, commercial, and consumer applications.
The construction of the complex geometries found in nature has been made pos-sible by combining additive manufacturing techniques, such as 3D-printing, with ad-vanced chemical and biological synthesis methods to make novel inks with which to print synthetic materials that mimic constituents found in nature. Viscoelastic inks that can be 3D-printed in a layer-by-layer assembly can be made of hydroxyapatite
(HA) for engineering bone or silk fiber to make intricate geometries. As a result,
the advent of multi-material 3D-printing facilitates engineering biologically inspired composite structures such as nacre, bone, hair, and silk, which feature lightweight ar-chitectures and enhanced properties, such as strength and toughness [22,38,121,205].
Designs of many natural materials follow a form-function relation in which struc-ture dictates properties. At the same time, crucial properties defined by the envi-ronment and survival needs carve out efficient material structures through natural selection. Many of natures materials are optimized for the organisms own survival to aid in tasks including self-cleaning and hunting, for example [61, 202]. Engineering materials, on the other hand, need to meet certain requirements for their applications,
which may include stiffness, strength, toughness, and low weight. Work on optimiza-tion of various materials for high performing mechanical properties is prevalent in lit-erature. Many works are related to optimization of composite laminate designs using genetic algorithms, which are based on evolutionary algorithms and concepts [3,147.
Topology optimization groups strive to optimize properties such as structural compli-ance based on known loads and boundary conditions, showing how an initial starting geometry slowly forms an optimized truss-like structure [85, 89, 165, 176, 177]. Re-searchers have also studied how to optimize composite topologies with three distinct materials for thermal conductivity properties. All these works lead to an emerging trend of materials-by-design in which properties of materials can be tuned to meet desired functionality in application.
Developing 3D-printing techniques to manufacture designs found in nature will make it possible to build materials and structures that are not only optimized for a specific function, but also produced concurrently and with varying architectures across multiple length-scales. Biomimicry already benefits fields such as architecture, engineering, materials science, and medicine. With 3D-printing as a manufacturing tool, we can fabricate more complex customized designs that use several materi-als and complex geometries that previously could not be engineered. For example, through 3D-printing of synthetic spider silk, flexible yet durable sutures can be made to enhance integration of medical implants [109]. Common materials that are usually brittle such as aragonite and HA could be printed in geometric arrangements that enhance their elasticity [126]. 3D-printing can help mimic architectures to create tougher structures, like those found in nacre to make stronger buildings that can withstand natural disasters and extreme environmental conditions. Biomimicry us-ing 3D-printus-ing can also improve conservation and collection of renewable energy [15]. For example, designs of blades of wind turbines inspired by fins, tails, and flippers are expected to increase the annual electrical production by 20% [47]. Taking inspiration from nature to influence 3D-printing of structures will help us overcome limitations in medicine, renewable energy, engineering, and many more fields. The next section will describe a few select biomaterials boasting excellent mechanical properties some