HAL Id: tel-02937263
https://hal.archives-ouvertes.fr/tel-02937263
Submitted on 13 Sep 2020
HAL is a multi-disciplinary open access
archive for the deposit and dissemination of sci-entific research documents, whether they are pub-lished or not. The documents may come from teaching and research institutions in France or
L’archive ouverte pluridisciplinaire HAL, est destinée au dépôt et à la diffusion de documents scientifiques de niveau recherche, publiés ou non, émanant des établissements d’enseignement et de recherche français ou étrangers, des laboratoires
Essays on Son Preference in Pakistan
Rashid Javed
To cite this version:
Rashid Javed. Essays on Son Preference in Pakistan. Economics and Finance. Université de Pau et des Pays de l’Adour, 2019. English. �tel-02937263�
THÈSE
UNIVERSITE DE PAU ET DES PAYS DE L’ADOUR
Ecole Doctorale Sciences Sociales et Humanités
Centre d’Analyse Théorique et de Traitement des données économiques (CATT)
Présentée et soutenue le 22 Juillet 2019
par Muhammad Rashid JAVED
pour obtenir le grade de docteur
de l’Université de Pau et des Pays de l’Adour
Spécialité : Économie
ESSAYS ON SON PREFERENCE IN PAKISTAN
MEMBRES DU JURY
RAPPORTEURS
• Christophe Z GUILMOTO Professor, Paris Descartes University, Paris, France
Director Research Demography, The French National Research Institute for Development (IRD), Paris, France
• Sylvie DUBUC Professor, University of Reading, Reading, United Kingdom (UK) EXAMINATEURS
• Marie-Claire ROBITAILLE Associate Professor, Saint Mary's University, Halifax, Canada • Jacques JAUSSAUD Professor, University of Pau and Pays de l'Adour, Pau, France DIRECTEURS
• Lionel DE BOISDEFFRE Professor of Economics
Director, The National Institute of Statistics and Economic Studies (INSEE), Paris, France
THESIS
University of Pau and Pays de l'Adour
Doctoral School Social Sciences and Humanities
Center for the Analysis of Trade and Economic Transition (CATT)
Presented and defended on July 22, 2019
by Muhammad Rashid JAVED
to obtain the degree of PhD
from the University of Pau and Pays de l'Adour
Specialty: Economics
ESSAYS ON SON PREFERENCE IN
PAKISTAN
MEMBERS OF THE JURY
REPORTERS
• Christophe Z GUILMOTO Professor, Paris Descartes University, Paris, France
Director Research Demography, The French National Research Institute for Development (IRD), Paris, France
• Sylvie DUBUC Professor, University of Reading, Reading, United Kingdom (UK) EXAMINERS
• Marie-Claire ROBITAILLE Associate Professor, Saint Mary's University, Halifax, Canada • Jacques JAUSSAUD Professor, University of Pau and Pays de l'Adour, Pau, France DIRECTORS
• Lionel DE BOISDEFFRE Professor of Economics
Director, The National Institute of Statistics and Economic Studies (INSEE), Paris, France
This work is dedicated,
to my beloved country, Pakistan,
to my beloved grandparents, Mr and Mrs Ch Abdul
Ghafoor (Late), and to my loving parents, Mr and Mrs
Mian Muhammad Arshad.
Acknowledgement
The completion of PhD has been a long journey spanning four years, and it would not have been possible without the special blessing of Almighty Allah, personal efforts and valuable input of several individuals. First of all, I would like to thank my advisor Dr. Lionel De Boisdeffre for accepting me as a PhD student at CATT, UPPA. I am deeply indebted to my co-advisor Dr. Mazhar Mughal for his invaluable guidance, support and encouragement throughout my doctoral studies. He gave me the freedom to work on my own and at the same time provided the critical feedback on my research. He is always available at a distance of an e-mail and phone call which I found very helpful. The completion of my PhD thesis would have been difficult without his unconditional support. I also thank Dr. Charlotte Fontan Sers for collaboration in one of my essay as well as French translation of abstracts of my papers and thesis.
I also want to thank numerous seminar participants and conference attendees for their comments. I am highly indebted to my PhD committee members Dr. Christophe Z Guilmoto and Dr. Sylvie Dubuc for accepting to review my work. Their comments would be highly valuable in pursuing further my research. I would like to thank so many good friends as well as Pakistani community in Pau for providing a warm and friendly atmosphere. Outings with my friends Ehsan, Rehman Khan, Saleem, Saad and Ali Shujaat were a source of respite for
me, and helped me vent my occasional bouts of frustration. I have been lucky to receive encouragement from so many near and dear ones. Last but not least, I would like to thank my parents (Mr and Mrs. Mian Muhammad Arshad), my Uncle (Mian Muhammad Aslam), my siblings and other family members, who kept on backing me throughout this long journey. I would not have made it without them.
Abstract
This thesis is a collection of studies on son preference in Pakistan. The studies analyze the prevalence and strength of son preference and its effects on women’s childbearing. The role son preference plays in determining women’s participa-tion in intra-household decisionmaking is examined as are its effect on birth spacing, probability of risky births and role of maternal age at marriage in mod-ifying gender-specific reproduction and development outcomes. We find strong evidence for both the revealed and stated preference for male offspring. The probability of continuing childbearing also decreases with the number of sons born. Furthermore, we find that women with at least one son have more say in ‘routine’ household decisions but not in financial decisions. Female participation in decision-making grows significantly with the number of sons but only up to the third parity. We find that women with at least one son are more likely to delay succeeding births. We obtain strong evidence at parity 1. The impact seems to dissipate beyond the second parity. Moreover, we find that marriage at 18 or later positively influence women’s preference for family’s sex composition. However, whether or not a woman married early or late does little to modify the male gender bias prevalent in parental investment. In light of these findings, we suggest policy measures that could help improve gender equity in the country.
R´
esum´
e
Ce m´emoire regroupe diff´erentes ´etudes sur la pr´ef´erence pour les gar¸cons au Pakistan. Celles-ci analysent la fr´equence et l’´etendue de la pr´ef´erence pour les gar¸cons et son effet sur la grossesse des femmes. Le rˆole que la pr´ef´erence pour les gar¸cons joue sur la participation des femmes au niveau des d´ecisions au sein du m´enage est examin´e, tout comme son effet sur l’espacement des naissances, la probabilit´e d’une naissance `a risque, ou l’impact de l’ˆage auquel une femme se marie sur l’´equilibre entre les sexes et le d´eveloppement de l’enfant n´e. Nous trou-vons qu’il existe une pr´ef´erence r´eelle et d´eclar´ee pour la prog´eniture masculine au Pakistan. La probabilit´e de poursuivre les grossesses diminue avec le nombre de gar¸cons n´es. De plus, les femmes qui ont au moins un garcon ont plus d’influence sur les d´ecisions quotidiennes du m´enage mais pas sur les d´ecisions financi`eres. La participation des femmes sur les d´ecisions `a prendre au sein du m´enage aug-mente avec le nombre de gar¸cons mais seulement jusqu’`a la troisi`eme naissance. D’ailleurs, les femmes ayant au moins un gar¸con attendent plus longtemps avant d’avoir d’autres enfants. Ce constat est plus particuli`erement vrai dans le cadre d’une premi`ere naissance et il est moins pr´esent `a partir de la deuxi`eme nais-sance. En outre, le fait de se marier `a 18 ans ou plus tard influence de fa¸con positive la pr´ef´erence des femmes sur la composition de sa famille. Pourtant, peu importe qu’une femme se marie avant ou apr`es 18 ans, cela ne modifie pas le biais en faveur des gar¸cons dans leur investissement parental. A partir de ces r´esultats, nous proposons des pr´econisations politiques afin de lutter contre les in´egalit´es entre les sexes au Pakistan.
Contents
Abstract iv
R´esum´e v
List of Tables ix
List of Figures xii
1 Introduction 1
1.1 Foreword. . . 2
1.2 Overview of Pakistan’s Demography. . . 4
1.3 Son Preference in Pakistan . . . 6
1.4 Overview of Related Literature . . . 7
1.5 Objectives . . . 10
1.6 Data . . . 10
1.7 Definitions and Measurement of Son Preference Indicators . . . . 11
1.8 Thesis Outlines . . . 12
Bibliography . . . 12
2 My Son, My Moon: Son Preference and Demand for Male Child in Pakistan 15 Abstract . . . 16
R´esum´e . . . 17
2.1 Introduction . . . 18
2.2 Data and Methodology . . . 20
2.2.1 Data Description . . . 20
2.2.2 Methodology . . . 21
2.2.3 Techniques Employed . . . 24
2.3 Son Preference . . . 26
2.3.1 Sex Ratio . . . 26
2.3.2 Sex Ratio at Birth . . . 29
2.3.3 Sex Ratio at Last Birth . . . 32
2.3.4 Parity Progression Ratio . . . 32
2.3.6 Desired Preference . . . 34
2.4 Son Preference and Subsequent Childbearing . . . 36
2.4.1 Actual Fertility . . . 36
2.4.2 Stated Fertility Intentions . . . 44
2.5 Discussion and Conclusion . . . 44
Bibliography . . . 45
3 Have a Son, Gain a Voice: Son Preference and Female Partici-pation in Household Decision Making 50 Abstract . . . 51
R´esum´e . . . 52
3.1 Introduction . . . 53
3.2 Conceptual Framework . . . 58
3.3 Female Decision Making in Pakistan . . . 60
3.4 Data and Methodology . . . 64
3.4.1 Model and Data Description . . . 64
3.4.2 Methodology . . . 65
3.5 Results . . . 70
3.6 Sensitivity and Robustness Measures . . . 76
3.6.1 Alternative Measures for Participation in Decision Making 76 3.6.2 Role of Sex-Selective Abortion . . . 77
3.6.3 Selection by Wealth, Woman’s Education and Age and Family Size . . . 82
3.6.4 Matching Estimations . . . 83
3.6.5 Role of Woman’s Health . . . 90
3.6.6 Alternative Controls . . . 94
3.6.7 Other Measures of Female Agency. . . 94
3.6.8 Placebo Tests . . . 97
3.6.9 Testing Multiple Hypotheses . . . 98
3.7 Concluding Remarks . . . 100
Bibliography . . . 102
4 Son Preference, Parity Transition and Birth Spacing in Pakistan106 Abstract . . . 107
R´esum´e . . . 108
4.1 Introduction . . . 109
4.2 Overview of Related Literature . . . 112
4.3 Overview of Birth Spacing Among Pakistani Couples . . . 114
4.4 Empirical Strategy . . . 116
4.4.1 Data Description . . . 116
4.4.2 Methodology . . . 118
4.4.3 Econometric Techniques . . . 121
4.5.1 Son Preference and Spacing . . . 125
4.5.2 Son Preference and Short Birth Intervals . . . 133
4.5.3 Characteristics of Son-Preferring Households with Differ-ential Spacing . . . 135
4.6 Robustness Measures . . . 140
4.6.1 Alternative Parametric Estimations . . . 140
4.6.2 Self Selection by Child Mortality . . . 142
4.6.3 Matching Estimates. . . 143
4.6.4 Placebo Test . . . 145
4.7 Conclusion . . . 146
Bibliography . . . 147
5 Female Age at Marriage, Gender Preference and Differential Parental Investment 151 Abstract . . . 152 R´esum´e . . . 153 5.1 Introduction . . . 154 5.2 Data . . . 157 5.3 Empirical Framework . . . 158 5.3.1 Model . . . 158 5.3.2 Estimation Techniques . . . 162 5.4 Findings . . . 166
5.4.1 Differential Gender Preference . . . 166
5.4.2 Differential Parental Investment . . . 169
5.5 Robustness Measures . . . 175
5.6 Conclusion . . . 177
Bibliography . . . 179
6 Conclusion 184 6.1 What Have We Learnt So Far . . . 185
6.2 Policy Implications . . . 187
6.3 Limitations and Future Research Perspectives . . . 189
Bibliography . . . 190
Appendix: Chapter 2 192
Appendix: Chapter 3 195
Appendix: Chapter 4 200
List of Tables
2.1 Data description . . . 22
2.2 Child sex ratio . . . 28
2.3 Sex ratio by number of children born . . . 29
2.4 Sex ratio by child loss . . . 30
2.5 Sex ratio at last birth . . . 33
2.6 Parity progression ratio . . . 33
2.7 Desired sex ratio . . . 35
2.8 Desired preference (PDHS 2012-13) . . . 36
2.9 Desired preference by ideal family size . . . 37
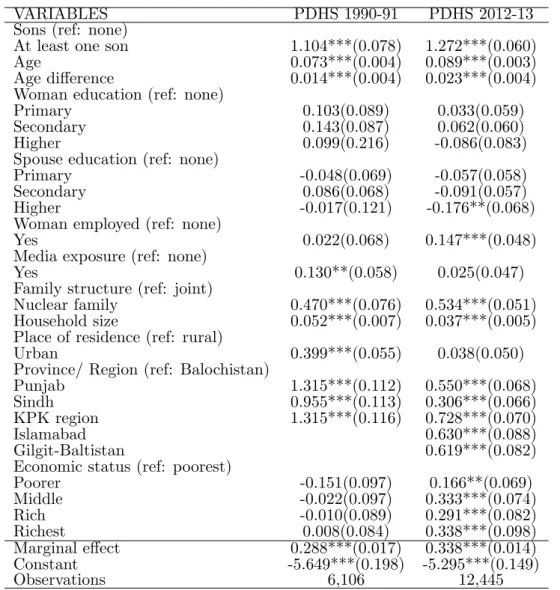
2.10 Presence of at least one son and subsequent birth – probit estimation 39 2.11 Presence of at least one son and subsequent birth - Propensity score matching . . . 40
2.12 Presence of at least one son and subsequent birth – IPW and AIPW estimates. . . 41
2.13 Son ratio and subsequent birth – probit estimation . . . 42
2.14 Number of sons and subsequent birth – probit estimation . . . 43
2.15 Presence of at least one son and stated completed fertility -probit estimation . . . 46
2.16 Presence of at least one son and completed fertility (husband’s statement) - probit estimation . . . 47
3.1 Household decision making . . . 63
3.2 Data description . . . 66
3.3 Son preference and female participation in decisionmaking – probit estimation . . . 68
3.4 Number of sons and female participation in decision making – probit estimation . . . 69
3.5 Son preference and female participation in decisionmaking (parity wise) – probit estimation . . . 71
3.6 Sex at first birth and female participation in decisionmaking – probit estimation . . . 72
3.7 Sex at last birth and female participation in decisionmaking – probit estimation . . . 73
3.8 Son Preference and female participation in decisionmaking (by
Age at marriage)-Probit estimation . . . 75
3.9 Son preference and female participation in decisionmaking – Or-dered probit estimations . . . 78
3.10 Number of sons and female participation in decision making – Ordered probit estimations . . . 79
3.11 Son preference and female participation in decisionmaking (parity wise) – Ordered probit estimations . . . 80
3.12 Son preference and female participation in decisionmaking (by pregnancy loss) – probit estimation . . . 81
3.13 Selection Bias: Younger women (Aged 25 or less) and women with schooling – Probit estimates . . . 84
3.14 Selection bias: Household wealth and sex of firstborn – Probit estimates. . . 85
3.15 Son Preference and female participation in decisionmaking - PSM estimates. . . 86
3.16 Son Preference and female participation in decisionmaking (Parity wise) - PSM estimates . . . 87
3.17 Son Preference and female participation in decisionmaking – IPW and AIPW estimates . . . 89
3.18 Checking balance of confounders between treated and untreated-PSM . . . 90
3.19 Sensitivity analysis-Son preference and female participation in house-hold decision making . . . 91
3.20 Sensitivity analysis-Son preference and female participation in house-hold decision making-Parity Wise . . . 92
3.21 Son Preference and female participation in decisionmaking (women with ‘unhealthy’ BMI) - probit estimation . . . 93
3.22 Son Preference and female participation in decisionmaking (num-ber of children as control) – probit estimation . . . 95
3.23 Son Preference and female participation in decisionmaking (Alter-native wealth indicator) – probit estimation . . . 96
3.24 Son preference and other measures of female empowerment (woman’s BMI and labour force participation) . . . 97
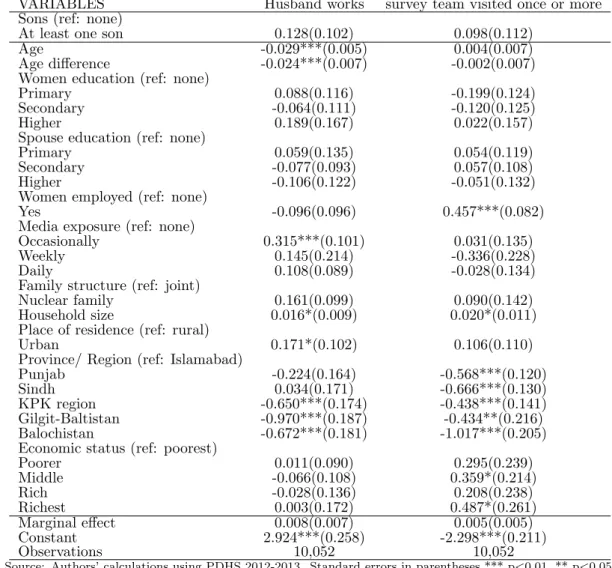
3.25 Son Preference and consanguineous marriages – probit estimations 99 3.26 Son Preference, spouse’s employment status and number of visits by the survey team – probit estimations . . . 100
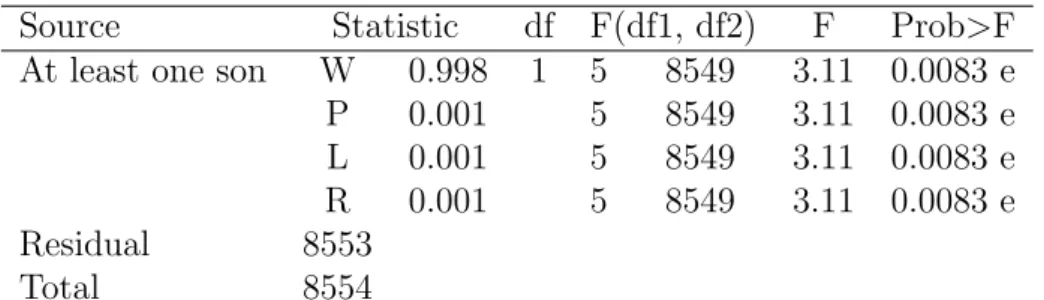
3.27 Multivariate analysis of variance and covariance . . . 101
3.28 Bonferroni correction . . . 101
4.1 Overview of Average Birth Spacing . . . 115
4.2 Proportion of risky birth spacing (below 24 and 18 months) . . . 116
4.4 Definition and measurement of variables . . . 119
4.5 Descriptive Statistics . . . 120
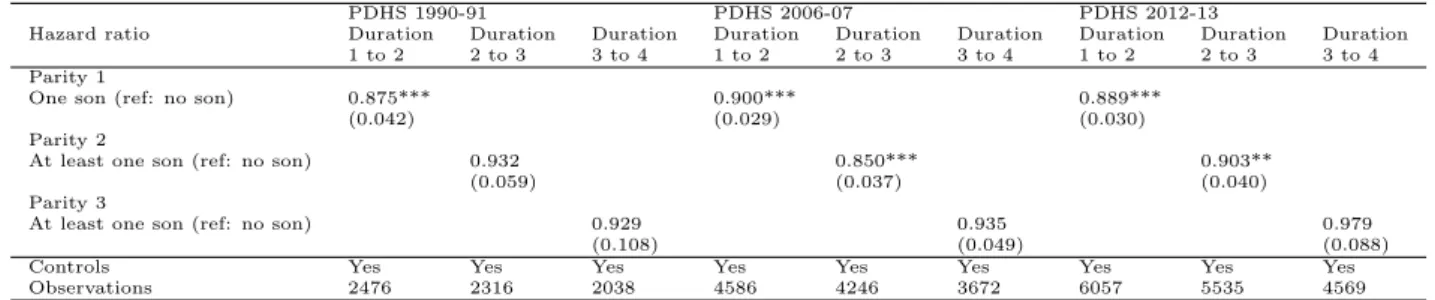
4.6 Presence of at least one son at parity n and subsequent birth spacing (Cox estimation) . . . 126
4.7 Number of sons at parity n and subsequent birth spacing (Cox estimation) . . . 131
4.8 Son Preference and Last birth spacing (Cox estimation) . . . 131
4.9 Presence of at least one son at parity n and subsequent birth spacing (Survival-time regression adjustment) . . . 132
4.10 Son to total children ratio and overall birth spacing (Cox estimation)133
4.11 Sex of first child and overall birth spacing (Cox estimation) . . . . 133
4.12 Presence of at least one son and current contraceptive use - probit estimation . . . 134
4.13 Preference of at least one son and short birth spacing (Probit estimations) . . . 135
4.14 Presence of at least one son at parity n and subsequent birth spacing – poor vs non-poor households (Cox estimation) . . . 137
4.15 Presence of at least one son at parity n and subsequent birth spacing - wealthy vs non-wealthy households (Cox estimation) . . 138
4.16 Presence of at least one son at parity n and subsequent birth spacing by family type (Cox estimation) . . . 139
4.17 Presence of at least one son at parity n and subsequent birth spacing by consanguineous marriages (Cox estimation) . . . 140
4.18 Presence of at least one son at parity n and subsequent birth space by place of residence (Cox estimation) . . . 141
4.19 Presence of at least one son at parity n and subsequent birth spacing by woman’s age at marriage (Cox estimation) . . . 142
4.20 Presence of at least one son at parity n and subsequent birth spac-ing by participation in household decisionmakspac-ing (Cox estimation) 143
4.21 Presence of at least one son at parity n and subsequent birth spacing by participation in healthcare decisions (Cox estimation) . 144
4.22 Presence of at least one son at parity n and subsequent birth spacing (Parametric survival model) . . . 145
4.23 Presence of at least one son at parity n and subsequent birth spacing – Subsample with no child loss (Cox estimation) . . . 145
4.24 Presence of at least one son at parity n and subsequent birth spacing (Propensity score matching) . . . 146
4.25 Placebo test – Month of interview as outcome (Cox estimation) . 146
5.1 Individual and household characteristics by age at marriage. . . . 157
5.2 Data description (Outcomes). . . 163
5.3 Data description (Controls) . . . 164
5.5 Female age at Marriage and son preference – Probit estimations . 167
5.6 Female age at marriage and son preferences - individual and house-hold characteristics . . . 170
5.7 Female age at marriage and child outcomes . . . 171
5.8 Female age at marriage and birth and post-natal healthcare . . . 173
5.9 Female age at marriage and child nutrition . . . 173
5.10 Female age at marriage and child development outcomes . . . 174
5.11 Female age at cohabitation and preference for boys . . . 176
5.12 Female age at cohabitation and birth and post-natal child healthcare177
5.13 Female age at cohabitation and child nutrition . . . 177
5.14 Female age at cohabitation and child development outcomes . . . 178
5.15 Female age at marriage subgroups and preference for boys . . . . 178
5.16 Female age at marriage and preference for boys - Propensity Score Matching . . . 179
5.17 Female age at marriage and preference for boys – IPW and AIPW estimates. . . 180
A1 Summary of the two datasets . . . 192
B1 Son preference and female participation in decisionmaking (with age square interaction effect) – probit estimation. . . 196
List of Figures
1.1 Population of Pakistan (1951-2017) . . . 4
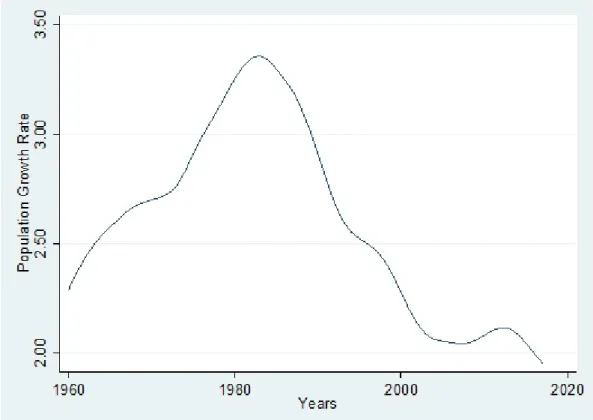
1.2 Trend of population growth rate Pakistan (1960-2017) . . . 5
1.3 Trend of total fertility rate (births per woman) 1960-2017 . . . 6
1.4 Trend of Birth Rate, Crude (per 1,000 people) 1960-2017 . . . 7
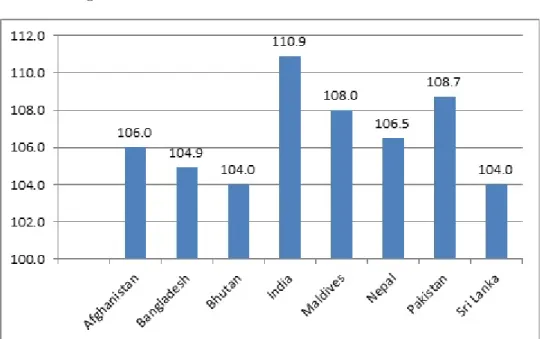
1.5 Trend of mortality rate, infant (peer 1,000 live births) 1960-2015 . 8 2.1 Sex ratio of South Asian countries . . . 26
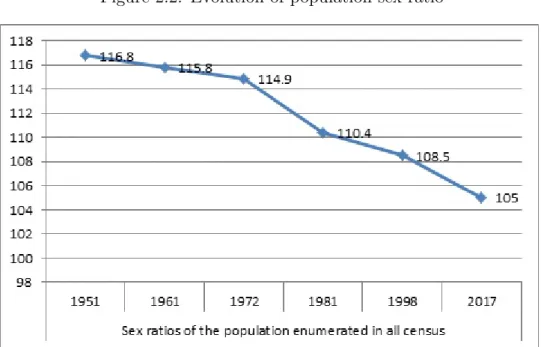
2.2 Evolution of population sex ratio . . . 27
2.3 Sex ratio at birth - South Asian countries. . . 31
2.4 Sex ratios at birth - 1990-91 – 2012-13 . . . 31
3.1 Top ten populous countries ranked according to Gender Inequality Index 2014 . . . 61
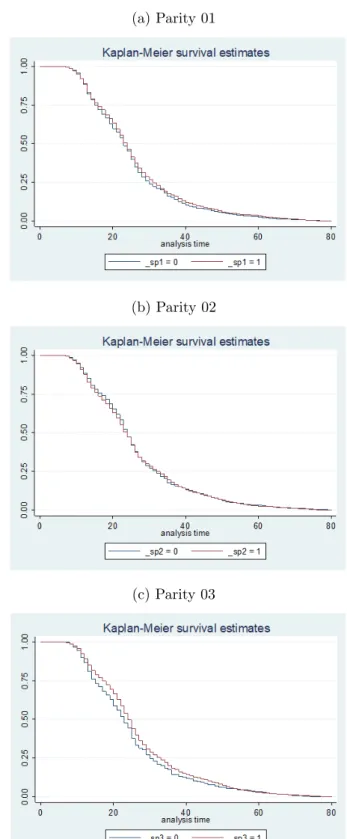
4.1 Presence of at least one son at parity n and subsequent birth spacing (Kaplan-Meier cumulative survival graph: PDHS 1990-91) 127 4.2 Presence of at least one son at parity n and subsequent birth spacing (Kaplan-Meier cumulative survival graph: PDHS 2006-07) 128 4.3 Presence of at least one son at parity n and subsequent birth spacing (Kaplan-Meier cumulative survival graph: PDHS 2012-13) 129 5.1 Incidence of early marriage in the developing world . . . 155
A1 Kernel density plots after Propensity score matching (PDHS 1990-91) . . . 193
A2 Kernel density plots after Propensity score matching (PDHS 2012-13) . . . 194
B1 Density distribution for the estimated propensity scores for having no son and having at least one son households . . . 197
B2 Density distribution for the estimated propensity scores for having no son and having at least one son (Parity≤ 3). . . 198
B3 Density distribution for the estimated propensity scores for having no son and having at least one son (Parity>3) . . . 199
C1 Presence of at least one son at parity n and subsequent birth spacing – poor vs non-poor households (Kaplan-Meier cumulative survival graph) . . . 201
C2 Presence of at least one son at parity n and subsequent birth spacing - wealthy vs non-wealthy households (Kaplan-Meier cu-mulative survival graph) . . . 202
C3 Presence of at least one son at parity n and subsequent birth spacing by family type (Kaplan-Meier cumulative survival graph) 203
C4 Presence of at least one son at parity n and subsequent birth spacing by consanguineous marriages (Kaplan-Meier cumulative survival graph) . . . 204
C5 Presence of at least one son at parity n and subsequent birth space by place of residence (Kaplan-Meier cumulative survival graph) . 205
C6 Presence of at least one son at parity n and subsequent birth spac-ing by age at marriage (Kaplan-Meier cumulative survival graph) 206
C7 Presence of at least one son at parity n and subsequent birth spac-ing by participation in decisionmakspac-ing (Kaplan-Meier cumulative survival graph) . . . 207
C8 Presence of at least one son at parity n and subsequent birth spac-ing by participation in healthcare decisions (Kaplan-Meier cumu-lative survival graph) . . . 208
C9 Kernel density plots after Propensity score matching (PDHS 1990-91) . . . 209
C10 Kernel density plots after Propensity score matching (PDHS 2006-07) . . . 210
C11 Kernel density plots after Propensity score matching (PDHS 2012-13) . . . 211
D1 Kernel density plots after Propensity score matching (PDHS 1990-91) . . . 213
D2 Kernel density plots after Propensity score matching (PDHS 2012-13) . . . 214
Chapter 1
Introduction
1.1
Foreword
Son preference i.e. parents wanting one or more sons has been age-old phe-nomenon and is widespread around the world. Son preference is a dimension of patrilineage in a patriarchal society. There are a number of economic, social and religious reasons for preferring sons over daughters:
Parents consider sons as economic asset and old age insurance as the son stays with the household and significantly contribute to the household economy and provide the parents old age support and care. This is of particular relevance in developing countries where there is lack of insurance markets and social safety nets.
Daughters, in contrast, are considered an economic burden for the household: parents must save for their dowry, and they leave home to join their husbands in a virilocal setup; their financial and human capital thus becoming property of their marital household.
Sons, in contrast, continue the family legacy. In some societies, important reli-gious activities can only be performed by sons(Lin and Adser`a, 2013). Moreover, in some cultures only sons are allowed to inherit family assets (Zimmermann, 2012).
This practice of son preference has important economic and demographic con-sequences. Son preference demonstrates itself in such sex-selection methods as differential stopping behaviour, sex-selective abortion and female infanticide. In an early study on the issue, A. Sen (1990) pointed to the millions of girls missing and surplus of boys in such societies due to such practices. Since the 1990s a number of countries in East, South and West Asia, have witnessed abnor-mal rise in the proportion of abnor-male births relative to feabnor-male births (Guilmoto and Tove, 2015). This proportion is called sex ratio at birth (SRB) in demography,
which refers to the number of live male births for every 100 female births in a given year. Sex ratio at birth (SRB) in these countries is skewed due to prenatal sex selection, generally in the form of sex-selective abortion (Bongaarts, 2013). Where the sex-selection methods are unavailable or less accessible parent’s fer-tility remains incomplete until and unless the desired number of sons are born. Discontinuity of fertility after attaining at least one son or desired number of sons plays a not unsubstantial role in high population growth rate1. Women in such societies who bear sons enjoy higher say within household while those who do not succeed in bearing a son face social stigma and pressure at home leading to domestic violence or divorce.
In son preferring countries daughters fare worse than sons’ in many dimensions. According to (Suarez, 2018), Son preference in those countries is visible in par-ents’ underinvestment in their daughters’ care in contrast to their sons’. Male children are more likely to have better health and educational outcomes than female children.
Girls receive less health care, less breastfed and less likely to be fully immunized than boys (Basu, 1989; Borooah, 2004; Hafeez and Quintana-Domeque, 2018; Jayachandran and Kuziemko, 2011).
Though son preference is widespread in Pakistan but it remains an under-researched area2.
In this thesis, we attempt at bridging the gap in empirical literature by taking up some of the empirical questions on son preference in the context of Pakistan.
1Developing countries face many problems and high population growth is one of them. 2For instance, Google Scholar shows only 12 unique results for studies on son preference in Pakistan during the last five decades.
1.2
Overview of Pakistan’s Demography
Pakistan is a developing country located in the South Asia and covers the to-tal area of 796,096 square kilometres and 1200 square kilometres of coastline. Pakistan is the sixth most populous country in the world, and the fourth most populous in Asia.
According to 2017 census, Pakistan population was 207 million. Since the first census in 1951, Pakistan’s population has grown six-folds.
Figure 1.1: Population of Pakistan (1951-2017)
Source: Pakistan Bureau of Statistics 2018.
Figure 1.2 shows the trend of population growth rate (PGR) of Pakistan from 1960 to 2017. The average population growth rate from 1960 to 2017 is a high 2.59 %. The country saw extremely high rates of population growth (close to or above 3%) during the 1960s, 70s and 80s. From the mid-1980s, the PGR began declining, and has gradually dropped to 1.95% now (World Bank 2018). This rate is still high by regional and world standard.
Figure 1.2: Trend of population growth rate Pakistan (1960-2017)
Source: Author’s calculations using World Bank World Development Indicators (2017).
Pakistan has seen a notable reduction in total fertility rate (TFR) over last six decades. Trend of Pakistan TFR over the period 1960 to 2017 has shown in
figure 1.3. The highest TFR of 6.61 was noted for the period of 1972 to 1976. Since then, the country’s TFR has declined to 3.48 today.
The trend of Pakistan’s crude birth rate (CBR) is shown infigure 1.4. Pakistan’s CBR slowly decline from a high 44.18 in the 1960. The falling trend gained speed during the 1970s and the 80s. The decrease has slowed down since the mid-2000. The country’s CBR currently stands at 28.2.
Pakistan’s infant mortality rate too remains high (61 in 2017). This rate was close to 200 in the 1960s (Figure 1.5).
Figure 1.3: Trend of total fertility rate (births per woman) 1960-2017
Source: Author’s calculations using World Bank World Development Indicators (2017)
1.3
Son Preference in Pakistan
Like many countries in Asia, Pakistan has a strong patriarchal household struc-ture (Sathar et al., 2015). Families in many parts of the country need to pay large dowries at the time of wedding of their daughters. Sex ratio at birth is skewed at 109 boys per 100 girls. According to Pakistan demographic and health survey estimates, Pakistan’s sex ratio at birth increased from 105 in 1990-91 to 108 in 2012-13. Sex ratio at last birth, another indicator of son preference, also increased from 117 to 133 during the same period. Bongaarts (2013) study ranked Pakistan is second highest desire son preferring country out of 61 coun-tries examined. Despite this high son preference reflected in different indicators in Pakistan,Zaidi and Morgan (2016)found no evidence of sex-selective abortion. However, they found that parity progression did get affected by son preference.
Figure 1.4: Trend of Birth Rate, Crude (per 1,000 people) 1960-2017
Source: Author’s calculations using World Bank World Development Indicators (2017)
1.4
Overview of Related Literature
Written accounts of female infanticide in the Indian Subcontinent go as far back as the late eighteenth century (Bhatnagar, Dube, and Dube, 2005). From the mid-nineteenth century, officers of the British East India Company began iden-tifying Indian tribes and castes practicing traditions of female infanticide. The 1921 population census carried out by the colonial British India government classified castes into two categories, namely, castes having “a tradition” of female infanticide and castes without such a tradition’ (Vishwanath, 2004).
The province of Punjab, which extends over large parts of today’s central Pak-istan and north-western India, was considered the land of missing girls (Purewal, 2010). In 1851, it was reported that 400 Sikh Khatri families had destroyed all
Figure 1.5: Trend of mortality rate, infant (peer 1,000 live births) 1960-2015
Source: Author’s calculations using World Bank World Development Indicators (2017)
their female children from the last 400 years3. Female infanticide was reported to
be common among the Kharral tribe in Montgomery district (present-day Sahi-wal in Pakistani Punjab).
The practice of female infanticide was considered to be less common among Mus-lims. M. Gubbins, a British colonial official, stated: “The Mussulman is found to sympathize least with child-murder”(S. Sen, 2002). The 1870 Female infanticide act declared the practice of female infanticide as illegal.
Although female infanticide is practically inexistent in present-day Pakistan, other manifestations of son preference persist. In an early empirical study on
3In the words of Purewal (2010): “The Bedis, a Sikh khatri caste who claimed direct des cendancy to Guru Nanak and who were ranked highly among other Sikh khatri families, received girls from other lower- ranking khatri families but refused to marry their daughters to boys from lower-ranked families and hence resorted to female infanticide”
the country, Khan and Sirageldin (1977) analysed data from a national survey conducted in 1968-1969 and reported the presence of strong son preference both among men and women.
Ali (1989) employed the Pakistan national survey 1979-80 for his analysis and suggested that having at least one son in the family influenced the demand for additional children. In the same vein, Hussain, Fikree, and Berendes (2000) con-cluded that sex of surviving children in Karachi, Pakistan was strongly correlated with subsequent fertility and contraceptive behaviour.
Zaidi and Morgan (2016)found no significant evidence for large-scale sex-selective abortion in Pakistan and suggested that couples mainly relied on continuing fer-tility to attain the desired number of sons.
In another recent study,Hafeez and Quintana-Domeque (2018)examined gender-biased breastfeeding patterns in Pakistan and showed that breastfeeding duration increased monotonically with the birth order of the child and at every birth or-der, boys were breastfed longer than girls. Saeed (2015)concluded that being an agricultural or non-agricultural households, family type, urban or rural residence, women’s education and inter-cousin marriages were the major factors determin-ing son preference in Pakistan.
Although some of the aforementioned studies discuss fertility outcomes of son preference, there is need for a comprehensive analysis of the son preference phe-nomenon prevalent in Pakistan and its effect on fertility based on detailed nation-wide data.
1.5
Objectives
In this thesis, I examine a number of questions to understand manifestations of son preference in Pakistan:
What is the extent and strength of son preference in the country? What are its ef-fects on women’s childbearing? What is the role of son preference in determining women’s participation in intra-household decisionmaking? Does preference for sons affect birth spacing or increase the probability of risky births? Does female age at marriage modify gender-specific reproduction and development outcomes? This study aims at analyzing these questions in the light of recent evidence.
1.6
Data
The data used in this thesis is obtained from the Pakistan Demographic and Health Survey (PDHS). PDHS are nationally- representative household-level sur-veys. This survey contains comprehensive information about fertility and repro-ductive behaviour of ever-married Pakistani women aged 15-49. The primary objective of this survey to provide national and provincial level data on popu-lation and health in Pakistan. These household surveys are conducted by the National Institute of Population Studies, Islamabad (NIPS) with technical and financial assistance from United States Agency for International Development (USAID).
The first round of the survey (PDHS 1990-91) is based on interviews with 6,611 women from 7,193 households. A two-stage stratified sample design was adopted with 407 primary sample units (PSU), 225 of which were from urban areas and 182 from rural areas. The second round (PDHS 2006-07) was the largest house-hold based survey ever conducted in Pakistan. This round interviewed 10,023
women from 95,441 households and it adopted a two-stage, stratified, random sample design with 1000 primary sample units (PSU)- 390 in urban areas and 610 in rural areas. The third round (PDHS 2012-13) covers 13,558 women from 12,943 households. This sample adopted two-stage stratified sample design with 500 PSU, 248 from urban areas and 252 from rural areas.
In this thesis, we employ all three rounds of PDHS.
1.7
Definitions and Measurement of Son
Pref-erence Indicators
The measurement of son preference has been a challenging task. A number of indicators have been used in this thesis according to nature of research question. Both stated and revealed indicators of son preference are employed in light of objectives of the study:
The presence of at least one son (Binary form, takes the value of 1 if female have at least 1 son, 0 otherwise, son ratio (Proportion of boys in the total number of children), number of sons (Categorical form, number of sons at parity n (Number of sons at given parity n in total number of children born to a woman), and ideal sex composition (Dummy variable, takes the value of 1 if ideal number of boys is reported to be greater than ideal number of girls, 0 otherwise ) have been used as a proxies of son preference. Sample is restricted according to nature of research question and survey weights used to ensure the representativeness of the survey.
1.8
Thesis Outlines
There are total six chapters of this thesis. Chapter 1 and 6 are the introductory and concluding chapters while Chapters 2-5 contain empirical analysis.
After a brief introduction in Chapter 1, Chapter 2 examines the prevalence and strength of the son preference phenomenon and its effect on Pakistani women’s fertility transition. Chapter 3 analyze the effects of observed preference for sons on women’s participation in intra-household decisionmaking. Chapter 4 addresses how preference for sons affects subsequent birth-spacing. Chapter 5 examine the effect of maternal age at marriage on son preference and gender bias. The last chapter 6 sums up the discussion and considers some policy implications.
Bibliography
Ali, Syed Mubashir (1989). “Does son preference matter?” In: Journal of biosocial science 21.4, pp. 399–408.
Basu, Alaka Malwade (1989). “Is discrimination in food really necessary for ex-plaining sex differentials in childhood mortality?” In: Population studies 43.2, pp. 193–210.
Bhatnagar, R. D., R. Dube, and R. Dube (2005). Female infanticide in India: a feminist cultural history. Ed. by R. D. Bhatnagar, R. Dube, and R. Dube. Albany, USA: State University of New York Press.
Bongaarts, John (2013). “The implementation of preferences for male offspring”. In: Population and Development Review 39.2, pp. 185–208.
Borooah, Vani K (2004). “Gender bias among children in India in their diet and immunisation against disease”. In: Social science & medicine 58.9, pp. 1719– 1731.
Guilmoto, Christophe Z and James Tove (2015). “The masculinization of births. Overview and current knowledge”. In: Population 70.2, pp. 185–243.
Hafeez, Naima and Climent Quintana-Domeque (2018). “Son preference and gender-biased breastfeeding in Pakistan”. In: Economic Development and Cul-tural Change 66.2, pp. 179–215.
Hussain, R, Fariyal F Fikree, and HW Berendes (2000). “The role of son prefer-ence in reproductive behaviour in Pakistan”. In: Bulletin of the World Health Organization 78, pp. 379–388.
Jayachandran, Seema and Ilyana Kuziemko (2011). “Why do mothers breastfeed girls less than boys? Evidence and implications for child health in India”. In: The Quarterly journal of economics 126.3, pp. 1485–1538.
Khan, M Ali and Ismail Sirageldin (1977). “Son preference and the demand for additional children in Pakistan”. In: Demography 14.4, pp. 481–495.
Lin, Tin-chi and Al´ıcia Adser`a (2013). “Son preference and childrenˆas housework: the case of India”. In: Population research and policy review 32.4, pp. 553– 584.
Purewal, Navtej K (2010). Son preference: Sex selection, gender and culture in South Asia. Berg.
Saeed, Sadia (2015). “Toward an explanation of son preference in Pakistan”. In: Social Development Issues 37.2, pp. 17–36.
Sathar, Zeba A et al. (2015). Evidence of son preference and resulting demo-graphic and health outcomes in Pakistan. Population Council Islamabad, Pak-istan.
Sen, Amartya (1990). “More than 100 million women are missing”. In: The New York Review of Books 37.20, pp. 61–66.
Sen, Satadru (2002). “The savage family: colonialism and female infanticide in nineteenth-century India”. In: Journal of Women’s History 14.3, pp. 53–79. Suarez, Paola A (2018). “Child-bride marriage and female welfare”. In: European
Journal of Law and Economics 45.1, pp. 1–28.
Vishwanath, LS (2004). “Female infanticide: The colonial experience”. In: Eco-nomic and Political Weekly, pp. 2313–2318.
Zaidi, Batool and S Philip Morgan (2016). “In the pursuit of sons: Additional births or sex-selective abortion in Pakistan?” In: Population and development review 42.4, p. 693.
Zimmermann, L (2012). Itˆasa boy! Women and non-monetary benefits from a son in India (No. IZA Discussion Paper No. 6847).
Chapter 2
My Son, My Moon: Son
Preference and Demand for Male
Child in Pakistan
A version of this paper is under review in a peer-reviewed journal. This study beneted from discussions with the participants of the 2019 British Society for Population Studies conference, Cardiff, UK. We are grateful to Charlotte Fontan Sers for her French translation of the abstract.
Abstract
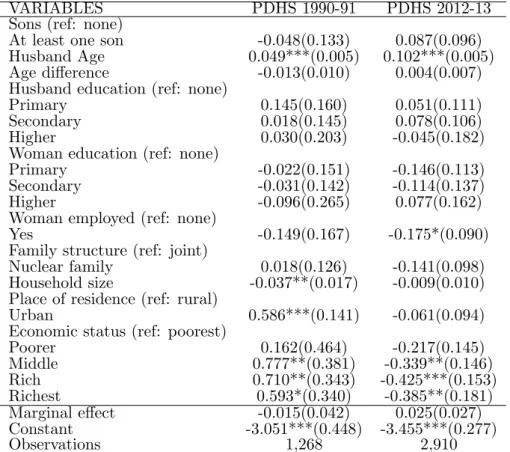
Son preference is widespread in Pakistan. This study examines the prevalence and strength of the phenomenon and its effect on Pakistani women’s fertility transition. We employed data from nationwide demographic and health surveys for the years 1990-91 and 2012-13 and used probit and matching econometric techniques. We generated a number of indicators to chart the change in revealed and stated preference for male children over time. We find strong evidence for both the revealed and the stated preference for male offspring. Son preference persists in Pakistan and its impact on actual and stated fertility is still strong. Although the country’s overall sex ratio has fallen, the sex ratio at birth and sex ratio at last birth have increased indicating an increased reliance on differential birth stopping. Son preference decreases with couple’s level of education. It is more intense among middle-class and rural households. The stated desire for sons has also come down. The likelihood of second birth does not vary with the sex of the first-born. In contrast, women with one or more sons at higher parities are upto 14% less likely to pursue additional fertility compared with women with no sons. The probability of continuing childbearing also decreases with the number of sons born. Besides, women with one or more sons are 29 to 34% more likely to desire no more children. These findings help explain the country’s skewed sex ratios and the slow rate of demographic transition.
Keywords: Son preference; Subsequent birth; Fertility; Parity progression; Pakistan.
R´
esum´
e
Cette ´etude cherche `a mesurer la pr´evalence et l’intensit´e de la pr´ef´erence pour les gar¸cons ainsi que son impact sur la transition en mati`ere de fertilit´e des femmes au Pakistan. L’analyse a ´et´e r´ealis´ee `a partir d’enquˆetes d´emographiques et de sant´e sur les ann´ees 1990-91 et 2012-13 en utilisant des methods ´econom´etriques de probit et d’appariement. Nous avons cr´e´e plusieurs indicateurs afin de suivre l’´evolution de la pr´ef´erence r´eelle et d´eclar´ee pour les gar¸cons. Nous trouvons qu’il existe une pr´ef´erence r´eelle et d´eclar´ee pour la prog´eniture masculine au Pakistan. La pr´ef´erence pour les gar¸cons est toujours pr´esente dans ce pays et son impact sur la fertilit´e observ´ee et d´eclar´ee est forte. Bien que pour l’ensemble du pays le ratio global des sexes et la volont´e d´eclar´ee d’avoir des gar¸cons aient diminu´e, le ratio des sexes `a la naissance et `a la derni`ere naissance a augment´e, indiquant une d´ependance accrue pour l’arrˆet de reproduction diff´erenci´e. Nous constatons que la pr´ef´erence pour les gar¸cons diminue en fonction du niveau d’´education des parents. De plus elle est plus forte aupr`es des classes moyennes et des m´enages ruraux. La probabilit´e d’une deuxi`eme naissance ne varie pas en fonction du sexe du premier n´e. En revanche, par la suite, les femmes avec au moins un gar¸con ont jusqu’`a 14% moins de chances de poursuivre leur fertilit´e par rapport aux femmes sans gar¸cons. La probabilit´e de poursuivre une grossesse diminue ´egalement selon le nombre de gar¸cons n´es. De plus les femmes avec au moins un gar¸con ont entre 29 et 34% plus de chances de ne plus vouloir d’enfants. Ces r´esultats permettent d’expliquer le ratio de sexe biais´e du pays et son faible taux de transition d´emographique.
Mots cl´es: Pr´ef´erence pour les gar¸cons; Naissance suivante ; Fertilit´e; Evo-lution de la parit´e; Pakistan.
2.1
Introduction
“Early harvest and early sons are always better”. (A Pakistani proverb)
The practice of preferring sons over daughters is widespread in South and East Asia. In the patriarchal societies of Asia, sons are considered an asset: sons carry forward the family name, take up family business, care for parents in their old age and protect and provide for the dependent members in the extended family. In societies with a dowry-based virilocal setup, sons add to family assets through marriage. Daughters, in contrast, are conceived as a financial liability as the family is required to prepare sufficient dowry for their wedding. They represent femininity and thus weakness and will one day belong to the home of another man and should thus be seen as a futile investment (Purewal, 2010).
Once married, women in such traditional societies are expected to bear sons which could have important consequences for themselves and for existing girl children. Having a first-born son improves the mother’s nutrition intakes and reduces her likelihood of being underweight in China and India (Kishore and Spears, 2014; Li and Wu, 2011). Likewise, women in Pakistan with at least one son are reported to have significantly more say in everyday household decisions
(Javed and Mughal, 2018).
Son preference manifests itself in abnormally high sex ratios through sex-selective abortions, female infanticide and benign neglect of girl child’s health and nutri-tional needs (Sen, 1990). World Bank (2011) reported that around two million girls under the age of five were estimated to be missing every year, most of them in Asia.
In societies where sex-selective abortion is not deemed acceptable, parents con-tinue their fertility as long as the desired number of sons is not attained (Basu
and De Jong, 2010). In this study, we examine the phenomenon of son preference and its fertility implications for women of childbearing age in one such society, namely that of Pakistan. Pakistan is the world’s sixth most populous country with a population of 207 million according to the 2017 population census (Gov-ernment of Pakistan, 2017). The country has a skewed sex ratio of 105 male per 100 female. This ratio, though lower than the high level of 116 reported in the 1951 census, still remains above the world average of 101.
Using data from two rounds of Pakistan Demographic and Health Survey carried out in 1990-91 and 2012-13, we look to answer the following questions: What is the extent and strength of son preference in the country? what are its effects on women’s childbearing? and to what extent does it impact the couple’s desire to continue fertility thereby determining the size of the family?
We examine various aspects of both the revealed and the stated preference for son prevalent in the country. We study the country’s sex ratio, sex ratio at birth (SRB), parity progression ratio (PPR) and sex ratio at last birth (SRLB) as well as the desired sex ratio (DSR) and the desired preference indicator.
We describe the prevalence of son preference among different demographic and geographical subgroups and chart its evolution over time. We employ Probit as well as three matching routines (PSM, IPW and AIPW) to estimate the role of son preference in determining Pakistani women’s reproductive behaviour. Three indicators of son preference (presence of at least one son at parity n, proportion of sons at parity n and number of sons at parity n) are used to determine the incidence and strength of son preference’s impact on subsequent fertility at the first four parities. We also determine the probability of differential birth-stopping decision resulting from actual and stated preference for male offspring.
the first-born. In Pakistan’s high-fertility environment, voluntary birth stopping after the first birth is not a common occurrence. The sex of preceding children is a significant factor in driving subsequent births at higher parities. Women with one or more sons at higher parities are significantly less likely to continue childbearing. The probability of discontinuing childbearing also increases in the number of sons born. Furthermore, women with at least one son are significantly more likely to want no more children than women with no son. This differential stopping behavior has grown in strength over time.
In the following, data and empirical methodology are discussed in Section 2.2. Section 2.3 describes son preference in light of revealed and stated preference measures. Section 2.4 presents our empirical analysis: parity-wise effects of son preference on additional fertility are reported and the role of son preference in determining the desire for having no more children is estimated. The final section interprets the results and draws conclusions.
2.2
Data and Methodology
2.2.1
Data Description
Data for this study come from two rounds of the nationally representative Pak-istan Demographic and Health Survey (PDHS). The first round (PDHS 1990-91) is based on interviews with 6,611 women from 7,193 households. The latest round (PDHS 2012-13) covers 13,558 women from 12,943 households. The survey data is briefly described in the appendix.
For the purpose of our analysis, we restrict the sample to women who have com-pleted their childbearing and have at least one child. Women with multiple births are excluded from the sample.
Table 2.1 describes relevant variables in the dataset. In 2012-13, 50% of the women reported their first-born to be a boy. 76% of the women reported having at least one son at parity 2, 89% had at least one son at parity 3 and 95% had at least one son at parity 4. The figures for the 1990-91 dataset are similar: 52% of the women had a first-born son, 77% had at least one son at parity 2, 89% had at least one son at parity 3 and 95% had at least one son at parity 4.
In 2012-13, 13% of the women at parity 3 reported having three sons, 37% having two sons while 37% reported having one son. Corresponding figures in 1990-91 were 15%, 38% and 35% respectively. At parity 4, 7% of the women in 2012-13 report having sons only, 26% having three sons, 38% having two sons and 22% having just one son. Corresponding figures in 1990-91 were 8%, 25%, 40% and 20% respectively.
Majority of the women in the samples possessed no formal education (61% in 2012-13, 77% in 1990-91). In contrast, a lower proportion of husbands (35% in 2012-13, 48% in 1990-91) reported possessing no formal education. Likewise, 7% of the women in 2012-13 reported having acquired tertiary-level education com-pared with only 1% in 1990-91. In comparison, 15% and 5% of the husbands in 2012-13 and 1990-91 possessed higher education. Average household size during the period was over eight (8.3 in 2012-13, 8.4 in 1990-91). About two-thirds of the households (64% in 2012-13, 64% in 1990-91) lived in rural areas, while over 80% were reported to be nuclear families.
2.2.2
Methodology
The analysis proceeds as follows:
In the first step, we present measures of revealed and stated son preference. Re-vealed son preference is measured through population sex ratio (i.e. the number
T a b le 2 .1: D a ta d es cr ip ti o n V aria bles Desc riptio n P rop o rtion /M ean P DH S 199 0-9 1 P DHS 201 2-1 3 Birth 1 Dum m y v aria ble, tak es th e v alue o f 1 if the w oma n ha s mo re tha n on e chil dren , 0 oth erw ise 0.9 6 0. 96 0.0 3 0. 03 2 Dum m y v aria ble, tak es th e v alue o f 1 if the w oma n ha s mo re tha n tw o chi ldren , 0 ot herw ise 0.9 0 0. 88 0.0 9 0. 11 3 Dum m y v aria ble, tak es th e v alue o f 1 if the w oma n ha s mo re tha n 3 childr en, 0 o ther wise 0.7 9 0. 73 0.2 0 0. 26 4 Dum m y v aria ble, tak es th e v alue o f 1 if the w oma n ha s mo re tha n four child ren, 0 othe rwise 0.6 6 0. 54 0.3 3 0. 45 So n Pr ef erenc e 1 Dum m y v aria ble, tak es th e v alue o f 1 if fe male ha v e a t leas t 1 son at p arit y 1, 0 oth erwi se 0.5 2 0. 05 0.4 7 0. 49 2 Dum m y v aria ble, tak es th e v alue o f 1 if fe male ha v e a t leas t 1 son at p arit y 2, 0 oth erwi se 0.7 7 0. 76 0.2 2 0. 23 3 Dum m y v aria ble, tak es th e v alue o f 1 if fe male ha v e a t leas t 1 son at p arit y 3, 0 oth erwi se 0.8 9 0. 89 0.1 0 0. 10 4 Dum m y v aria ble, tak es th e v alue o f 1 if fe male ha v e a t leas t 1 son at p arit y 4, 0 oth erwi se 0.9 5 0. 95 0.0 4 0. 04 So n Ra tio 1 P rop orti on of so ns in total n um b er o f ch ildre n at p arit y 1 0.5 2 0. 50 2 P rop orti on of so ns in total n um b er o f ch ildre n at p arit y 2 0.5 3 0. 51 3 P rop orti on of so ns in total n um b er o f ch ildre n at p arit y 3 0.5 3 0. 51 4 P rop orti on of so ns in total n um b er o f ch ildre n at p arit y 4 0.5 3 0. 52 N um b er of so ns 1 Dum m y v aria ble, tak es th e v alue o f 1 if the w oma n ha s a so n at p arit y 1 , 0 ot herw ise 0.5 2 0. 50 0.4 7 0. 49 2 Ca tego rical v a riabl e, tak es the v al ue of 0 if th e w o man has n o son at p arit y 2, 1 if 1 son , 2 if 2 so ns 0.2 2 0. 23 0.4 8 0. 50 0.2 9 0. 26 3 Ca tego rical v a riab le, tak es the v al ue of 0 if th e w o man has n o son at p arit y 3, 1 if 1 son , 2 if 2 so ns, 3 if 3 sons 0.1 0 .10 0.3 5 0. 37 0.3 8 0. 37 0.1 5 0. 13 4 Ca tego rical v a riab le, tak es the v al ue of 0 if th e w o man has n o son at p arit y 4, 1 if 1 son , 2 if 2 so ns, 3 if 3 sons , 4 if 4 so ns 0.0 4 0. 04 0.2 0 0. 22 0.4 0 0. 38 0.2 5 0. 26 0.0 8 0. 07 A ge A g e of the fem ale in com ple ted y ea rs 35 .92 3 6.77 A ge d iff erenc e A ge di ffe rence b et w een h usb and and w if e in y ea rs 7.0 7 5. 71 E duca tion Ca tego rical v a riabl e, tak es the v al ue of 0 if th e w o man has n o ed ucat ion, 1 if the w oma n p o ssesse s prim ary edu catio n, 2 if the w o ma n p o ssesses secon dary ed uca tion , 3 if the w om an p ossess es hig her ed uca tion 0.7 7 0. 61 0.0 9 0. 15 0.1 2 0. 16 0.0 1 0. 07 Sp ouse educ ation Ca tego rical v a riabl e, tak es the v al ue of 0 if th e h u sban d p o ssesses no ed ucat ion, 1 if the h usba nd p osses ses prim ary ed ucat ion, 2 if the h u sban d p o ssesses secon dary ed uca tion, 3 if the h usba nd p osses ses hig her e duca tion 0.4 8 0. 35 0.1 5 0. 15 0.3 0 0. 32 0.0 5 0. 15 W om en em plo y e d Dum m y v aria ble, tak es th e v alue o f 1 if the w oma n is e mplo y e d, 0 o ther wise 0.1 6 0. 29 0.8 3 0. 70 M edia ex p os ure Dum m y v aria ble. P DH S 1 990-91: tak es th e v alue of 1 if the w om an list ens ra dio o r w a tc he s telev isi on on ce a w eek , 0 othe rwise ; PDH S 20 12-1 3: ta k e s the v a lue o f 1 if the w oma n w a tc he s telev isi on o c casio nall y , w eek ly or d aily , 0 o the rwise 0.4 5 0. 68 0.5 4 0. 31 F am ily stru cture Dumm y v a riab le, ta k e s the v a lue of 1 if the fami ly is n uc lear, 0 oth erwise 0.8 3 0. 80 0.1 6 0. 19 H ouse hold size T ota l n um b er o f fam ily me m b er s in th e hou seho ld 8.4 0 8. 33 P lace o f reside nce Du mm y v ari able , tak es th e v alu e of 1 if the hou seho ld resid es in urba n are a, 0 o therw ise 0.3 8 0. 35 0.6 1 0. 64 R egio n Ca tego rical v a riabl e (P DH S 199 0-9 1: ta k e s the v a lue of 1 if the ho useh old li v e s in Ba lo chi stan , 2 if the h ous ehold liv es in Pun ja b, 3 if the ho useho ld liv es in Sin dh, 4 if the h ouse hold liv es in K PK ; PD HS 201 2-13 : tak es the v alu e of 1 if th e ho useho ld liv es in Balo chis tan, 2 if the hous ehol d liv es in P unj ab , 3 if the h ous ehold liv es in Si ndh, 4 if the ho useh old li v e s in KP K, 5 if th e hou seho ld liv es in Isla mab ad, 6 if the hou seho ld liv es in Gilg it Bal tista n 0.0 1 0. 03 0.6 3 0. 59 0.2 1 0. 21 0.1 4 0. 15 0.0 05 0.0 07 W eal th St atus Cat egor ical v ari able , tak es th e v alu e of 1-5 fo r hou seho lds b e long ing to p o orest , p o o rer, m iddle , ric h a nd ri chest hou seho ld q uin tiles. 0.1 4 0. 16 0.1 4 0. 19 0.1 7 0. 21 0.2 4 0. 20 0.2 9 0. 22 S ou rc e: Au t h ors ’ cal c u lat ion s u s ing PD HS 1990-91 a nd P D HS 2012-13. S am p le is r es tr icte d to w om en w it h com p let e fe rt ili t y . S am p le w e igh ts ar e u s ed .
of males per 100 females), sex ratio at birth (the number of boys born alive per 100 girls born alive), sex ratio at last birth (SRLB) and parity progression ratio (i.e. the proportion of women at a given parity who proceed to a higher parity)1.
Stated son preference is measured using two indicators: desired sex ratio (ideal number of sons to ideal number of daughters) and desired son preference (indi-cates son preference if the ideal number of sons given by the woman exceeds the ideal number of daughters, suggests equal desired preference if the two numbers are equal, and suggests no son preference if the ideal number of daughters ex-ceeds the ideal number of sons).
The stated preference indicators are based on the following questions in the sur-vey pertaining to desired fertility: “If you could go back to the time you did not have any children and could choose exactly the number of children to have in your whole life, how many would that be?” and ” How many of these children would you like to be boys and how many would you like to be girls?”
In the second step, we estimate the impact of son preference on the probability of subsequent birth at parity n. Here, three indicators are used to represent son preference, namely presence of at least one son, proportion of sons in the total number of children at parity n and the number of sons at parity n. The three indicators each pertain to a different aspect of son preference. We restrict our parity-wise analysis to the first four live births. The outcome variable is subse-quent birth at the parity n. This is a binary variable which takes the value of 1 if a women has more than n children and 0 otherwise.
Finally, we estimate the impact of having one or more sons on the stated desire to discontinue reproduction. Here, the outcome variable is complete fertility which is based on the response “want no more” to the question: ”After the child you
1P P R can be calculated as following, P P R= (Women with n + 1 children)/(Women with
are expecting now, would you like to have another child, or would you prefer not to have any more children”?
In both sets of estimations, we control for individual, household and locational factors which influence fertility decisions. The control factors considered include the respondent woman’s age, age difference with the husband, woman’s and husband’s education level, woman’s employment status, exposure to electronic media, family structure2, household size, household wealth status3, and the re-gion and area of residence. The base line model can be given as,
Yij = α + β(SP )ij + δXj + εij (2.1)
Where Yij represents fertility choice (subsequent birth at parity i / complete
fertility) for woman j, SP stands for son preference at parity i for woman j,
Xj represents the set of household characteristics that can affect reproductive
behaviour and εij is the error term.
2.2.3
Techniques Employed
Our baseline estimations are carried out using Probit model. Additionally, we use three matching techniques, namely Propensity Score Matching (PSM), In-verse Probability Weighting (IPW) and Augmented InIn-verse Probability Weight-ing (AIPW) to account for the possibility that households with sons may differ from those without in ways that could be considered non random. These
match-2A household whose head is neither the woman nor her husband is considered an extended household, nuclear otherwise.
3The household wealth variable is generated by constructing a principal component anal-ysis index of household assets such as home ownership, floor type, water source, electricity availability, durable consumer goods etc. The quintiles of the generated variable indicate the economic status of the household.
ing estimators are based on the Rubin Causal Model with assumptions of uncon-foundedness and overlap (Rosenbaum and Rubin, 1983). For this purpose, the sample is divided into two groups: treatment (based on the variable of interest) and control (non-treatment) group.
The first matching technique PSM matches the treated individuals to the non-treated based on a propensity score for participation given observable character-istics of the individual.
The second technique IPW improves on PSM by according a higher weight to individuals receiving an unlikely treatment. This reweighting helps assign higher weights to individuals lying in the middle of the probability distribution and lower weights to those at the extremes (Wooldridge, 2007).
The last matching technique AIPW combines both the properties of the regres-sion based estimator and the IPW estimator, requiring either the propensity or outcome model (but not necessarily both) to be correctly specified (Cao, Tsiatis, and Davidian, 2009).
For each of the three matching routines, we obtain average treatment effect (ATE) which provides difference between the expected outcomes with and with-out treatment. We use appropriate weights to ensure the representativeness of the sample.
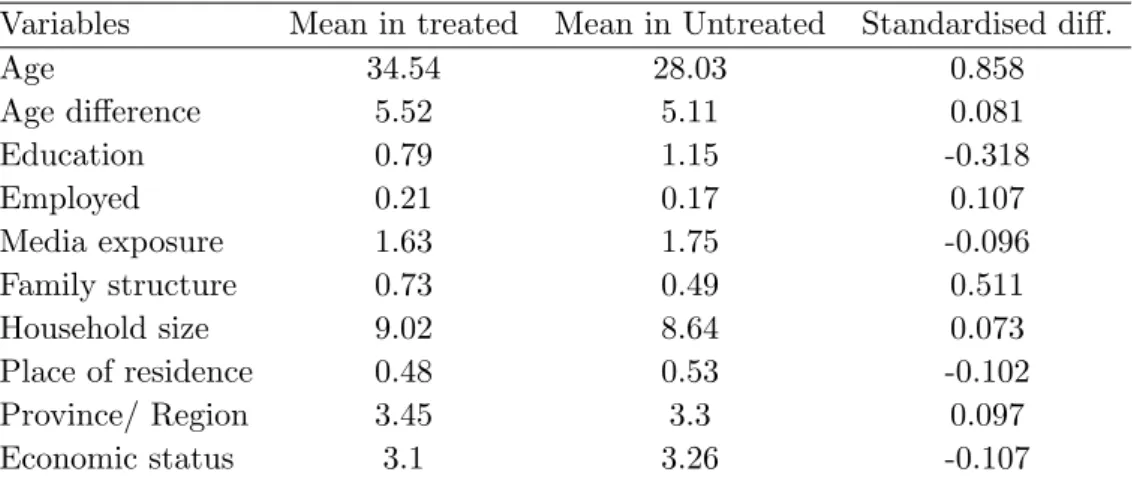
After the PSM estimations, balancing of the treatment groups is checked using Kernel density plots. Plots for the first set of estimations (based on the presence or otherwise of at least one son at parity n) are given in the appendix. The covariates of the two groups are found to be well balanced.
2.3
Son Preference
2.3.1
Sex Ratio
Pakistan’s sex ratio for total population is 105 males per 100 females accord-ing to the 2017 population census. This figure, though lower than that found in some other countries of South Asia (for example, Bhutan: 116, India: 107, Afghanistan: 106), is largely above the worldwide average of 101 males per 100 females (figure 2.1). The country’s sex ratio has steadily come down over the decades from a high of 116 recorded in 1951 in the country’s first census to 105 today (Figure 2.2).
Figure 2.1: Sex ratio of South Asian countries
Source: United Nations, Department of Economic and Social Affairs, Population Division (2017). World Population Prospects: The 2017 Revision, DVD Edition.
Figure 2.2: Evolution of population sex ratio
Sources: Pakistan Bureau of Statistics. Population Association of Pakistan
If we limit our sample to women of childbearing age with complete fertility4,
we trace a minor change in child sex ratios: 114 in 1990-91, 115 in 2012-13 (Table 2.2). In 2012-13, women with primary or secondary education had a higher sex ratio compared to those without any schooling. Likewise, sex ratios among women without a job and those living in joint families are higher compared to those found among working women or those living in nuclear families. The ratio is the highest among middle-income households (those lying in the third or the fourth quantile of the household wealth distribution). At the regional level, the ratio is more biased in rural areas (118 male births per 100 female births) compared with urban areas (107 in 1990-91, 111 in 2012-13). The most populous province of Punjab has the highest sex ratio of all the country’s provinces and territories.
Sex ratio for women respondents with one to four living children shown in Table
4This corresponds to the subsample of women who gave the answer “want no more children” in response to the question “Do you desire more children?”
2.3 ranges from 126 to 191 in 1990-91 and from 125 to 174 in 2012-13. These abnormally high sex ratio figures give a strong indication of differential birth stopping5. The ratio is the highest among women with two children (191 in
1990-91, 174 in 2012-13) suggesting that women stop child-bearing more often when one or both of their two children are boys compared to the situation where they only have girls. This behaviour does not depend on women’s employment status or whether they live in a nuclear or joint family setup. Women living in urban areas have comparatively lower sex ratios than those living in rural areas. Besides, women with some education often have lower sex ratios compared with women with little or no education.
The figures for the 2012-13 sample are generally lower than those for the 1990-91 sample reflecting a declining preference for sons.
Table 2.2: Child sex ratio
PDHS 1990-91 PDHS 2012-13
Total Sons Total Daughters Sex Ratio Total Sons Total Daughters Sex ratio Overall 8027 7065 113.62 17560 15233 115.28 Education No Education 6516 5719 113.94 12042 10501 114.67 Primary 676 603 112.11 2494 2091 119.27 Secondary 777 686 113.27 2198 1909 115.14 Higher - - - 835 732 114.07 Spouse Education No Education 4127 3724 110.82 7084 6114 115.87 Primary 1304 1078 120.96 2867 2444 117.31 Secondary 2224 1957 113.64 5334 4600 115.96 Higher 335 287 116.72 2262 2056 110.02 Woman employed No 6736 5799 116.16 12178 10396 117.14 Yes 1288 1264 101.9 5371 4795 112.01 Family type Joint 1047 754 138.86 2735 2246 121.77 Nuclear 6979 6311 110.58 14834 12986 114.23 Place of Residence Rural 5113 4339 117.84 12051 10251 117.56 Urban 2913 2726 106.86 5519 4981 110.8 Province/Region Punjab 5076 4438 114.38 10414 8720 119.43 Sindh 1771 1584 111.81 3738 3464 107.91 KPK 1092 963 113.4 2607 2328 111.98 Balochistan 86 78 110.26 591 521 113.44 Economic status Poorest 1194 1090 109.54 3425 3024 113.26 Poorer 1225 1035 118.36 3684 3117 118.19 Middle 1420 1224 116.01 3894 3316 117.43 Richer 1877 1669 112.46 3404 3009 113.13 Richest 2309 2045 112.91 3161 2765 114.32
Source: Authors’ calculations using PDHS 1990-91 and 2012-13. Sample is restricted to women with complete fertility. Sample weights are used. Subgroups with less than 100 observations are omitted.
5An alternative explanation could be under reporting of girls in the survey. See for reference
Table 2.3: Sex ratio by number of children born
PDHS 1990-91 PDHS 2012-13 Total Children Total Children 2 3 4 2 3 4 Overall 191.18 144.64 126.26 174.1 149.12 125.44 Education No Education 252.83 151.74 132.03 158.74 165.57 130.73 Primary 125 137.21 126.67 177.19 166.85 136.08 Secondary 120.69 137.97 112.75 200 127.56 117.63 Higher - - - 170.41 126.78 99.16 Spouse Education No Education 184.62 171.84 132.51 151.58 142.58 138.28 Primary - - 134.21 135.94 179.76 143.29 Secondary 170.27 150.38 118.33 208.62 154.02 120.49 Higher - 104.69 121.82 177.88 127.48 107.33 Women employed No 202.35 155.08 128.38 168.06 154.36 121.77 Yes - - 144.28 193.07 133.8 137.43 Family type Joint - 186.41 144.73 168.28 167.6 114.29 Nuclear 200 131.93 120.47 177.14 143.04 128.72 Place of Residence Rural 257.14 157.4 136.09 183.67 156.36 135.29 Urban 145.76 132.57 114.39 162.76 140.68 111.76 Province/Region Punjab 253.19 158.41 134 179.91 159.29 130.47 Sindh - 110.23 113.74 160.58 121.74 108.93 KPK - 147.5 109.72 177.78 148.89 126.23 Balochistan - - - -Economic status Poorest - 147.82 127.43 - 125.45 141.47 Poorer - - 120.83 200 188.97 148.38 Middle - - 165 163.83 148.41 138.82 Richer - 143.22 104.45 179.21 136.55 120.99 Richest - 158.58 120.26 177.33 150.4 103.66
Source: Authors’ calculations using PDHS 1990-91 and 2012-13. Sample is restricted to women with complete fertility. Sample weights are used. Subgroups with less than 100 observations are omitted.
Table 2.4 shows sex ratios for the subsamples of women who suffered the death of one or more of their children and those who did not. Sex ratios for the former group of women are considerably below those belonging to the latter group. Women with one or more deceased children had an overall sex ratio of 107 boys per 100 girls in 1990-91 and 111 boys per 100 girls in 2012-13. In contrast, women with no child death had a higher sex ratio of 117.
These differences persist regardless of women’s level of education, employment status, family type or place of residence and point to low gender preference among women with child loss.
2.3.2
Sex Ratio at Birth
Sex ratio at birth (SRB) is another useful indicator of son preference. Pakistan’s SRB, at 109 male births per 100 female births, is the second highest in the region
Table 2.4: Sex ratio by child loss PDHS 1990-91 PDHS 2012-13 No Yes No Yes Overall 117.41 106.76 117.02 110.96 Education No Education 118.09 107.17 116.32 111.46 Primary 118.7 99.5 120.4 115.18 Secondary 113.26 113.28 118.94 84.98 Higher 102.08 75 111.52 210.53 Spouse Education No Education 116.18 102.53 117.02 113.79 Primary 121.84 119.45 124.52 101.69 Secondary 118.32 102.73 117.09 111.59 Higher 110.57 190.91 109.85 111.11 Woman employed No 119.96 108.97 117.97 114.55 Yes 104.41 98.26 115.46 105.62 Family type Joint 144.36 124.88 123.49 114.98 Nuclear 113.77 105.08 115.75 110.47 Place of Residence Rural 106.12 108.14 113.51 100.84 Urban 124.66 105.87 118.92 114.43 Province/Region Punjab 118.21 107.96 121.44 114.54 Sindh 112.73 109.79 106.42 112.01 KPK 121.49 94.88 116.36 96.06 Balochistan 115.52 90 120.5 96.88 Economic status Poorest 111.08 106.91 111.71 115.65 Poorer 123.76 108.38 121.73 111.37 Middle 123.52 102.1 120.4 108.4 Richer 115.61 106.86 116.21 104.17 Richest 115.55 108.12 114.27 114.4
Source: Authors’ calculations using PDHS 1990-91 and 2012-13. Sample is restricted to women with complete fertility. Sample weights are used.
after India’s ratio of 110.9 (Figure 2.3). This ratio is above the normal biological ratio of 105 male per 100 female births.
According to PDHS data, the country’s SRB increased from 105 in 1990-91 to 109 in 2012-13 (Figure 2.4).
Figure 2.3: Sex ratio at birth - South Asian countries
Source: United Nations, Department of Economic and Social Affairs, Population Division (2017). World Population Prospects: The 2017 Revision, DVD Edition.
Figure 2.4: Sex ratios at birth - 1990-91 – 2012-13